Carranza E. Geochemical anomaly and mineral prospectivity mapping in GIS
Подождите немного. Документ загружается.

60 Chapter 3
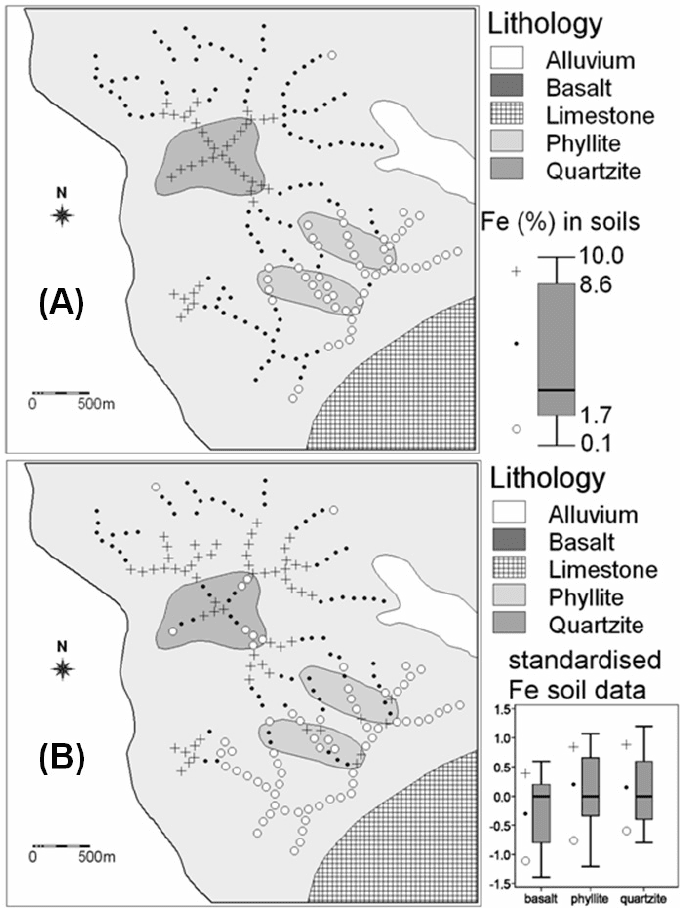
whereas anomalies are represented by large crosses. Because extremely low background
values and anomalies are usually fewer, if not absent, compared to other data values in
an exploration uni-element geochemical data set, the large symbols for the former data
values will not dominate a map. Low background values and high background values are
represented by small circles and small crosses, respectively. Background values are each
marked with the smallest symbol – a dot – because they are expected to dominate the
data and its map.
Fig. 3-6A shows a map of spatial distribution of Fe contents in soils based on boxplot
classes defined from the whole data set (Fig. 3-3). The spatial distributions of the Fe
data, based on the boxplot classes of the whole data set, can be explained readily by
variations in lithology. Fig. 1-1A shows very similar distribution of the Fe data, although
the classes were defined based on a-priori knowledge that variations in the Fe data are
influenced strongly by one of the lithologic units. Thus, geochemical data classification
based on a boxplot and the EDA-mapping symbols has strong ability to portray
physically meaningful spatial distributions of uni-element data without assumption of the
normal distribution model or a-priori information about certain factors that influence
variability in a geochemical data set.
Further exploratory analysis of subsets of a uni-element geochemical data set
according to certain criteria could provide further insight into processes that plausibly
influence variations in the data set. For example, based on subsets of the Fe data
according to rock type at sample sites (Fig. 3-5B) and after standardisation according to
equation (3.10), soils on phyllite immediately around the basalt unit are shown to be high
background in Fe compared to soils on phyllite farther away from the basalt (Fig. 3-6B).
The plausible explanation could be contamination of soils on phyllite by soils derived
from the basalt. In contrast, soils at the outer portions of the basalt unit are shown to be
low background in Fe compared to soils at the inner portions of the basalt unit. The
plausible explanation could be contamination of soil on basalt by soils derived from the
phyllite. Thus, uni-element geochemical maps based on resistant classes defined by a
boxplot of a whole data set or data subsets are potentially useful in interpretation of
processes that control variations in the geochemical landscape.
Instead of using different EDA point-symbols, boxplot classes can be represented
with the same and equal-sized point-symbols but with different shades of grey (Fig. 3-4)
or different colours (e.g., Reimann, 2005). Grey-scale or colour-scale representations are
appropriate for interpolated uni-element geochemical data, although the classes must be
defined from a boxplot of original data at sampling points. The symbols or colours used
to represent classes of an exploration uni-element geochemical data set, as defined
through a boxplot, serve to objectively portray in a map the structure and spatial
distribution of that data set with a balanced aesthetic (visual) impression.
Exploratory Analysis of Geochemical Anomalies 61
Fig. 3-6. Spatial distributions of the Fe data based on boxplot classes and EDA mapping symbols
(cf. Fig. 1-1A). (A) Classified Fe values in the whole data set. (B) Classified standardised Fe
values (using equation (3.10)) in subsets of the data according to rock type at sample sites.
62 Chapter 3
APPLICATIONS OF GIS IN EDA
Management of spatial data
EDA clearly requires a spatial database of sample location coordinates, geochemical
data attributes and other pertinent geological and geomorphological attributes that may
have been recorded during the field sampling campaign. A spatial database may or may
not be created in a GIS. On the one hand, because there are GIS software packages that
do not have EDA statistical and graphical tools, a spatial database created in a GIS
should be readily exportable to or importable by any statistical software package that
supports EDA. On the other hand, because most statistical software packages do not
have mapping tools, a spatial database created outside a GIS must be readily exportable
to or importable by the GIS software available to the user. Thus, inter-operability of a
spatial database between a GIS and an EDA-supporting statistical software package is
highly desirable.
Operations on spatial data
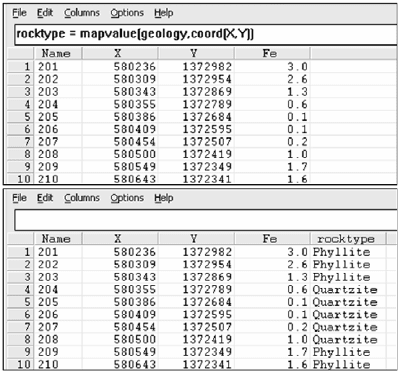
Spatial query operations in a GIS are useful in subdividing a uni-element
geochemical data set into subsets according to certain spatial attributes of variables (e.g.,
lithology) that control geochemical variability. There may be cases where the digital
geochemical database acquired does not consist of other thematic data attributes (e.g.,
lithology at sample sites) that are important for analysis and interpretation, but such
thematic data are available as digital maps (vector or raster). In such cases, a spatial join
operation (see Chapter 2) between a map of point sample locations and a thematic map
can be performed to add a new thematic data attribute in the geochemical database.
Depending on GIS software, a spatial join operation can be performed simply via table
calculation (Fig. 3-7). In some GIS software, adding new thematic attributes in a
geochemical database requires a map intersect operation followed by a table join
operation. The newly added attribute can then be used as categorical variable in creating
boxplots (Fig. 3-5).
Classification of a uni-element geochemical data set (or subsets) as well as
standardisation of geochemical data according to boxplot-defined classes and EDA
statistics can be performed in a GIS. These operations can be carried out via either
attribute table calculation or map calculation. Fig. 3-8 shows an example of a table
calculation to standardise the soil Fe data based on the median and IQR of data subsets
according to rock type at sample site (see Fig. 3-5A) and using equation (3.10).
Visualisation of spatial data or geo-information
A GIS can clearly support mapping and visualisation of EDA results in order to
describe or explain plausible underlying processes that govern the spatial distributions of
uni-element geochemical data. Maps of geochemical attributes or derivative attributes
using, say boxplot-defined classes, can be readily created in a GIS (e.g., Fig. 3-6). Most
Exploratory Analysis of Geochemical Anomalies 63
GIS software packages support mapping symbols used in EDA. The map overlay
functionality of GIS, which allows maps to be stacked on top of each other, clearly
enhances visualisation of spatial geo-information derived from EDA (Fig. 3-6).
CASE STUDY
This case study demonstrates (a) the performance of two EDA-derived threshold
values – boxplot UW and median+2MAD – against the performance of the traditional
mean+2SDEV threshold and (b) usefulness of standardised data values based on EDA
statistics in recognition of multi-element geochemical anomalies.
Study area and spatial data
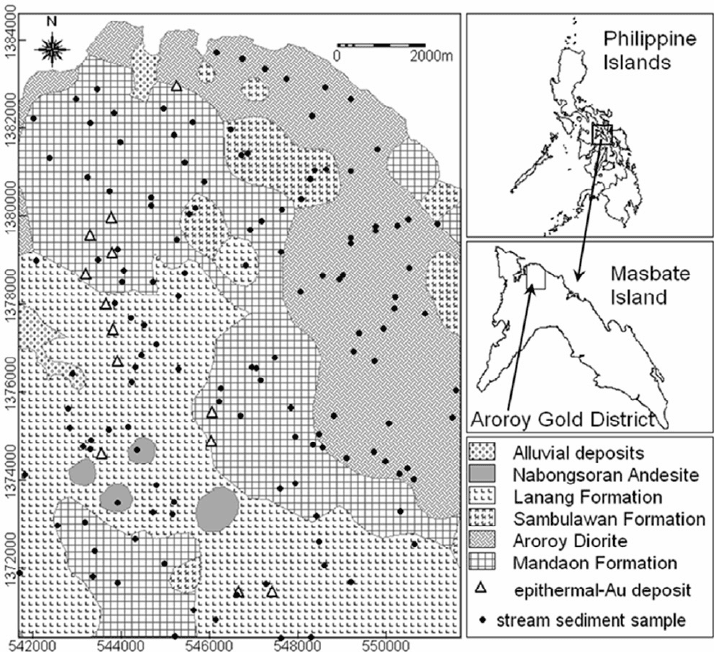
The Aroroy district is located in the northwestern portion of Masbate Island in the
Philippines (Fig. 3-9). The topography of the area is characterised by moderate relief and
gently rolling to moderate slopes with elevations varying from zero to about 630 m and
averaging about 110 m. Vegetation in the area consists mostly of grasses and shrubs. The
average annual rainfall in Masbate is about 1,500 mm.
The Eocene-Oligocene Mandaon Formation, consisting mainly of andesitic-dacitic
agglomerates, comprises the oldest rocks in the area (Fig. 3-9). The Miocene Aroroy
Diorite, which varies in composition from quartz diorite to hornblende diorite, intruded
the Mandaon Formation. Unconformably overlying the Mandaon Formation and the
Fig. 3-7. Adding a thematic attribute to a geochemical database in a GIS. A table calculation
formula (using software syntax) is executed in the command line (blank space at top) of the table.
The particular calculation formula shown here, rocktype = mapvalue(geology,coord(X,Y)),
uses an operator (mapvalue), which extracts attributes (rocktype) from a map (geology) at
locations with the x,y coordinates [coord(X,Y)] of the geochemical samples.

64 Chapter 3
Aroroy Diorite are feldspathic wackes belonging to the Early Miocene Sambulawan
Formation. Andesitic lithic tuffs (Late Miocene to Early Pliocene Lanang Formation)
disconformably overlie the Mandaon Formation and the Sambulawan Formation. The
Pliocene Nabongsoran Andesite consists of porphyritic stocks, plugs and dikes that
intrude into the series of dacitic-andesitic volcano-sedimentary rocks (i.e., the Mandaon,
Sambulawan and Lanang Formations) and the Aroroy Diorite. The Nabongsoran
Andesite porphyry intrusions, many of which are not mappable at the map scale of Fig.
3-9, are probably responsible for either high-sulphidation (Mitchell and Balce, 1990) or
low-sulphidation (Mitchell and Leach, 1991) hydrothermal alteration and epithermal Au
mineralisation in the intruded rocks. Gold, in at least 13 mineral deposit occurrences in
the area (Fig. 3-9), is associated with sulphide (mainly pyritic) minerals in wide-sheeted
and manganese-bearing quartz or silicified veins in generally northwest-trending
faults/fractures that cut the volcano-sedimentary rocks.
A subset of stream sediment geochemical data (135 out of more than 2,200 samples
analysed for Cu, Zn, Ni, Co, Mn, As; JICA-MMAJ, 1986) pertaining to the study area is
used. This subset of geochemical data represents a total drainage basin area of about 101
km
2
(i.e., a sampling density of one sample per 1-2 km
2
). In the geochemical data for As,
40 stream sediment samples have censored values (i.e., half the detection limit of 0.5
ppm As). The geochemical data, lithological map and locations of the epithermal Au
deposits were compiled in a GIS. These spatial data sets were used by Carranza (2004a)
in a case study of GIS-based modeling of stream sediment geochemical anomalies.
Fig. 3-8. GIS-based standardisation of uni-element attributes using EDA statistics. A table
calculation formula (using software syntax) is executed in the command line (blank space at top)
of the table. The particular calculation formula shown uses a composite if-then expression to
standardise Fe values according to values of median and IQR in subsets of the data according to
rock type at sample site (see Fig. 3-5A) and using equation (3.10).
Exploratory Analysis of Geochemical Anomalies 65
Analysis of uni-element data distributions
In the initial stages of modelling significant anomalies, exploration geochemists
“eyeball” each uni-element data set in order to obtain impressions about the data
structure, behaviour, local densities, gaps and, of course, outliers. Descriptive statistics
and statistical graphics are the useful tools in “eyeballing” empirical density distributions
of uni-element data sets. Careful study of empirical density distributions of uni-element
data sets is very important in the analysis and modeling of geochemical anomalies.
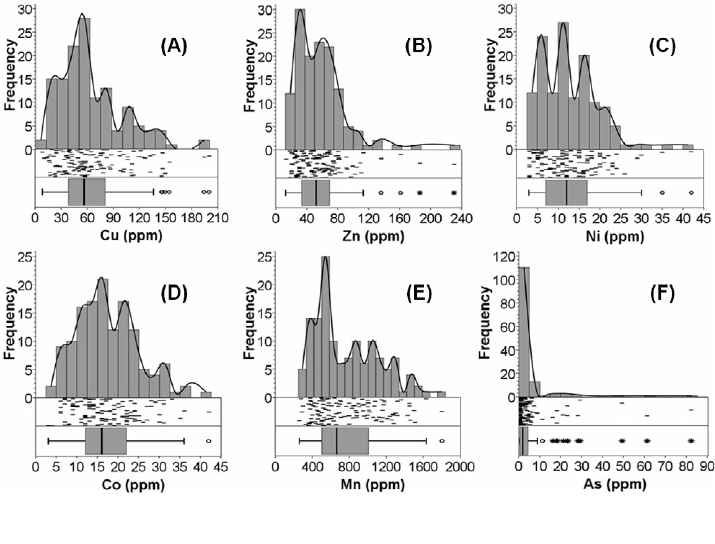
In the study area, the empirical density distributions of each of the raw uni-element
data sets are all asymmetric, i.e., they are positively-skewed (or right-skewed) (Figs. 3-
10). In the individual raw uni-element data sets, the means are greater than the medians
Fig. 3-9. Simplified lithological map (modified from Baybayan and Matos (1986) and JICA-
MMAJ (1986)) and locations of stream sediment geochemical samples (JICA-MMAJ, 1986) in the
Aroroy district, Masbate, Philippines. Map coordinates are in metres (UTM projection, zone 51).
66 Chapter 3
and the SDEVs are greater than the MADs (Table 3-I). Because the individual uni-
element data sets are either moderately or strongly right-skewed, the values of their
mean–2SDEV are mostly negative whilst the values of their median–2MAD are mostly
positive. The negative values of the mean-2SDEV indicate that estimates of the mean in
the individual raw uni-element data sets are statistically non-significant. It follows that
any estimate of threshold values according to the mean+2SDEV is non-meaningful. The
asymmetric distributions of the individual uni-element data sets thus call for application
of suitable transformations because “data should approach a symmetrical distribution
before any threshold estimation methods are applied” (Reimann et al., 2005).
Several types of numerical transformation functions can be applied in order to reduce
asymmetry of empirical density distribution of uni-element data (Miesch, 1977; Garrett
et al., 1980; Joseph and Bhaumik, 1997). The purpose of transforming geochemical data
should not be to obtain a (near) normal density distribution, as this is virtually
impossible considering that most, if not all, exploration geochemical data sets are multi-
modal (Fig. 3-10). For purposes of illustration, log
e
-transformation is applied here.
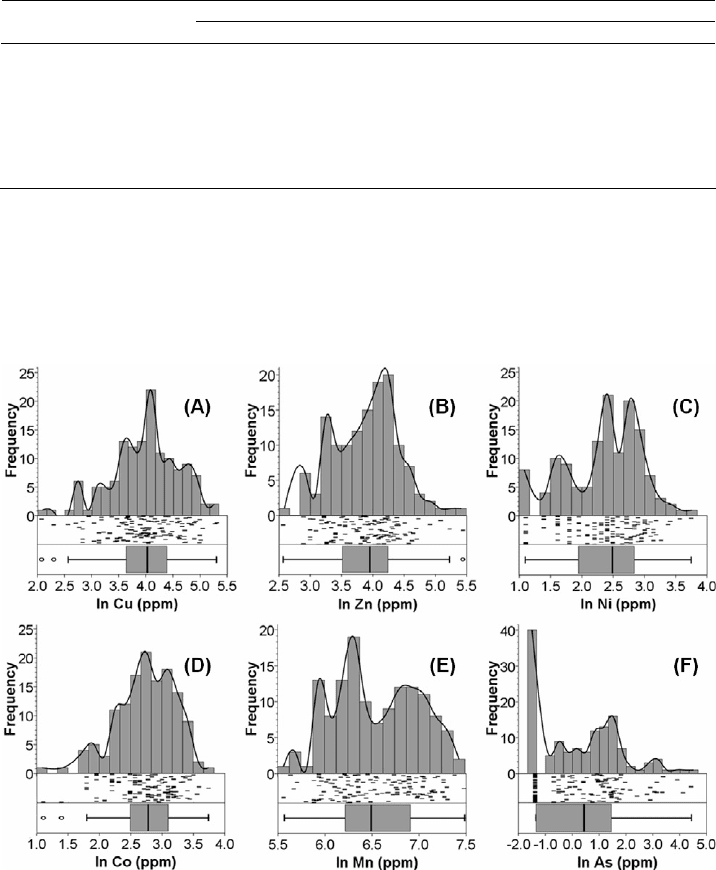
The empirical density distributions of each of the log
e
-transformed uni-element data
sets have better symmetry compared to the respective raw data sets (Figs. 3-11) such that
the anti-logs of both the SDEVs and MADs of the log
e
-transformed data sets are much
smaller than those of the raw data sets (Table 3-I). The empirical density distributions of
Fig. 3-10. Histograms and EDA graphics of empirical density distributions of the raw uni-element
data sets, Aroroy district (Philippines). (A) Cu. (B) Zn. (C) Ni. (D) Co. (E) Mn. (F) As.
Exploratory Analysis of Geochemical Anomalies 67
the log
e
-transformed data sets do not, however, strictly follow a normal distribution
model (Fig. 3-12). In the individual log
e
-transformed uni-element data sets, the medians
TABLE 3-I
Classical and EDA statistics of uni-element concentrations (in ppm) in the raw and log
e
-
transformed data for n=135 samples (except As*, for which n=95), Aroroy district (Philippines).
Mean SDEV Median MAD
Min. Max.
Raw Log
e
Raw Log
e
Raw Log
e
Taw Log
e
Cu 8 200 64.04 3.98 37.84 0.62 56 4.03 20 0.38
Zn 13 230 56.90 3.90 32.43 0.52 52 3.95 18 0.37
Ni 3 42 12.59 2.37 6.86 0.59 12 2.48 5 0.40
Co 3 42 17.32 2.75 7.37 0.47 16 2.77 5 0.29
Mn 260 1800 769.93 6.55 345.69 0.45 660 6.49 230 0.37
As 0.25 82 4.62 0.34 10.62 1.49 1.5 0.41 1.25 1.14
As* 0.5 82 6.45 1.06 12.22 1.17 3.0 1.10 2.00 0.69
*without censored values.
Fig. 3-11. Histograms and EDA graphics of empirical density distributions of the log
e
-transformed
(ln) uni-element data sets, Aroroy district (Philippines). (A) Cu. (B) Zn. (C) Ni. (D) Co. (E) Mn.
(F) As.
68 Chapter 3
are slightly greater than the means and the SDEVs are all greater than the MADs (Table
3-I). In addition, the values of either the mean–2SDEV or the median–2MAD in the log
e
-
transformed data sets are mostly positive, except for the As data set. The results indicate
that estimates of the classical descriptive statistics, unlike the estimates of the EDA
descriptive statistics, are much more sensitive to values at/near one or both tails of any
data set. The results also show that the log
e
-transformation has reduced the influence of
very low or very high values at/near one or both tails of any of the data sets and thus
improved the symmetry of their empirical density distributions. However, for the As data
set, the log
e
-transformation is still insufficient to proceed to threshold estimation.
The individual raw uni-element data sets are all multi-modal, indicating presence of
at least two populations (Figs. 3-10 and 3-11), which means that each data set must be
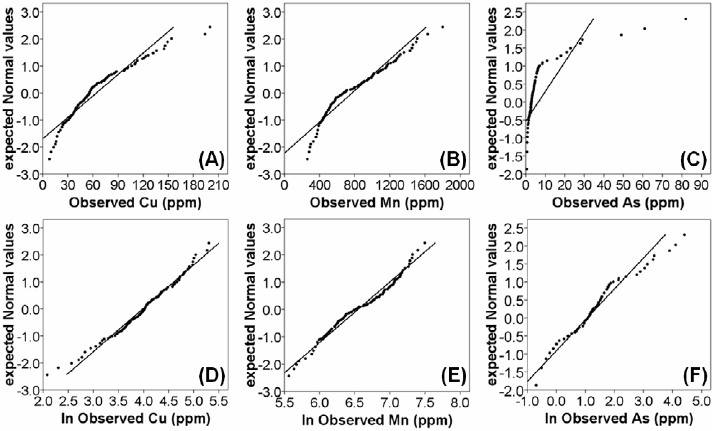
subdivided into subsets representing each population. Graphical examination of a
probability (or Q-Q) plot of a uni-element data can be useful in defining population
break points (Sinclair, 1974). Identifying population break points in a probability (or Q-
Q) plot is, however, highly subjective, requires experience and, thus, is not a trivial task.
For example, inflection points are relatively easier to identify in the Normal Q-Q plots of
the log
e
-transformed data sets for Mn and As than in the Normal Q-Q plot of the log
e
-
transformed data for Cu (Figs. 3-12D to 3-12F). Nonetheless, the presence of at least two
populations in each of the individual uni-element data sets is plausibly mainly due to
lithology. Each of uni-element data sets was then subdivided into two subsets according
to rock type at every sample location. The samples in areas underlain by diorite have
Fig. 3-12. Normal Q-Q plots of selected uni-element data (Aroroy district, Philippines) showing
their deviations from the normal distribution (straight line) model. Raw data of (A) Cu, (B) Mn
and (C) As. Log
e
-transformed (ln) data of (D) Cu, (E) Mn and (F) As.
Exploratory Analysis of Geochemical Anomalies 69
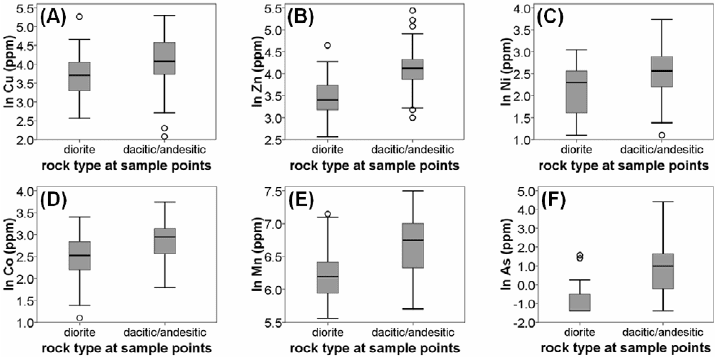
rather lower concentrations of each of the elements under study than the samples in areas
underlain by dacitic/andesitic rocks (Table 3-II, Fig. 3-13). The outliers of Cu, Zn and
As in samples in areas underlain by diorite (Figs. 3-13A, 3-13B and 3-13F) would not be
recognised if thresholds based on the UWs of boxplots of the whole log
e
-transformed
data sets for these elements (Figs. 3-11A, 3-11B and 3-11F) were used in mapping.
Censored values must be removed especially if they form one population (Fig. 3-
11F) because they result in reduced estimates of the descriptive statistics of the whole
data set (Table 3-I) and potentially affect recognition of outliers. The boxplot of the log
e
-
transformed As data inclusive of the censored values (Fig. 3-11F) does not show any
outliers, whereas the boxplot of the log
e
-transformed As data exclusive of the censored
values indicates the presence of outliers (Fig. 3-14A). The histogram and Normal Q-Q
plot of the log
e
-transformed As data exclusive of the censored values indicates the
presence of at least two populations (Fig. 3-14). Boxplots of the data subsets according
to rock type at sample points show As outliers in samples in areas underlain by diorite
and by dacitic/andesitic rocks. However, exclusive of the censored As data, the subset of
samples in areas underlain by diorite is now very small (n=13; Table II), so probably
only the descriptive statistics of the As data subset for samples in areas underlain by
dacitic/andesitic rocks are meaningful.
Analysis of empirical density distributions of uni-element data sets or subsets should
also be coupled with visualisation of their spatial distributions to determine whether any
data treatment results in explicable or meaningful spatial patterns. Maps depicting spatial
distributions of uni-element data, say based on boxplot-defined classes and EDA
mapping symbols, are useful tools in eyeballing the data. For the study area, the maps in
Fig. 3-15 indicate that the lithology has strong controls on the spatial distributions of
most of the individual uni-element data, whereas the epithermal Au deposit occurrences
Fig. 3-13. Boxplots of subsets of the log
e
-transformed (ln) uni-element data according to rock type
at sample points, Aroroy district (Philippines). (A) Cu. (B) Zn. (C) Ni. (D) Co. (E) Mn. (F) As.