Руководство по работе с пакетом GraphViz.
Dot User’s Manual, January 26, 2006
Abstract
dot draws directed graphs as hierarchies. It runs as a command line program,
web visualization service, or with a compatible graphical interface.
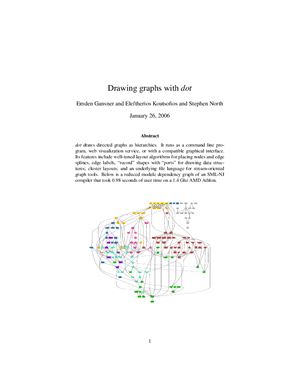
Its features include well-tuned layout algorithms for placing nodes and edge
splines, edge labels, record shapes with ports for drawing data structures;
cluster layouts; and an underlying file language for stream-oriented
graph tools. Below is a reduced module dependency graph of an SML-NJ
compiler that took 0.98 seconds of user time on a 1.4 Ghz AMD Athlon.
1 Basic Graph Drawing
dot draws directed graphs. It reads attributed graph text files and writes drawings,
either as graph files or in a graphics format such as GIF, PNG, SVG or PostScript
(which can be converted to PDF).
dot draws a graph in four main phases. Knowing this helps you to understand
what kind of layouts dot makes and how you can control them. The layout procedure
used by dot relies on the graph being acyclic. Thus, the first step is to break
any cycles which occur in the input graph by reversing the inteal direction of
certain cyclic edges. The next step assigns nodes to discrete ranks or levels. In a
top-to-bottom drawing, ranks determine Y coordinates. Edges that span more than
one rank are broken into chains of virtual nodes and unit-length edges. The third
step orders nodes within ranks to avoid crossings. The fourth step sets X coordinates
of nodes to keep edges short, and the final step routes edge splines. This is
the same general approach as most hierarchical graph drawing programs, based on
the work of Warfield [War77], Carpano [Car80] and Sugiyama [STT81]. We refer
the reader to [GKNV93] for a thorough explanation of dot’s algorithms.
dot accepts input in the DOT language (cf. Appendix A). This language describes
three kinds of objects: graphs, nodes, and edges. The main (outermost)
graph can be directed (digraph) or undirected graph. Because dot makes layouts
of directed graphs, all the following examples use digraph. (A separate
layout utility, neato, draws undirected graphs [Nor92]. ) Within a main graph, a
subgraph defines a subset of nodes and edges.
2 Drawing Attributes
3 Advanced Features
4 Command Line Options
5 Miscellaneous
6 Conclusions
7 Acknowledgments
Dot User’s Manual, January 26, 2006
Abstract
dot draws directed graphs as hierarchies. It runs as a command line program,
web visualization service, or with a compatible graphical interface.
Its features include well-tuned layout algorithms for placing nodes and edge
splines, edge labels, record shapes with ports for drawing data structures;
cluster layouts; and an underlying file language for stream-oriented
graph tools. Below is a reduced module dependency graph of an SML-NJ
compiler that took 0.98 seconds of user time on a 1.4 Ghz AMD Athlon.
1 Basic Graph Drawing
dot draws directed graphs. It reads attributed graph text files and writes drawings,
either as graph files or in a graphics format such as GIF, PNG, SVG or PostScript
(which can be converted to PDF).
dot draws a graph in four main phases. Knowing this helps you to understand
what kind of layouts dot makes and how you can control them. The layout procedure
used by dot relies on the graph being acyclic. Thus, the first step is to break
any cycles which occur in the input graph by reversing the inteal direction of
certain cyclic edges. The next step assigns nodes to discrete ranks or levels. In a
top-to-bottom drawing, ranks determine Y coordinates. Edges that span more than
one rank are broken into chains of virtual nodes and unit-length edges. The third
step orders nodes within ranks to avoid crossings. The fourth step sets X coordinates
of nodes to keep edges short, and the final step routes edge splines. This is
the same general approach as most hierarchical graph drawing programs, based on
the work of Warfield [War77], Carpano [Car80] and Sugiyama [STT81]. We refer
the reader to [GKNV93] for a thorough explanation of dot’s algorithms.
dot accepts input in the DOT language (cf. Appendix A). This language describes
three kinds of objects: graphs, nodes, and edges. The main (outermost)
graph can be directed (digraph) or undirected graph. Because dot makes layouts
of directed graphs, all the following examples use digraph. (A separate
layout utility, neato, draws undirected graphs [Nor92]. ) Within a main graph, a
subgraph defines a subset of nodes and edges.
2 Drawing Attributes
3 Advanced Features
4 Command Line Options
5 Miscellaneous
6 Conclusions
7 Acknowledgments