ACCA F2 Management Accounting - 2010 - Study text - Emile Woolf Publishing
Подождите немного. Документ загружается.


Chapter 2: Cost classification
© EWP Go to www.emilewoolfpublishing.com for Q/As, Notes & Study Guides 35
Prime cost
The prime cost of an item is its total direct cost.
$
Direct material cost A
Direct labour cost B
Direct expenses C
Prime cost A + B + C
2.2 Indirect costs (overheads)
An indirect cost or overhead cost is any cost that is not a direct cost, so that its
entire cost cannot be attributed in full to the item that is being costed.
Indirect labour is the cost of labour that cannot be attributed in full to the item
being costed. The nature of indirect labour costs is explained in more detail later.
Indirect expenses are expenses that cannot be attributed in full to an item that is
being costed. For example, the rental costs for a factory and the costs of gas and
electricity consumption for a factory cannot be attributed in full to any particular
units of production. They are indirect production costs (production overheads).
In a manufacturing company, all costs of administration are usually treated as
indirect costs (administration overheads) and all or most sales and distribution costs
are also usually treated as sales and distribution overheads.
Indirect material costs
Indirect materials are any materials that are used or consumed that cannot be
attributed in full to the item being costed. Indirect materials are treated as an
overhead cost, and may be classified as production overheads, administration
overheads or sales and distribution overheads.
Indirect materials in production include cleaning materials and any materials used
by production departments or staff who are not engaged directly in making a
product. In a restaurant, indirect materials will include the cost of salt, pepper and
spices that are used by the kitchen staff for most meals, but which cannot be
attributed to any specific meal.
Indirect production materials may also include some items of materials that are
inexpensive and whose cost or value is immaterial. These may include nails, nuts
and bolts, buttons and thread, and so on. The effort of measuring a cost for these
materials is not worth the value of the cost information that would be produced;
therefore these ‘direct’ materials are often treated as indirect materials.
Example
In which of the following types of company would fuel costs be treated as a direct
material cost?
1. Manufacturing company
2. Road haulage (road transport) company

Paper F2: Management Accounting
36 Go to www.emilewoolfpublishing.com for Q/As, Notes & Study Guides © EWP
3. Construction company
4. Motorway fuel station
Solution
Manufacturing company. Fuel costs are an indirect expense. Fuel used in the
company’s vehicles is unlikely to be considered a material cost at all, but would be
treated as an overhead expense.
Road haulage company. Since fuel is a major cost of operating a road haulage
service, fuel costs are likely to be treated as a direct material cost of operations.
Construction company. Fuel costs are likely to be an indirect expense, for the same
reasons that apply to a manufacturing company.
Motorway service station. This sells fuel to customers. In a retail operation, items
sold to customers are direct costs of sale. The cost of the fuel sold is therefore a
direct material cost (= a cost of sale).
Indirect labour costs
Indirect labour costs consist mainly of the cost of indirect labour employees. Indirect
labour employees are individuals who do not work directly on the items that are
produced or the services that are provided.
In a manufacturing environment, indirect labour employees include staff in the
stores and materials handling department (for example, fork lift truck drivers),
supervisors, and repairs and maintenance engineers.
All employees in administration departments and marketing departments (sales
and distribution staff) – including management – are normally indirect employees.
2.3 Full cost
The full cost of a unit of product (or the full cost of a unit of service) is a cost that
includes both direct costs and some overheads. The full cost of a unit of product
might be analysed as follows:
$
Direct materials cost 4
Direct labour cost 5
Direct expenses 1
Prime cost 10
Production cost
Manufacturing overhead (or production overhead) 8
Full production cost 18
Administration overhead 3
Non-production cost
Selling and distribution overhead 4
Full cost of sale 25

Chapter 2: Cost classification
© EWP Go to www.emilewoolfpublishing.com for Q/As, Notes & Study Guides 37
Notes:
1 Prime cost plus a share of production overheads are the full production cost or
‘fully absorbed production cost’ of the cost unit.
2 In cost accounting systems, it is common practice to include production
overheads in unit costs and measure the full production cost per unit. However,
administration and selling and distribution overhead costs are not usually
included in the cost of each unit. Instead, they are treated in total as an expense
for the period (‘period costs’).

Paper F2: Management Accounting
38 Go to www.emilewoolfpublishing.com for Q/As, Notes & Study Guides © EWP
Cost objects, cost units and cost centres
Cost objects and cost units
Cost centres
3 Cost objects, cost units and cost centres
3.1 Cost objects and cost units
A cost accounting system measures the costs of cost objects, and often presents the
information as a cost per unit of the cost object.
A cost object is an item whose cost is measured.
A cost unit is a unit of the cost item.
Cost objects and cost units should be selected so as to provide management with the
cost information they require.
Here are some examples of cost objects and cost units
Industry/activity Cost object Cost unit
Car manufacture Cars produced A car
Bakery Bread produced A batch of bread items
Steel works Steel produced Tonne of steel
Carpet manufacture Carpets produced Square metre of carpet
Retail operation Cost of items sold Cost per $1 sales
Passenger transport
service
Cost of transporting
customers
Cost per passenger/mile
(i.e. average cost of
transporting a passenger one
mile)
Road haulage Cost of transporting
items
Cost per tonne/mile
(i.e. average cost of carrying
one tonne of items for one
mile)
University Cost of teaching Cost per student

Chapter 2: Cost classification
© EWP Go to www.emilewoolfpublishing.com for Q/As, Notes & Study Guides 39
Example 1
A company manufactures tinned foods. It has two products, tinned carrots and
tinned beans. In its costing system, it has two cost objects, carrots and beans. The
costing system measures the costs and revenues for each cost object.
The costing system will also provide information about the cost per tin of carrots
and the cost per tin of beans. These are cost units.
Cost object Cost unit
1 Carrots Production cost per tin of carrots
2 Beans Production cost per tin of beans
Example 2
Another company manufactures a single product at two factories, one in the North
of the country and one in the South of the country. Its costing system might
measure:
the cost of operating the factory in the north and the factory in the south (cost
objects), and also
the total operating cost in each factory per hour of labour worked, or the total
operating cost per employee at each factory (these are cost units).
Example 3
A transport company has a bus depot. The company has a cost accounting system
that records and measures the cost of operating the bus depot. The costs of operating
the depot are measured in three ways, as follows:
Cost object Cost unit
1 Buses Operating cost per bus per month
2 Bus routes Operating cost per month for each bus route
3 Bus drivers Cost of operating the depot per month, per bus
driver employed
3.2 Cost centres
Cost centres have been described so far in terms of management responsibilities. In
a cost centre, a manager is responsible for the costs incurred, and therefore needs
information about those costs.
There is a slightly different way of looking at the nature of a cost centre.
A cost centre is a department, group of machines or activity that incurs costs.
The cost centre produces cost units.
Costs can therefore be traced to cost centres, and costs can be calculated for the
units of output or activity of that cost centre.

Paper F2: Management Accounting
40 Go to www.emilewoolfpublishing.com for Q/As, Notes & Study Guides © EWP
Example
A group of machines produces units of Product X. During one month, the costs of
operating the machines were $36,000. There are 4 machines which were each
operated for 150 hours in the month. The machines produced 20,000 units of Product
X.
The group of machines might be treated as a cost centre, and the costs of the cost
centre in the month were $36,000.
The cost per unit of Product X produced by the cost centre was $1.80.
We can also calculate the cost per machine hour, which is $60 (= $36,000/(4 × 150)).
Both units of Product X and machine hours worked can therefore be costed as cost
units: one is a unit of output and the other is a unit of activity.
Cost centres: direct and indirect costs
Direct costs of a cost centre are costs that are attributable directly to the activity of
the cost centre. Direct costs of a cost centre might be indirect costs of the units
produced by the cost centre.
Example
The wages of a maintenance and repairs engineer might be a direct cost of the
department in which he works. However, his wages are an indirect cost of each
individual cost unit produced by the department. This is because the job of the
engineer is to fix machines and other equipment when they break down, and he is
not involved directly in producing the output of the department.
Practice multiple choice questions
1 The cost of a quality inspection checker in a factory is an indirect labour cost of
items produced.
Is this statement TRUE or FALSE?
(1 mark)
2 Which one of the following would be classified as indirect labour?
A Paint sprayers in a car production plant
B Accountants in an audit firm
C Workers in the stores department of a brick manufacturing company
D Roofing workers in a building construction company.
(2 marks)
3 A publishing company produces books. Which of the following is a direct material
cost of production?
A printing costs charged by an external printer
B a writing fee paid to the author
C the cost of copy editing
D cost of copies distributed to book reviewers.
(2 marks)
© EWP Go to www.emilewoolfpublishing.com for Q/As, Notes & Study Guides 41
Paper F2
Management Accounting
CHAPTER
3
Cost behaviour and
cost estimation
Contents
1 Fixedandvariablecosts
2 Othercostbehaviourpatterns
3 Costestimation:high/lowanalysis

Paper F2: Management Accounting
42 Go to www.emilewoolfpublishing.com for Q/As, Notes & Study Guides © EWP
Fixed and variable costs
Cost behaviour: meaning
Variable costs
Fixed costs
Mixed costs
1 Fixed and variable costs
1.1 Cost behaviour: meaning
Cost behaviour refers to the way in which costs change as the volume of activity
changes. The volume of activity may be:
the volume of sales
the volume of production
total labour hours worked, machine hours worked
the number of production units inspected,
the number of journeys (for buses or trains) or deliveries, and so on.
As a general rule, total costs should be expected to increase as the volume of activity
rises.
Management might want information about estimated costs, or about what costs
should have been. An understanding of cost behaviour is necessary in order to:
forecast or plan what costs ought to be, and
compare actual costs that were incurred with what the costs should have been.
The classifications of cost that were described in the previous chapter (functional
costs and direct and indirect costs) are used to record and measure costs, and to
report profits. However, these classifications of cost do not provide an analysis of
how total costs change as more items are produced and sold, or as activity levels
increase or fall.
The most important classification of costs for the purpose of cost estimation is the
division of costs into fixed costs or variable costs.
1.2 Variable costs
Variable costs are costs that increase, usually by the same amount, for each
additional unit of product that is made or each additional unit of service that is
provided.
The variable cost of a cost unit is also called the marginal cost of the unit.

Chapter 3: Cost behaviour and cost estimation
© EWP Go to www.emilewoolfpublishing.com for Q/As, Notes & Study Guides 43
The variable cost per unit is often the same amount for each additional unit of
output or unit of activity. This means that total variable costs increase in direct
proportion to the total volume of output or activity. Here are some examples of
variable cost items.
The cost of buying a raw material item might be $5 per litre purchased,
regardless of purchase quantity. If so, the variable cost is $5 per litre: the total
cost of buying 1,000 litres would be $5,000 and the cost of buying 2,000 litres
would be $10,000.
The rate of pay for hourly-paid workers might be $15 per hour. If so, 400 hours
of labour would cost $6,000 and 500 hours would cost $7,500.
The time needed to produce an item of product is 4 minutes and labour is paid
$15 per hour. If so, direct labour is a variable cost and the direct labour cost per
unit produced is $1 (= $15 × 4/60).
The cost of telephone calls might be $0.10 per minute. If so, the cost of telephone
calls lasting 6,000 minutes in total would be $600.
1.3 Fixed costs
Fixed costs are items of cost that remain the same in total during a time period, no
matter how many units are produced, and regardless of the volume or scale of
activity. Fixed costs are also called period costs, because they are fixed for a given
period of time. Total fixed costs therefore increase with time.
Here are some examples of fixed cost items.
The rental cost of a building, which is $40,000 per month. The rental cost is fixed
for a given period: $40,000 per month, or $480,000 per year.
The salary costs of a worker who is paid $11,000 per month. The fixed cost is
$11,000 per month or $132,000 per year.
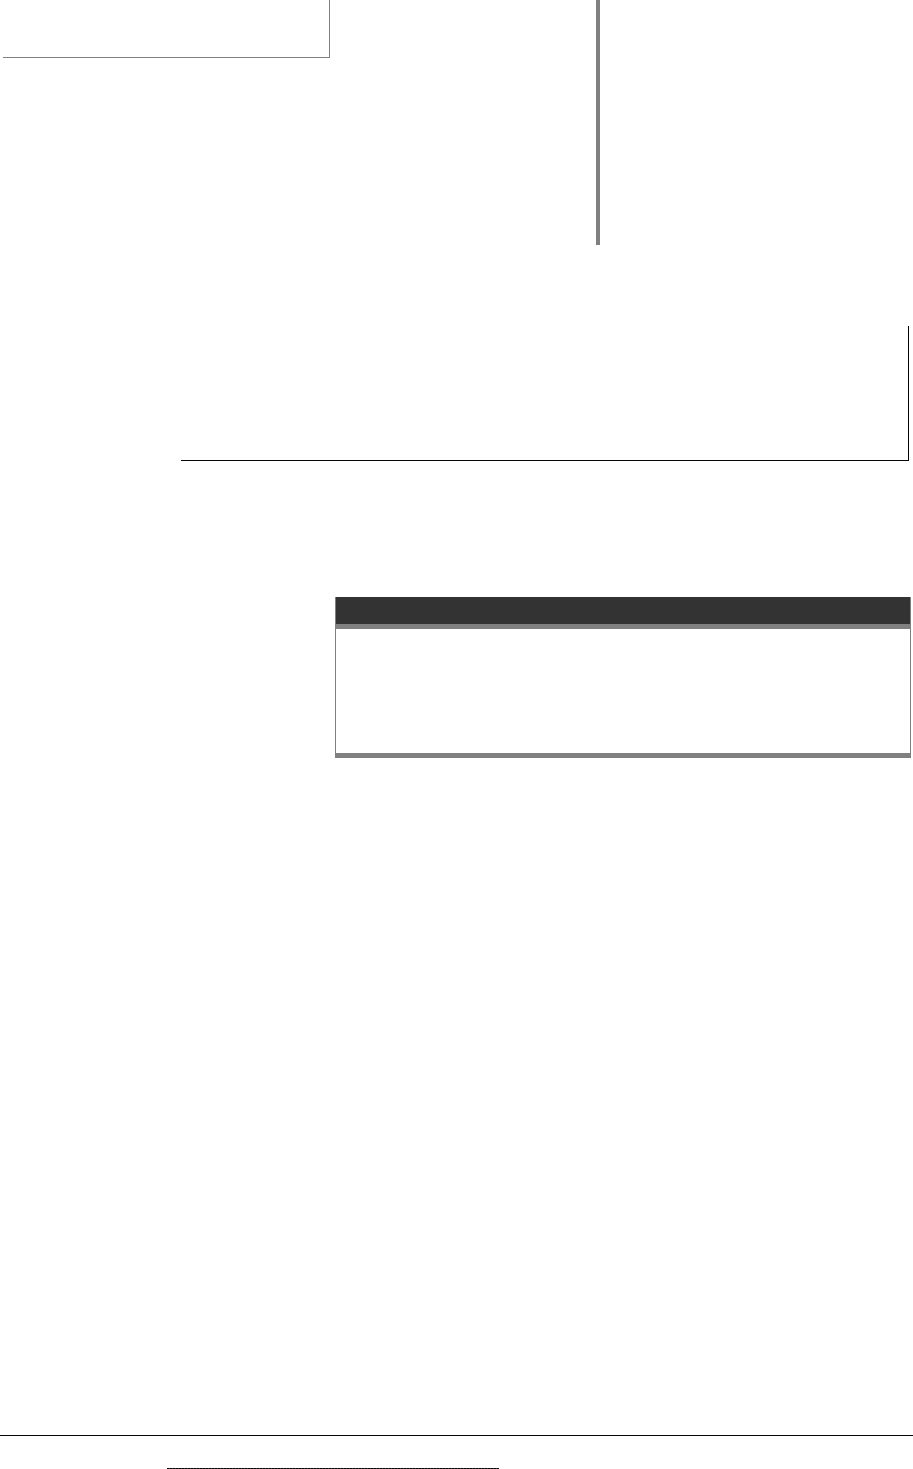
Cost behaviour graphs: fixed and variable costs
Cost behaviour for items of cost (or for costs in total) can be shown in a graph.
Graphs can be drawn for the total cost of an item or for the cost per unit of the item.
Cost behaviour graphs for fixed costs and variable costs are shown in the following
diagram.
Paper F2: Management Accounting
44 Go to www.emilewoolfpublishing.com for Q/As, Notes & Study Guides © EWP
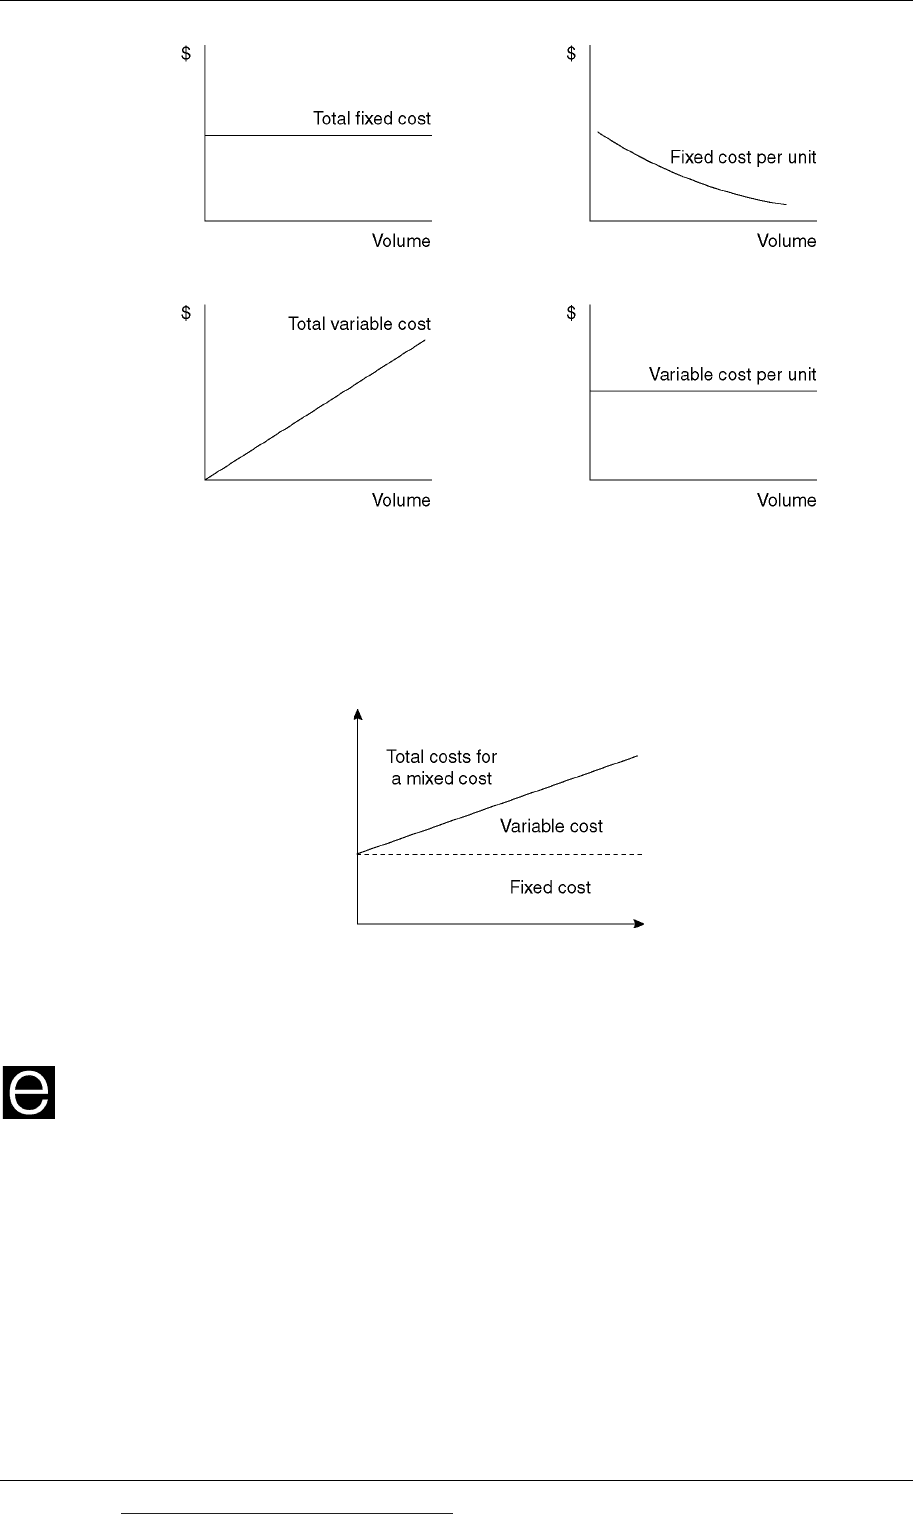
1.4 Mixed costs
A mixed cost, also called a semi-fixed cost or a semi-variable cost, is a cost that is
partly fixed and partly variable. A cost behaviour graph showing the total costs for
an item of mixed cost is shown below.
An item of cost that is a mixed cost is an item with a fixed minimum cost per period
plus a variable cost for every unit of activity or output.
Example
A company uses a photocopier machine under a rental agreement. The photocopier
rental cost is $400 per month plus $0.02 per copy produced.
For example, if the company makes 15,000 copies during a month, the total cost will
b
e $400 fixed costs plus $300 variable costs (= 15,000 × $0.02), making a total cost of
$700.
Mixed costs are important in cost and management accounting. It is often assumed
that the total costs of an activity are mixed costs, consisting partly of fixed costs and
partly of variable costs.