ACCA F2 Management Accounting - 2010 - Study text - Emile Woolf Publishing
Подождите немного. Документ загружается.


Chapter 4: Business mathematics and computer spreadsheets
© EWP Go to www.emilewoolfpublishing.com for Q/As, Notes & Study Guides 75
If you plot a graph of the data relating to two variables, you should be able to see if
any visible relationship exists between them (such a graph is known as a
scattergraph or scatterchart). If a visible relationship is seen to exist, the data on the
graph can be plotted to show the ‘line of best fit’. The ‘line of best fit’ is of the form
y = a + bx (linear cost function) and indicates that a ‘possible’ linear relationship
exists between two variables.
3.2 Degrees of correlation
The following scattergraphs show the different degrees of correlation that may be
seen to exist between two variables.
Perfect positive correlation
y
x
x
x
x
x
x
x
x
Perfect correlation is seen to exist when all the data points plotted lie in an exact
straight line and a linear relationship exists between the two variables.
Perfect positive correlation means that high values of are variable are associated
with high values of another variable. Alternatively, low values of one variable may
be associated with low values of another variable.
Perfect negative correlation
y
x
x
x
x
x
x
x
x

Paper F2: Management accounting
76 Go to www.emilewoolfpublishing.com for Q/As, Notes & Study Guides © EWP
Perfect negative correlation is seen to exist when all the data points plotted lie in an
exact straight line and that high values of one variable are associated with low
values of another variable. Alternatively, low values of one variable may be
associated with high value of another variable.
y
x
x
x
x
x
x
x
x
x
No correlation (uncorrelated)
‘Uncorrelated’ means that no correlation is seen to exist between the variables.
Positive correlation (but not perfect correlation)
y
x
x
x
x
x
x
x
x
x
Positive correlation means that there appears to be some correlation between the
values of y and x, and in general the value of y increases as the value of x increases.
However, the correlation is not perfect because all the data does not lie exactly on a
straight line on the scattergraph.

Chapter 4: Business mathematics and computer spreadsheets
© EWP Go to www.emilewoolfpublishing.com for Q/As, Notes & Study Guides 77
Negative correlation
y
x
x
x
x
x
x
x
x
Negative correlation means that a relationship exists between two variables, and the
value of y declines as the value of x increases. However, the correlation is not
perfect.
As an alternative to drawing a scattergraph to see whether a visible relationship
exists between the two variables x and y, the correlation between them can be
measured by calculating a
correlation coefficient.
3.3 Correlation coefficient r
An advantage of using the regression analysis method is that the reliability of the
estimates can be assessed statistically, by calculating a correlation coefficient.
The formula for the correlation coefficient (r) will be given to you in the
examination.
r =
n
∑
xy –
∑
x
∑
y
n∑x
2
– ∑ x
()
2
()
n ∑y
2
– ∑ y
()
2
()
This formula might seem difficult, but it is fairly similar to the formula for
calculating ‘b’ in the linear cost equation. The only additional value that we need to
calculate the correlation coefficient is a value for [n∑y
2
– (∑y)
2
].
If you look back at the previous example, you will see that the value for ∑y
2
has
already been calculated. In the example, there is a separate column for y
2.
Calculate the square of each value of y in the y column and enter it in the same
row in the y
2.
column
.
Then add up all the values of y
2
in the y
2
column to get
∑y
2.
(∑y)
2
is a different value. It is the square of the value for ∑y.
The value of the correlation coefficient, r, in the example in paragraph 2.3 is
therefore calculated as follows. Remember that most of the values for the formula
have been calculated in paragraph 2.3 as parts of the formula for calculating the
value of b.

Paper F2: Management accounting
78 Go to www.emilewoolfpublishing.com for Q/As, Notes & Study Guides © EWP
r =
249
(41) [6(136,185) – (903)
2
]
=
249
(41) (1,701)
=
249
264
= +0.94
The correlation coefficient is + 0.94.
Significance of the correlation coefficient
The value of the correlation coefficient must always be in the range – 1 to + 1.
A value of – 1 indicates that there is perfect negative correlation between the
values for y and the values for x that have been used in the regression analysis
estimates. Perfect negative correlation means that all the values for x and y,
plotted on a graph, would lie on a straight downward-sloping line.
A value of + 1 indicates that there is perfect positive correlation between the
values for y and the values for x that have been used in the regression analysis
estimates. Perfect positive correlation means that all the values for x and y,
plotted on a graph, would lie on a straight upward-sloping line.
A value of r = 0 indicates no correlation at all between the values of x and y.
For cost estimation, a value for r close to + 1 would indicate that the cost estimates
are likely to be very reliable.
As a general guide, a value for r between + 0.90 and + 1 indicates good correlation
between the values of x and y, suggesting that the formula for costs can be used
with reasonable confidence for cost estimation.
If you calculate a value for r that is more than +1 or is a greater negative value than
– 1, your calculation will be wrong.
3.4 Coefficient of determination r
2
The square of the correlation coefficient, r
2
, is called the coefficient of determination.
The value of r
2
shows how much the variations in the value of y, in the data used to
calculate the regression analysis formula, can be explained by variations in the value
of x.
Significance of coefficient of determination
The value of the coefficient of determination must always be in the range 0 to +1.
If the value of r is + 0.70, this means that on the basis of the data used in the
regression analysis formula, 0.49 or 49% (= 0.70
2
) of variations in the value of y
can be explained by variations in the value of x.
Similarly if the value of r is – 0.80, this means that on the basis of the data used
in the regression analysis formula, 0.64 or 64% (= 0.80
2
) of variations in the value
of y can be explained by variations in the value of x. Since r is negative, this
means that y falls in value as the value of x increases.
In the example above, where r = + 0.94, we can say that from the data used to
produce a formula for total costs, 88.36% (0.94 × 0.94 = 0.8836) of the variations in

Chapter 4: Business mathematics and computer spreadsheets
© EWP Go to www.emilewoolfpublishing.com for Q/As, Notes & Study Guides 79
total cost can be explained by variations in the volume of output. This would
suggest that the formula obtained for total costs is likely to be fairly reliable for
estimating future costs for any given (budgeted) volume of production.
The coefficient of correlation and the coefficient of determination can therefore be
used to give a statistical measurement to the reliability of estimates of y from a
given value for x, using a line of best fit that has been calculated by linear regression
analysis. As you might imagine, this can be a very useful item of management
information for the purpose of forecasting or planning.

Paper F2: Management accounting
80 Go to www.emilewoolfpublishing.com for Q/As, Notes & Study Guides © EWP
Spreadsheet models
Features of a spreadsheet
Using spreadsheets
Applications of spreadsheets in cost and management accounting
‘What if’ analysis: sensitivity analysis
4 Spreadsheet models
4.1 Features of a spreadsheet
Spreadsheets are used extensively in management accounting, because they enable
accountants to make long and detailed calculations very quickly.
A spreadsheet program is a type of computer software. A spreadsheet is a table of
rows and columns. Like any table, the rows and columns can contain words, figures
or other symbols. A spreadsheet program is used to create spreadsheets.
A spreadsheet created by a spreadsheet program enables the user to prepare one or
more tables of figures. Any table of figures, no matter how complex, can be
prepared in a spreadsheet.
A blank spreadsheet is simply a huge table of rows and columns, with each row and
having a unique identity number and each column having a unique letter code (A,
B, C …AA, AB, etc). The table therefore consists of boxes or cells, and each cell can
be identified by a unique combination of column letters and row number, such as
B5, T28, AA4 and so on.
A description of the features of a spreadsheet system is given in an Appendix at the
end of this text. If you are not familiar with spreadsheets, you should read the
Appendix before continuing to read this chapter.
4.2 Using spreadsheets
A blank spreadsheet can be used to create a table of figures by entering words,
figures and formulae. Figures are entered in the appropriate cells if their values are
known. Otherwise a formula can be entered into a cell, and the spreadsheet model
will convert the formula into a numerical value. The use of formulae in spreadsheets
is the reason why they can be used to produce tables of figures so quickly. Formulae
avoid the need to make calculations ‘by hand’ with a calculator.
Example
The example below is a very simple illustration of how spreadsheets are used to
construct accounting calculations.

Chapter 4: Business mathematics and computer spreadsheets
© EWP Go to www.emilewoolfpublishing.com for Q/As, Notes & Study Guides 81
All text in this column
Entered in the
spreadsheet file as text of
formulae
Shown in the spreadsheet
on screen or printout
Column F G
G
Row
6
Year Sales Sales
7 $
$
8 1 100,000
100,000
9 2 =G8*1.05
105,000
10 3 =G9*1.05
110,250
11 Total sales Years 1 -
3
=G8+G9+G10
315,250
12 Average annual sales
=G11/3
105,083
Column G is shown twice here. The left hand column for G shows the data as it has
been entered into the spreadsheet as formulae. The left hand column for G shows
the data that is displayed on the screen and in printouts.
The figures in the spreadsheet can be changed quickly simply by amending some of
the data in the cells. For example, if the accountant wants to change the figures so
that sales in Year 1 are $110,000 and annual sales growth in Years 2 and 3 is 4%, he
can do this by amending the number in cell G8 to 110,000 and amending cells G9
and G10 to change 1.05 to 1.04.
Example
Here is another example of a simple accounting calculation entered as text,
numbers and formulae in a spreadsheet.
Column C D
E F
Row
1
st
6 months 2
n
d
6 months Year
4 Output (units) 10,000
15,000 = D4+E4
5
$
$ $
6 Variable costs =D4*F11
=E*F11 =D6+E6
7 Fixed costs 40,000
=D7 =D7+E7
8 Total costs =D6+D7
=E6+E7 =D8+E8
9
10 Average cost/unit =D8/D4
=E8/E4 =F8/F4
11 Variable cost/unit
3.00
This would appear on screen as follows:
Column C D
E F
Row
1
st
6 months 2
n
d
6 months Year
4 Output (units) 10,000
15,000 25,000
5
$
$ $
6 Variable costs 30,000
45,000 75,000
7 Fixed costs 40,000
40,000 80,000
8 Total costs 70,000
85,000 155,000
9
10 Average cost/unit 7.00
5.67 6.20
11 Variable cost/unit
3.00
The figures can be re-calculated using different figures for output in each half of the
year, or different figures for fixed costs or the unit variable costs. All that is required
is an alteration to the number in cells D4, E4, D7 or F11.

Paper F2: Management accounting
82 Go to www.emilewoolfpublishing.com for Q/As, Notes & Study Guides © EWP
4.3 Applications of spreadsheets in cost and management accounting
Spreadsheets can be used for many tasks in cost and management accounting,
where a large number of calculations are required. They are used to construct
mathematical ‘models’ and to carry out a large number of calculations quickly and
accurately.
Examples of applications of spreadsheets in management accounting include:
Preparing forecasts of sales, and forecasts of profit or loss
Cost estimation using linear regression analysis and the calculation of a
correlation coefficient and coefficient of determination
Preparing financial plans, such as budgets
Comparing actual results with a plan or budget (control reporting).
Each table or set of related tables in a spreadsheet is held in a single file and
accountants often carry a number of spreadsheet files on their lap top computer.
There are cost and management applications for which spreadsheets are not
suitable. These include any application involving the recording and filing of large
amounts of data. For these applications, involving the maintenance of records and
large files, other types of software are more suitable, such as:
A cost accounting software package for keeping cost accounting records (in a
double entry ‘book-keeping’ system)
An inventory control software package for maintaining records of inventory
A database for maintaining and accessing other large files of data.
Graphical reproduction of spreadsheet data
Spreadsheets can be printed out and included in management reports. It is very
common in practice to find tables of figures produced in a spreadsheet to be
included as appendices in management reports.
In addition, the figures in a spreadsheet can be converted by the spreadsheet
program into graphical display format, and shown as graphs, bar charts or pie
charts. This facility can also be very useful for the preparation of management
reports.
For example, if a spreadsheet is used for linear regression analysis, it can be used to
show the line of best fit as a graph. Similarly, if a spreadsheet is used to prepare an
estimate of costs, the percentage of total costs made up by different items of cost
(direct materials, direct labour, production overheads etc) can be shown as a pie
chart or a bar chart.
Chapter 4: Business mathematics and computer spreadsheets
© EWP Go to www.emilewoolfpublishing.com for Q/As, Notes & Study Guides 83
Applications of spreadsheets in management accounting include:
Making forecasts, such as sales forecasts
Preparing budgets and other financial plans
Preparing flexible budgets for comparing actual and expected costs
Preparing a complex income statement.
Some examples of spreadsheets are illustrated below. Don’t worry about the detail
in these examples. Cost-volume-profit analysis will be explained in a later chapter.
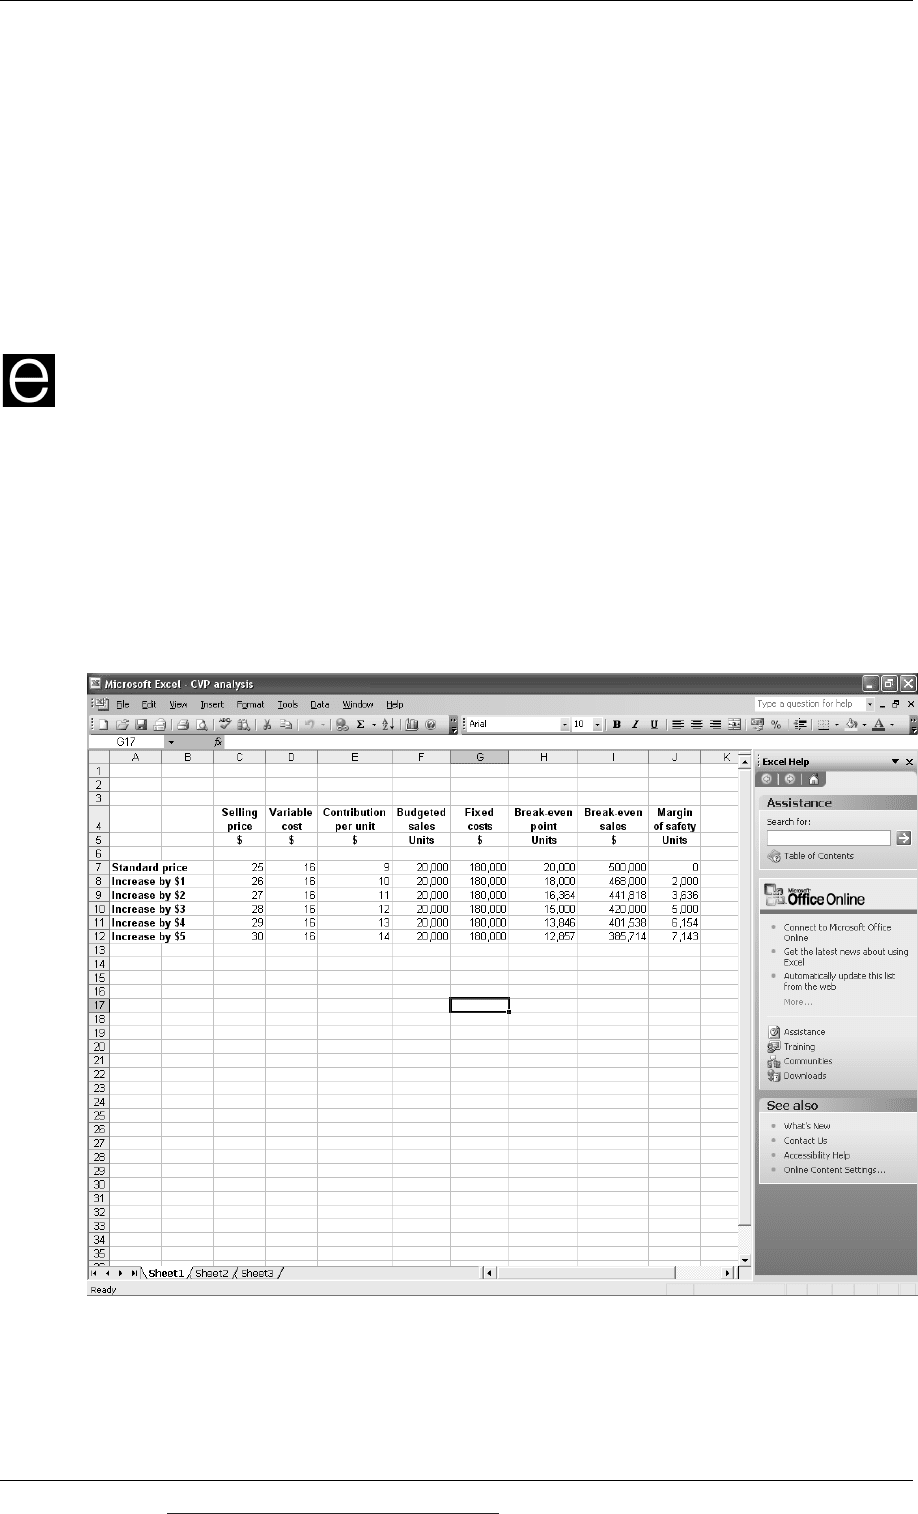
Example
Cost-volume-profit analysis is a technique in cost accounting that might be used to
prepare profit forecasts or to estimate what the profit might be at different selling
prices per unit or at different sales volumes. In this example, numbers might have
been entered in cells C7, D7, F7 and G7. All the other cells, except for the text cells,
will contain formulae.
The estimates for selling price, variable costs, budgeted sales units and fixed costs
can be amended simply by changing the numbers in C7, D7, F7 and G7. (However,
in this example, the text cells A8 – A12 might also need changing.
Paper F2: Management accounting
84 Go to www.emilewoolfpublishing.com for Q/As, Notes & Study Guides © EWP
Graphical reproduction of spreadsheet data
Spreadsheets can be printed out and included in management reports. It is very
common in practice to find tables of figures produced in a spreadsheet to be
included as appendices in management reports.
In addition, the figures in a spreadsheet can be converted by the spreadsheet
program into graphical display format, and shown as graphs, bar charts or pie
charts. This facility can also be very useful for the preparation of management
reports.
For example, if a spreadsheet is used for linear regression analysis, it can be used to
show the line of best fit as a graph. Similarly, if a spreadsheet is used to prepare an
estimate of costs, the percentage of total costs made up by different items of cost
(direct materials, direct labour, production overheads etc) can be shown as a pie
chart or a bar chart.
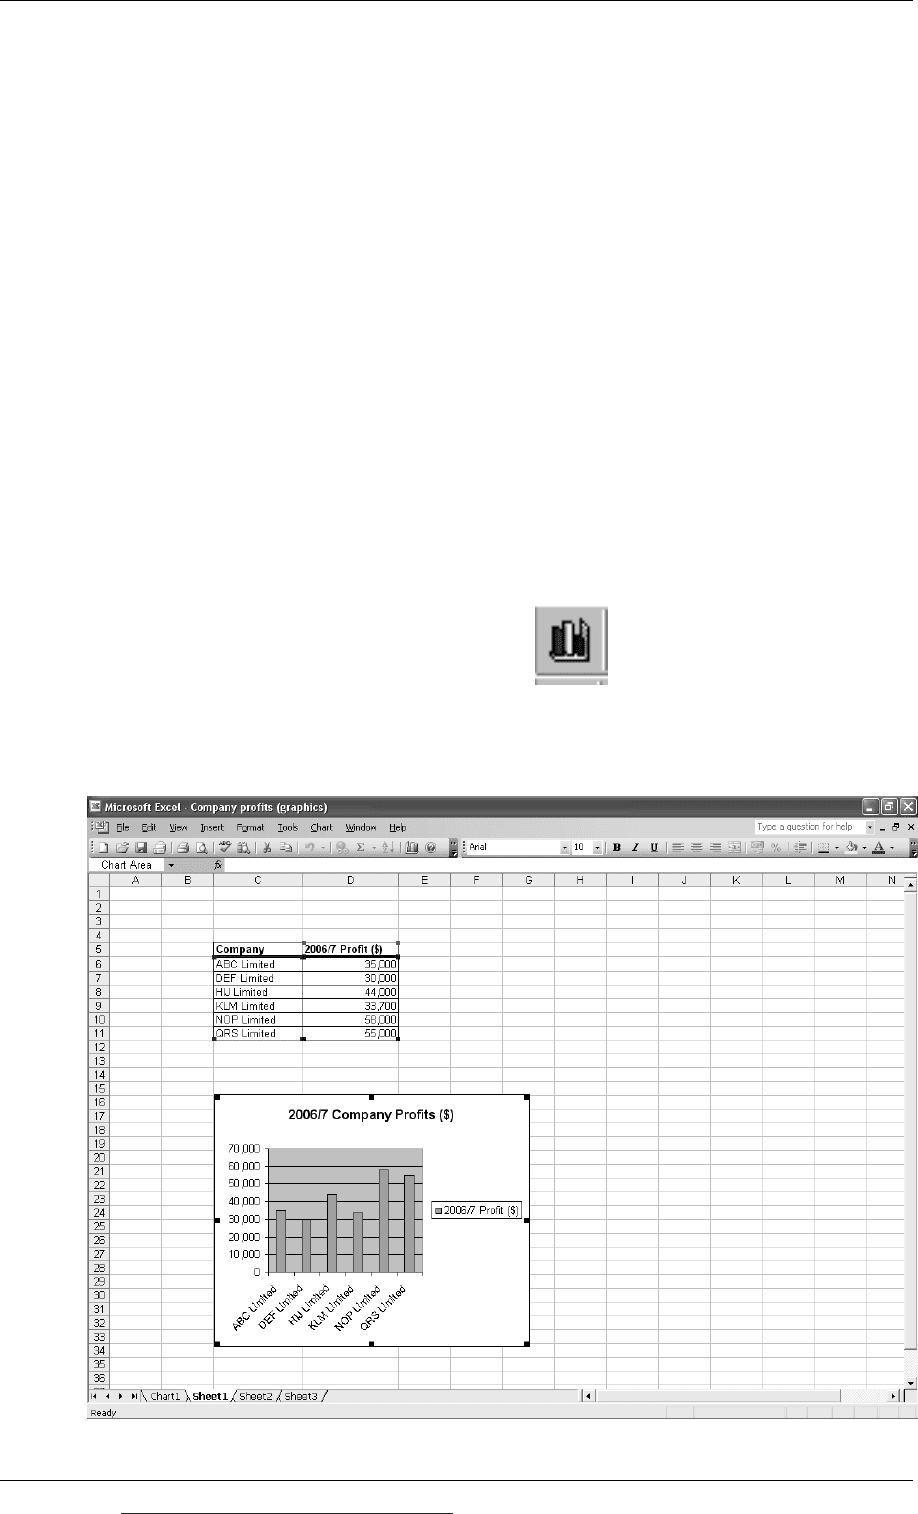
In the Microsoft Excel spreadsheet program, the facility to produce graphical
displays is provided by the Chart Wizard facility. A Chart Wizard icon is on the
menu bar and appears as follows:
The example below shows how the profits for six different companies can be shown
in the form of a graph using ‘Chart Wizard’.