AckermannTh. (ed) Wind Power in Power Systems
Подождите немного. Документ загружается.

//INTEGRAS/KCG/P AGIN ATION/ WILEY /WPS /FINALS_1 4-12- 04/0470855088_ 11_CHA10 .3D – 211 – [197–232/36]
20.12.2004 7:41PM
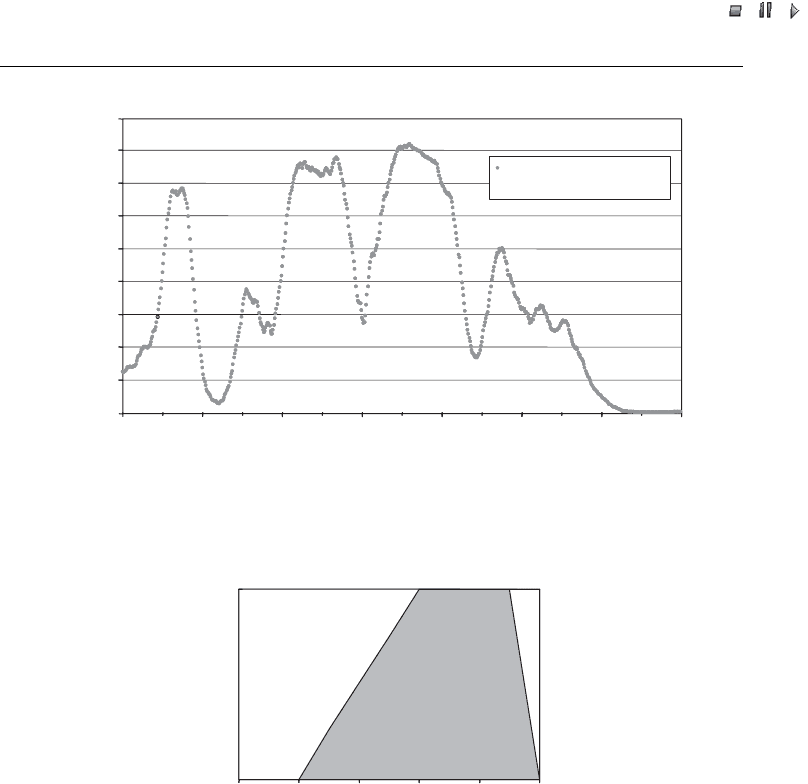
25 m/s the turbines stop and turn out of the wind. Production will be zero below 5 m/s
and abo ve 25 m/s.
The wind speed forecast is essential, since in the cu rrent Eltra system, a variation of
1 m/s in wind speed can result in a variation of up to 300 MW in wind production.
10.2.5 Balancing via Nord Pool: first step
Eltra is in charge of balancing the priority production (i.e. private wind production and
local CHP). El tra informs the demand side three months in advance about the hourly
percentage of priority production that the consumers have to purchase. The three-
month forecast has been chosen to enable market participants to act in the power
market. This principle is unique to Denmark. The principle question is: ‘who is in
0
200
400
600
800
1000
1200
1400
1600
1800
Wind production,
PANDA measurement
11 12 13 14 15 16 17 18
Wind production,
Panda measurement
Power (MW)
Date (December 2000)
Figure 10.6 Wind production in week 50 2000. Note: Panda is a data base for measured
15-minute energy values
0
100
010152025
Wind (m/s)
Electricity (%)
Wind power
production
5
Figure 10.7 Typical wind turbine output
Wind Power in Power Systems 211
//INTEGRAS/KCG/P AGIN ATION/ WILEY /WPS /FINALS_1 4-12- 04/0470855088_ 11_CHA10 .3D – 212 – [197–232/36]
20.12.2004 7:41PM
charge of balancing wind production’. Until now, the TSO has had to take on this
responsibility.
Using data on actual weather conditions, Eltra calculates an expected hourly value
for wind production and local CHP. The difference between the values of the three-
month forecast deducted from the load forecast and the latest forecast is then traded at
Nord Pool with a flat bid. Depending on whether the calculated difference is positive or
negative, Eltra acts as a seller at price zero or as a buyer at maximum market price.
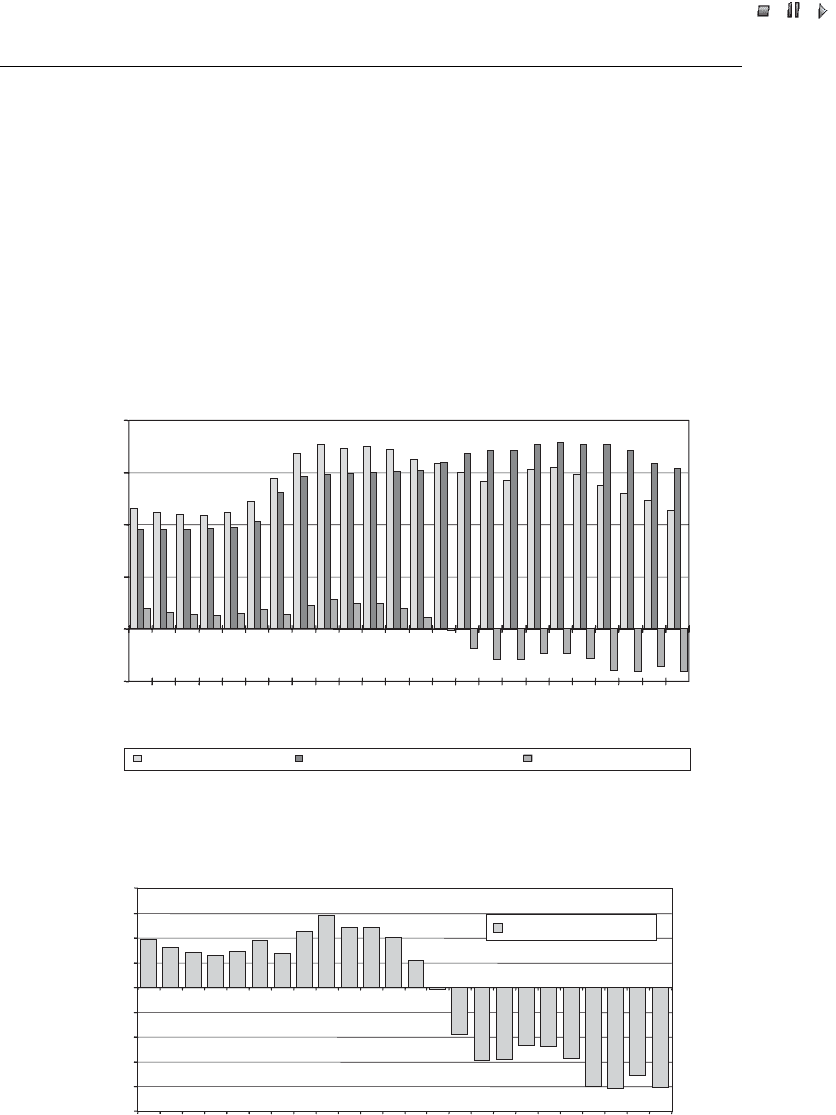
Figure 10.8 shows 24 hourly values for the three-month forecast and the forecast from
the morning of the day prior to the 24-hour operating period. Figure 10.9 illustrates the
difference between the two values that Eltra bids to Nord Pool.
–500
0
500
1000
1500
2000
Time (hours)
3-month forecast
159
13
Forecast on 23 March 2001
Trade via Nord Pool
21 23191715
3711
Production (MWh)
Figure 10.8 Priority production for 23 March 2001
–500
–400
–300
–200
–100
0
100
200
300
400
Time (hours)
Trade via Nord Pool
1 10111213141516171819202122232423456789
Demand and production (MWh)
Figure 10.9 Eltra’s bid to Nord Pool, 23 March 2001
212 The Danish Power System
//INTEGRAS/KCG/P AGIN ATION/ WILEY /WPS /FINALS_1 4-12- 04/0470855088_ 11_CHA10 .3D – 213 – [197–232/36]
20.12.2004 7:41PM
The operator in the TSO control room will often be aware that corrections of the
expected power production will be necessary because of changes in the weather forecast,
but once the bids are submitted to Nord Pool at 12:00 they are binding.
10.2.6 The accuracy of the forecasts
Our experience shows that the meteorological forecasts are inaccurate also in normal
situations, as can be seen from the following examples of ‘good’, ‘bad’ and ‘ugly’
forecasts from a TSO point of view.
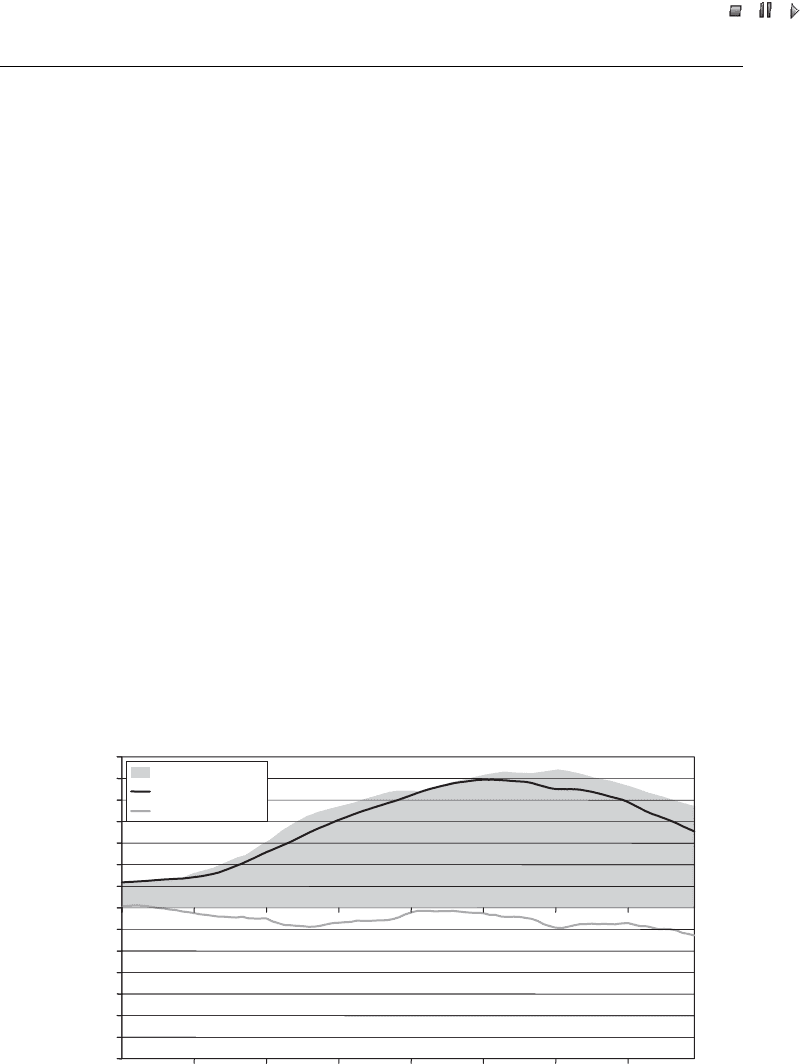
10.2.6.1 The good forecast
Figure 10.10 shows a forecast from the morning of the day prior to the 24-hour
operating period, the measured value and the difference. In this case, the forecasted
production is consistent with the actual production.
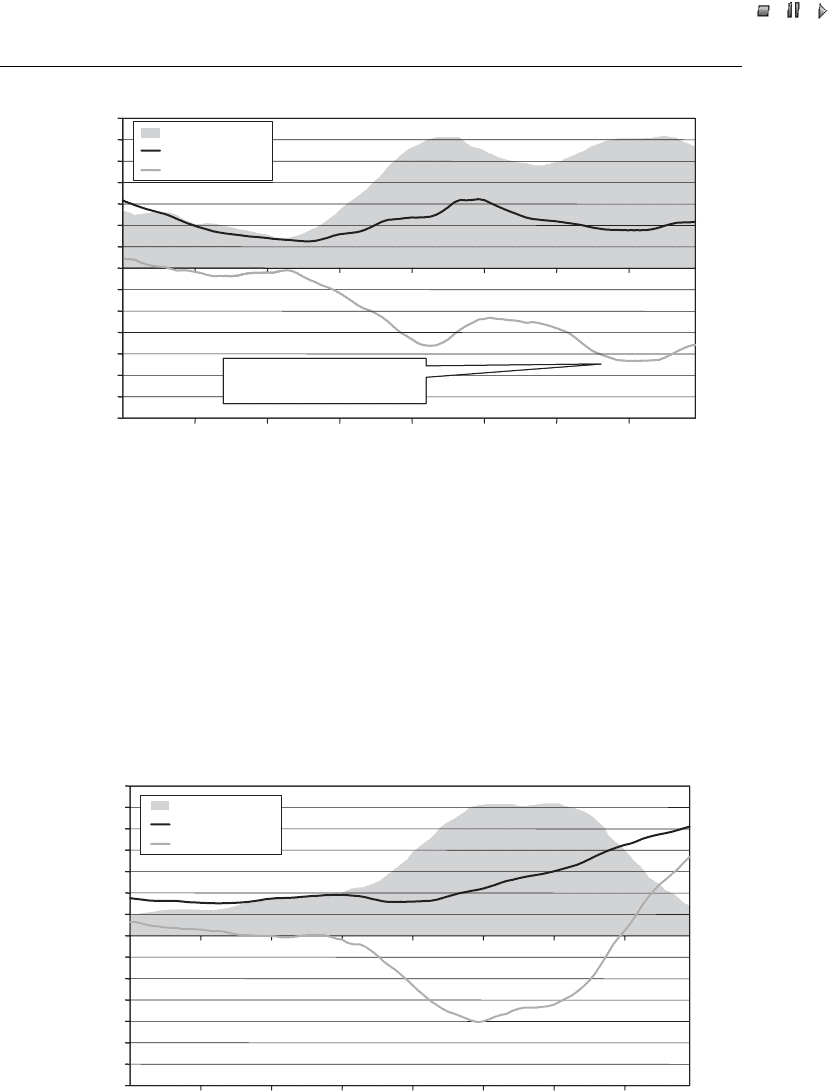
10.2.6.2 The bad forecast
Figure 10.11 is similar to Figure 10.10, but there is a difference of up to 900 MW, which
is equivalent to approximately a third of the total load. Owing to this difference, imports
from the real-time market were necessary in order to secure the balance. The cost of
import determines the prices of the imbalance.
–1400
–1200
–1000
–800
–600
–400
–200
200
400
600
800
1000
1200
1400
Measurement
Forecast
Deviation
0
Measurement
Forecast
Deviation
Time
Output (MW)
00:00
03:00
06:00
09:00
12:00
15:00
18:00
21:00
Figure 10.10 The good forecast: priority wind production; average quarter-hour power output
on 6 November 2000 and forecast calculated on 5 November at 11:00
Wind Power in Power Systems 213
//INTEGRAS/KCG/P AGIN ATION/ WILEY /WPS /FINALS_1 4-12- 04/0470855088_ 11_CHA10 .3D – 214 – [197–232/36]
20.12.2004 7:41PM
10.2.6.3 The ugly forecast
Figure 10.12 is similar to Figures 10.10 and 10.11, but there is a difference of up to
800 MW. However, the difference changes from a surplus to a deficit, as the wind front
is approaching faster than expected.
At this time of day the deviation
is equal to 1/3 of the total load
–1400
–1200
–1000
–800
–600
–400
–200
0
200
400
600
800
1000
1200
1400
Output (MW)
00:00
03:00
06:00
09:00
12:00
15:00
18:00
21:00
Measurement
Forecast
Deviation
Time
Figure 10.11 The bad forecast: priority wind production; average quarter-hour power output on
25 October 2000 and forecast calculated on 24 October at 11:00
–1400
–1200
–1000
–800
–600
–400
–200
0
200
400
600
800
1000
1200
1400
Output (MW)
00:00
03:00
06:00
09:00
12:00
15:00
18:00
21:00
Measurement
Forecast
Deviation
Time
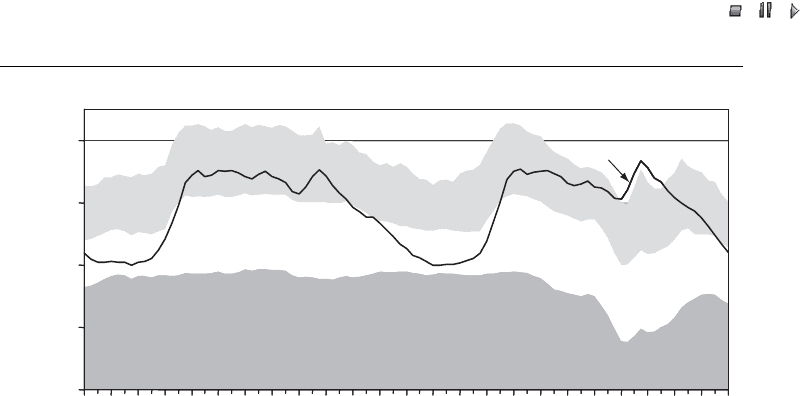
Figure 10.12 The ugly forecast: priority wind production; average quarter-hour power output on
11 December 2000 and forecast calculated on 10 December at 11:00
214 The Danish Power System
//INTEGRAS/KCG/P AGIN ATION/ WILEY /WPS /FINALS_1 4-12- 04/0470855088_ 11_CHA10 .3D – 215 – [197–232/36]
20.12.2004 7:41PM
The case is ugly because of the updated forecast at 10:00 hours of the 24-hour
operating period. Even the short-term forecast was not able to predict the power surge.
Such situations are difficult to handle for TSOs (see also Figure 10.13).
10.2.7 Network controller and instantaneous reserves
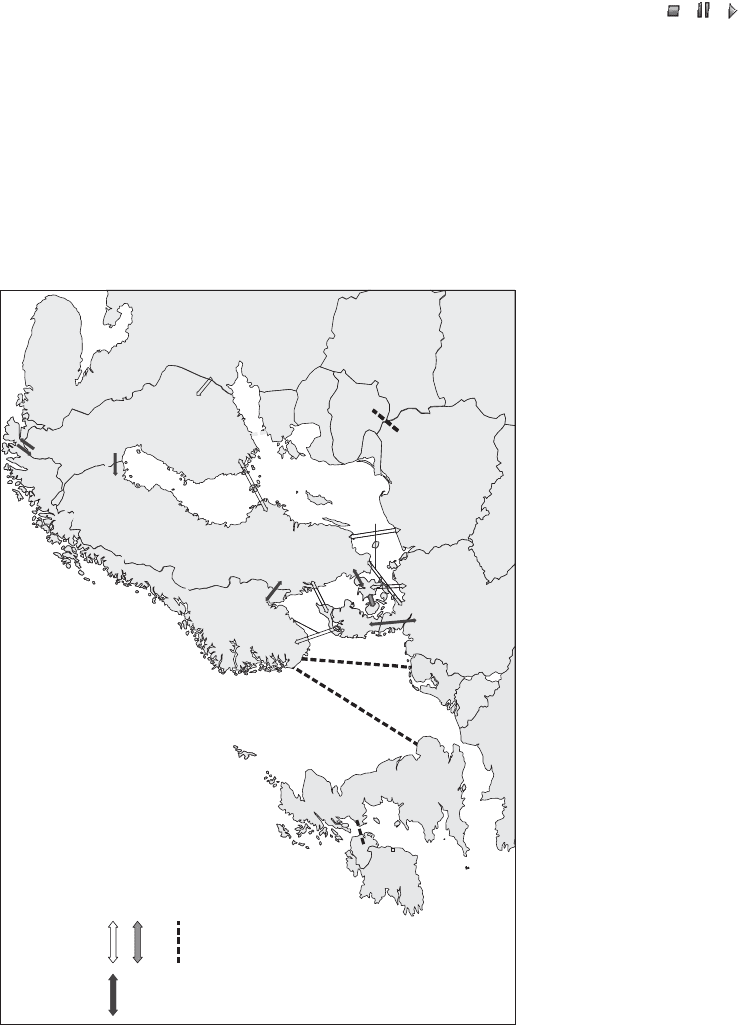
Eltra is located inbetween the synchronous Nordic system and the UCTE system. Since
Eltra has been operating synchronously within UCTE since the 1960s, all imbalances are
automatically placed on interconnections to the German system (see Figure 10.14).
To reduce unscheduled imbalances, Eltra has introduced automatic regulation of the
HVDC interconnections to Norway, with certain energy and power limits. This is a type
of network controller. This control action lies typically within the range of 50 MW and
is normally active. This function will cease to exist at the end of 2005. In addition to the
network controller, power plants in the area supply instantaneous reserves in accord-
ance with UCTE rules.
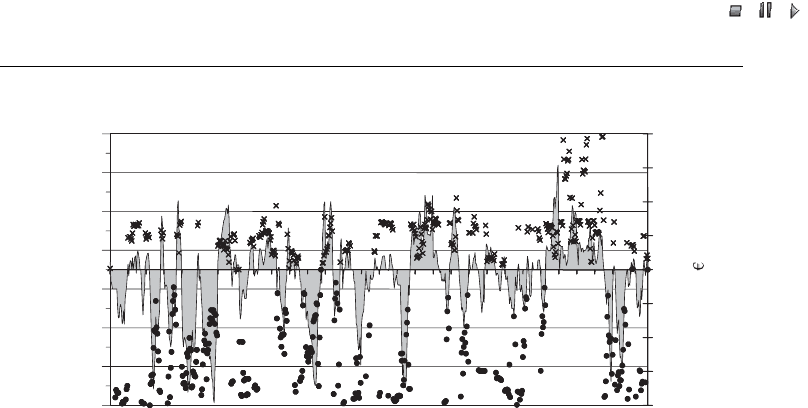
10.2.8 Balancing prices in the real-time market
Handling imbalances as shown in Figures 10.11 and 10.12 requires the involvement of
the real-time market. Eltra purchases regulating power of plus 300 MW and minus
300 MW. As shown, these amounts are not sufficient in all situations. Depending on
demand and prices, Eltra will activate regulating power from the Nordic real-time
market or from producers south of the Danish–German border. Regulating power
affects the pricing of the imbalances. Figure 10.15 shows a price pattern for one month.
We do not include any further description of the real-time market and settlement for
balancing power in this chapter. For detailed information on trade mechanisms, the
0
200
400
600
800
1000
1200
1400
00:00
03:00
06:00
09:00
12:00
15:00
18:00
21:00
Measurement
Forecast 11 December at 10:00
Forecast 10 December at 11:00
Time
Output (MW)
Figure 10.13 Why ugly? Priority wind production; average quarter-hour power output on 11
December 2000 and forecast calculated on 10 December at 11:00 and on 11 December at 10:00
Wind Power in Power Systems 215
//INTEGRAS/KCG/P AGIN ATION/ WILEY /WPS /FINALS_1 4-12- 04/0470855088_ 11_CHA10 .3D – 216 – [197–232/36]
20.12.2004 7:41PM
AC DC
70 MW
UPS
600 MW
1200 MW
200 MW
630 MW
500 MW
1200 MW
1800 MW
1300 MW
750 MW
250 MW
450 MW
125 MW
900 MW
700 MW
100 MW
1040 MW
600 MW
NORDEL
NG
UCTE
ESB
Decided or at the planning stage
Under discussion
Figure 10.14 Existing, decided and possible cooperative interconnections in Northern Europe
//INTEGRAS/KCG/P AGIN ATION/ WILEY /WPS /FINALS_1 4-12- 04/0470855088_ 11_CHA10 .3D – 217 – [197–232/36]
20.12.2004 7:41PM
regulating power market and the balance philosophy , see the Nordel homepage, at
http://www.nordel.org.
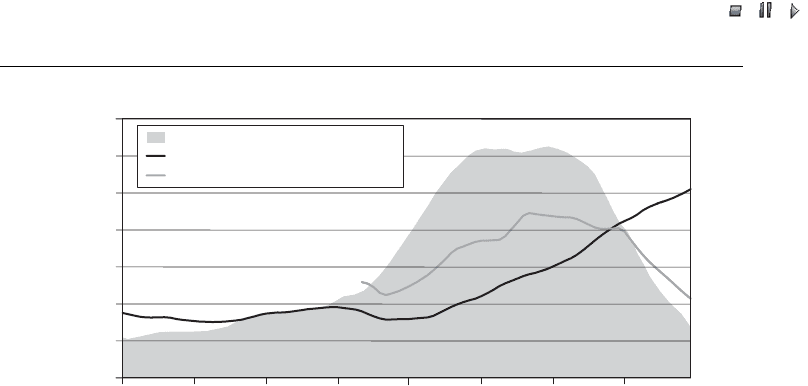
10.2.9 Market prices fluctuating with high wind production
Figure 10.16 illustrates how the market price fluctuates with high wind power produc-
tion during two days in January 2003. It is obvious that market prices can be zero during
several hours with high wind energy production and CHP production. The area price for
Western Denmark will be between the German price and the area prices in Norway and
Sweden.
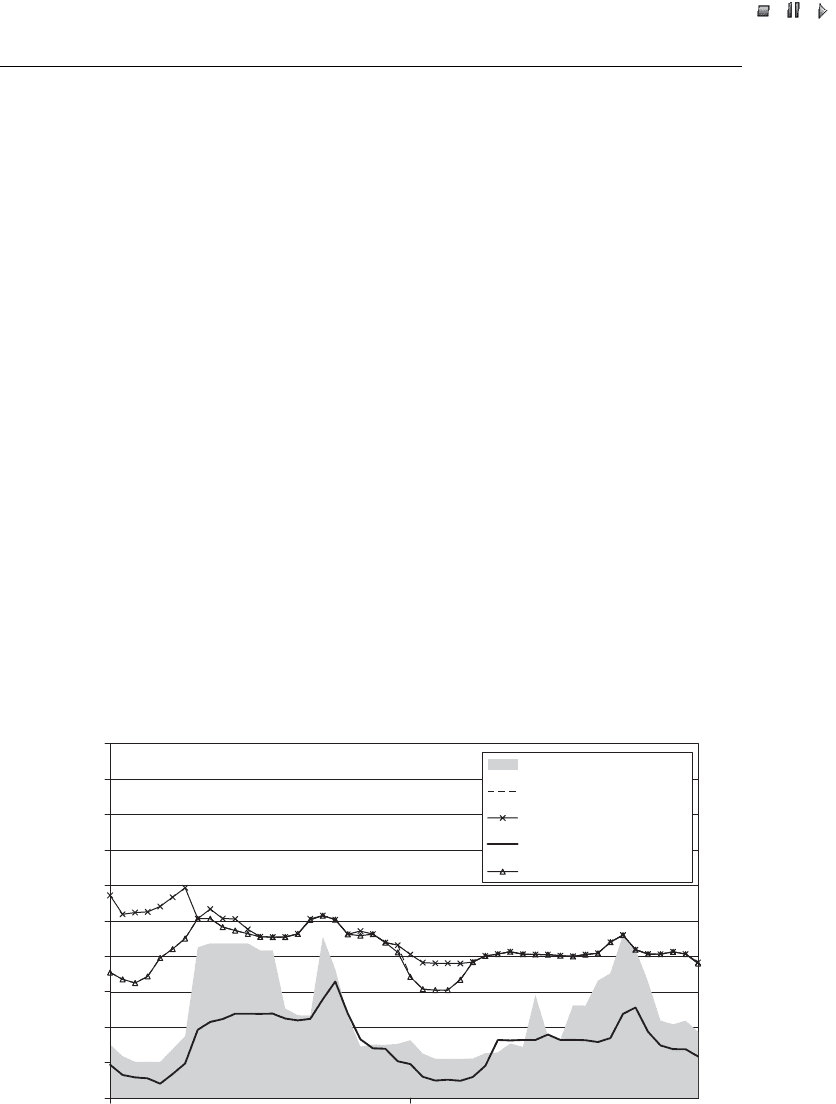
Figure 10.17 shows a typical day with high wind production and an energy surplus of
up to 1500 MWh/h.
10.2.10 Other operational problems
The shift from central production connected to the trans mission grid to a pattern of
dispersed production connected to the distribution grid influences ne arly all electro-
technical design features. The following is only a rough list:
.
Previously, load-shedding systems could be activated on 60 kV lines, but now they
have to be redesigned and installed in pure load radials (i.e. 10 kV lines).
.
Load-shedding signals can no longer rely on local frequency measurements but have
to be activated by a frequency signal from the transmission system.
–700
–500
–300
–100
100
300
500
700
01 04 07 10 13 16 19 22 25 28
–20
–15
–10
–5
0
5
10
15
20
Upward regulation
Downward regulation
Date (April 2001)
Price ( /MWh)
Power (MWh/h)
Figure 10.15 Regulating power and prices in the real-time market (April 2001) for the Eltra area.
Note: the grey areas are the amount of regulating power (MWh/h) for upward and downward
regulation; the and
.
indicate the prices of the upward and downward regulation, respectively,
calculated as additions to and deductions from the area price (right-hand ordinate axis)
Wind Power in Power Systems 217
//INTEGRAS/KCG/P AGIN ATION/ WILEY /WPS /FINALS_1 4-12- 04/0470855088_ 11_CHA10 .3D – 218 – [197–232/36]
20.12.2004 7:41PM
.
An effective real-time market is a prerequisite for handling large amounts of renew-
able production, hence an extended real-time market must be established.
.
Local CHP units must be able to contribute to the real-time market using the heat
storage capacity for stopping and starting up.
.
Local CHP units have to be equipped with additional air coolers to be able to produce
even without the normal heat load.
.
Local CHP units have to be able to stop and use surplus electricity in electrical
heaters.
.
Rules for using natural gas must be flexible to allow gas-fired installations to change
consumption at short notice (in minut es). The natural storage capacity in the gas
transmission system will be used.
.
Technical rules for new generators must be rewritten to comply with the new operat-
ing conditions in a dispersed production system.
.
Black-start conditions for generators and system restoring must be redesigned.
.
Reactive power capabilities and balance rules must be redesigned and coordinated
with a new general philosophy for reactive balances and voltage control.
.
New control concepts must be defined.
.
Supervisory control and data acquisition (SCADA) system designs will be changed.
.
Load flow tools must have new load and generator models.
.
Measurement and estimation of load and generation are key questions.
.
Voltage stability must be checked.
.
Short-circuit capacity will be reduced.
.
Voltage quality wi ll be reduced.
.
Working capability of HVDC installations will be reduced for import (gamma angle =
the security angle for inverter operation).
0
100
200
300
400
500
600
700
800
900
1000
15 16
Denmark West
Sweden
Norway–Kristiansand
EEX-area E.ON
Denmark East
Date (January 2003)
Price (DKr/MWh)
Figure 10.16 Example of market prices, 15–16 January 2003
218 The Danish Power System
//INTEGRAS/KCG/P AGIN ATION/ WILEY /WPS /FINALS_1 4-12- 04/0470855088_ 11_CHA10 .3D – 219 – [197–232/36]
20.12.2004 7:41PM
We have not yet seen the full consequences of completely dispersed production when
each household installation includes microgeneration based on photovoltaics and fuel
cells.
10.3 System Analysis and Modelling Issues
As the transmission system operator, Eltra is responsible for the overall security of
supply as well as for the efficient utilisation of the power system. The security of supply
involves adequacy of power and energy as well as system security. In addition, Eltra has
to see to it that the power market works smoothly.
In order to comply with its tasks as TSO, Eltra has to be able to understand and
analyse in detail the physics and technologies of the existing and future power system.
Eltra must also be able to analyse the market mechanisms. For that purpose, the
application of dedicated mathematical model tools and reliable data are indispensable
prerequisites.
10.3.1 Future development of wind power
The expansion plans involving new land-based wind turbines have practically all been
stopped because of a general reduction of economic subsidies.
In 2002, the 160 MW Horns Rev offshore wind farm (80 2 MW) was commissioned,
featuring an AC cable connection to the 150 kV transmission system in the Eltra area.
A similar 150 MW offs hore wind farm is scheduled for commissioning at Rødsand off
Nysted in Eastern Denmark in 2003. Additional future offshore wind farms are under
discussion.
0
1000
2000
3000
4000
15 16 17
Consumption
Wind power
Local CHP
Primary CHP
Date (January 2003)
Power (MW)
Figure 10.17 High wind power production, local and primary combined heat and power (CHP)
and consumption, January 2003
Wind Power in Power Systems 219
//INTEGRAS/KCG/P AGIN ATION/ WILEY /WPS /FINALS_1 4-12- 04/0470855088_ 11_CHA10 .3D – 220 – [197–232/36]
20.12.2004 7:41PM
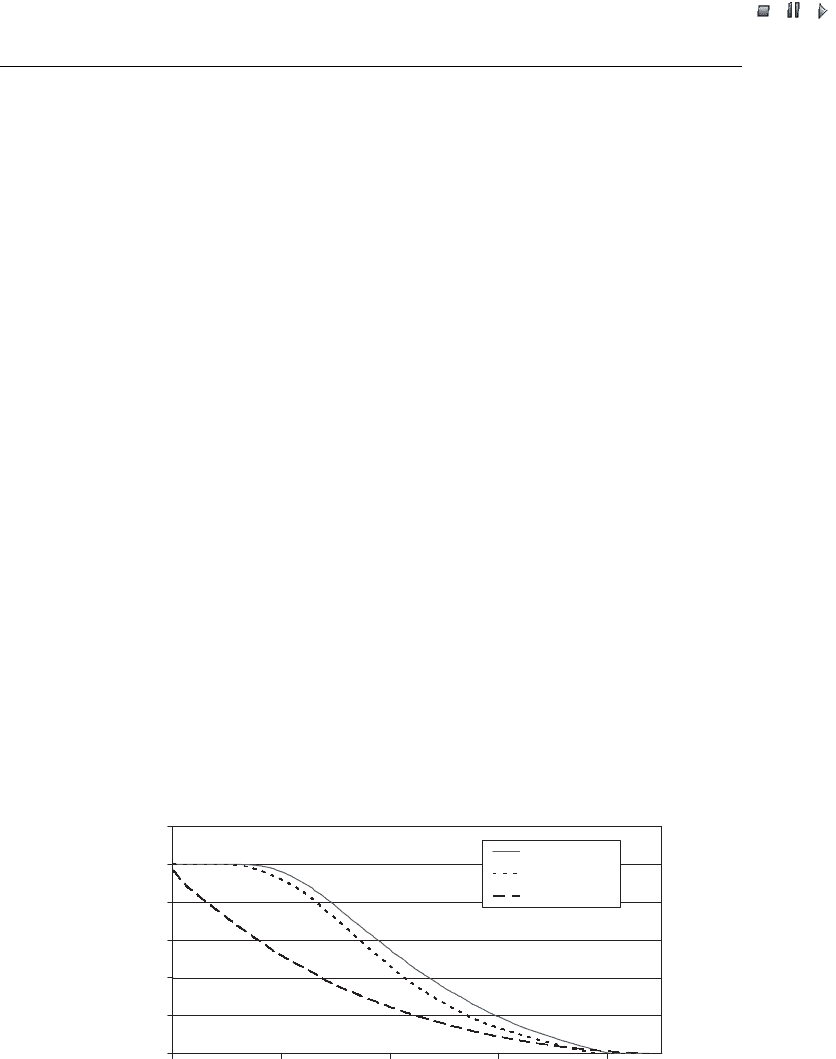
10.3.2 Wind regime
Figure 10.18 shows estimated duration curves for the wind power production at Horns
Rev in the North Sea and at Læsø in the Kattegat, based on site-specific measurements
of offshore wind conditions (from 15 May 1999 to 15 May 2000). The reference offshore
wind turbines are 2 MW turbines, where both rotor diameter and hub height are 80 m.
Figure 10.18 also shows the duration curve for wind power production at a windy
Danish land-based site (Thy) with a typical turbine layout. It follows that the capacity
utilisation factor is much larger offshore (0.45–0.50) than onshore (0.34).
Figure 10.19 illustrates the correlation between synchronous hourly wind power
production from wind farms in the Eltra area. As expected, the correlation factor
decreases with increased distance between production sites. In addition to this, the
correlation is in general higher between the production at two land-based sites than
between the generation at a land-based and an offshore site.
In addition, Figure 10.20 shows examples of correlation in time (autocorrelation) for
wind power production at Horns Rev and Læsø. The correlation curves are very similar
for the two sites; initially, the correlation declines relatively fast and, after about 15
hours, the correlation declines at a slower rate. The location of Horns Rev and Læsø is
shown in Figure 10.3.
Finally, Figure 10.21 shows the correlation between the production estimates for
Horns Rev and Læsø for varying time displacements. It can be seen that the most
significant correlation between the production of the two sites (Horns Rev, located
15 km into the North Sea northwest of Esbjerg, and the Læsø site, located south of Læsø
in the Kattegat, east of Jutland) is found by applying a ‘delay’ of approximately four
hours to the production estimates for Læsø, in comparison with Horns Rev. This is
consistent with the fact that weather fronts frequently pass Denmark from west to east.
0
20000
40000
60000
80000
100000
120000
0 2000 4000 6000 8000
Time (hours)
Production (kWh/h)
Horns Rev
Læsø
Thy (onshore)
Figure 10.18 Duration curves for estimated offshore and land-based wind power production,
based on measurements recorded over a 12-month period (from 15 May 1999 to 15 May 2000):
Horns Rev (100 MW, offshore), Læsø (100 MW, offshore), Thy (100 MW, onshore)
220 The Danish Power System