All?gre Claude J. Isotope Geology
Подождите немного. Документ загружается.

organic beam of any molecules and other impurities by passing them either through
th in sheets of gold or through gas streams. The carbon ions pass through these whi le
any molecules are‘‘d eactivated’’andstopped.Inthiswaythe method’s speedofanalys is,sen-
sitivity, and precision have been increased compared with counting. A measurement that
oncetookmorethanaweekcan nowbe made in an hour. But aboveall, the method requires
samples of one-tenth of th e size and achi eves levels of precision 100 times greater (see
Figure4. 7).
Exercise
If the maximum that can be measured by AMS for the
14
C/
12
C ratio in 1 mg of carbon is 1.2
10
17
, what is the maximum age that can be measured with
14
C?
Answer
10 000 years.
Exercise
If the limit of detection by counting methods is 10 disintegrations per hour, what quantity of
carbon is required to measure the same age?
Answer
2.213 kg!
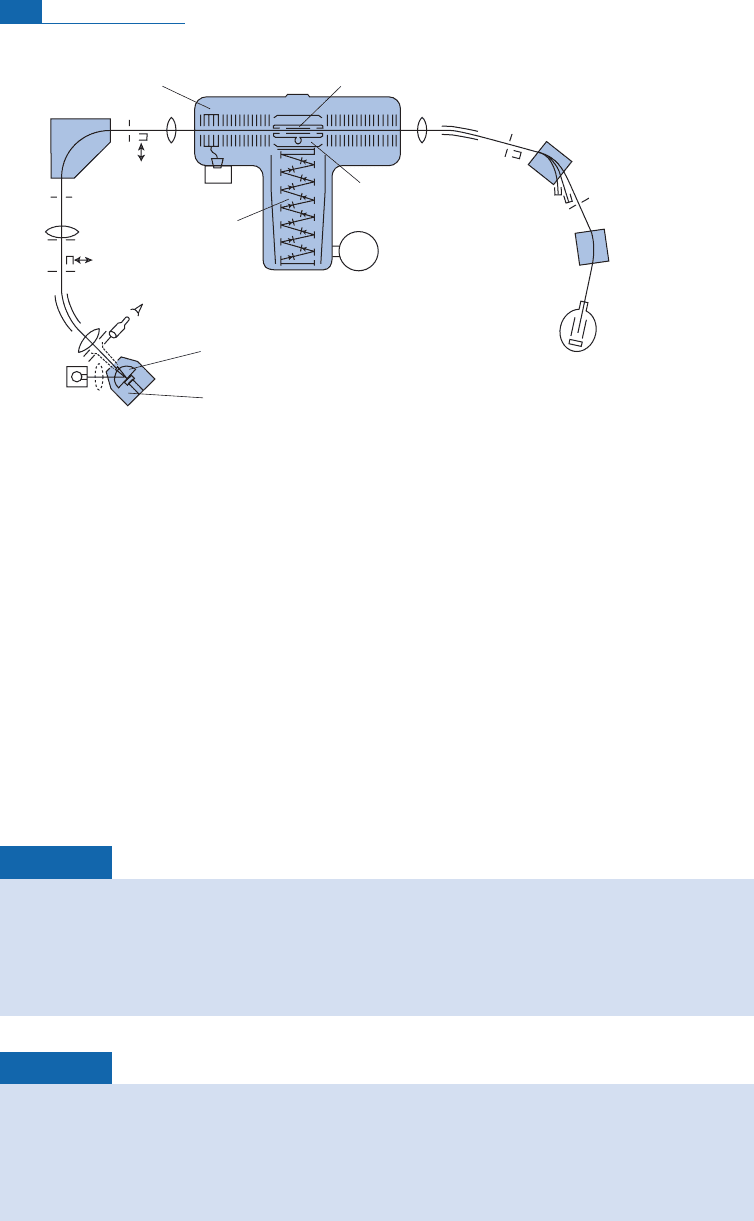
Pre-selection electrode Stripping canal
Stripping gas
pump
Voltage
multiplier
Gas
ionization
detector
Extraction electrode
Sample holder
Microscope
Cesium
gun
L5
F3
M2
M3
L2
L1
E1
F1
L3
F2
L4
M1
F4
F5
Figure 4.7 Accelerator mass spectrometer. This device is much larger and more complex than an
ordinary mass spectrometer as it operates at much higher ion acceleration energies, but the principle
is unchanged. The ions are extracted on the left by being bombarded with a beam of cesium ions and
are then deflected first by an electrostatic field E1 and then by a magnetic field M1. In the center of the
figure, a microchannel injects gas which collides with the beams and destroys any molecules (this is
known as ‘‘stripping’’). The purified ions are then deflected by two electromagnets M2 and M3 and
collected by a detector similar to an ionization chamber used in particle physics.
117 Carbon-14 dating

4.2.3 Conditions for performing
14
C dating
Applying the formula
14
C ¼
14
Cð0Þ e
l
14
t
to ¢nd an age entails meeting a number of
extremelystringentconditions.
Thesystem musthave remained cl o s e d sincethe time thatis tobe dated.This means ifwe
wish to date a parchment, it must have neither gained nor lost any
14
Csincethetimethe
lamborsheepwhosehidewasusedtomaketheparchmentdied.Weneedtoknow
14
C(0)pre-
cisely, that is the init ia l
14
C content, that is the proportion of
14
C/C inthe animal atthe time
of its death.Theremustremain enough
14
Cforittobemeasu rable.
Lastly, and this is not th e least of the problems, the event whose age is to be determined
mustbe de¢ n ed.
Canwebe certain aboutall fourconditionsin practice?
T he closed system
The greatest danger from an open system is contamination ofthe sample, whether naturalor
arti¢cial.Take the case ofatree trunkwewishto date. Ifthe trun k hasbeen lying in humusfor
some time it will be impregnated, contaminated, by the carbon in the humus. Now, this car-
bon is‘‘older’’thanthe carbonofthetreethathasjustdiedandsodistortsthemeasurement.
Letus takethe example ofatree trun kwhose speci¢cactivity, that is, the
14
C radioactivity
per gram ofcarbon, is r
1
. Itlies for some ti me in humus whose radioactivity, in
14
Cpergram
ofcarbon, is r
2
.W hatis thelevelofradioactivityofthe mixturesupposing that10%ofthe car-
bon comesfromthehu mus?
r
1
¼
14
C
C
tree
; r
2
¼
14
C
C
humus
r
total
¼
14
C
tree
þ
14
C
humus
C
tree
þ C
humus
¼
14
C
C
tree
C
tree
C
tree
þ C
humus
þ
14
C
C
humus
C
humus
C
tree
þ C
humus
r
total
¼
14
C
C
tree
w þ
14
C
C
humus
ð1 wÞ:
Thevalue ofw ¼C
tree
/C
total
varies between 0 and1. (This is the same mixing formula as in
the section on isotopic dilution.)
Assuming that (
14
C/C)
tree
¼12.5 dpm g
1
and that (
14
C/C)
humus
¼4dpmg
1
,then
r
total
¼12.5 0.9 þ4 0. 1 ¼11.65 dp m g
1
, w ¼0.9.
This corresponds to an er ror of 7% by default. The age measured is older than the real
age. Conversely, ifwesuppose thetree trun k found in thesedimenthadbeen in soilwhichwas
still involvedin atmospheric exchanges, thenthe contamination,that is,the mixturebetween
14
Cinthedeadtree andtheg roundwould continuallymakethewood‘‘younger.’’
Determining the initial
14
Ccontent
Libbyhadassumedthatthevalueof13.5dpmg
1
ofcarbonwasthe currentvalueandvalidas
the initial value throughout time. However, several complications have arisen since then.
Not all plants ab sorb carbon isotopes in an identical manner. If (
14
C/C)
present
¼r
0
,the
118 Cosmogenic isotopes
value absorbed by living organisms is (
14
C/C)
organism
¼Rr
0
,whereR is a partition coe⁄-
cient.This coe⁄cient has been determined and to check it we measure the
13
C/
12
C ratio of
the objecttobe dated (Figure 4.8) (this is morefullyexplained in Chapter 7).
Onthe left is the
13
C scale,suchthat:
d
13
C ¼
13
C
12
C
sample
13
C
12
C
standard
13
C
12
C
standard
2
6
4
3
7
5
10
3
:
The standard is a carbonate. In practice, this fractionation is converted into an age di¡er-
encebytaking areferencestandard.
Weassumethatfractionation is directlyproportionaltothe di¡erencein mass.Therefore,
if R
3/2
is the partition coe⁄c ient between some plant and the atmosphere, for the
13
C/
12
C
ratio de¢nedby:
13
C
12
C
plant
13
C
12
C
atmosphere
¼ R
3=2
the partition coe⁄cientfor the (
14
C/
12
C) ratio
14
C
12
C
plant
14
C
12
C
atmosphere
¼ R
4=2
is suchthatR
4/2
¼2 R
3/2
.
It ispossible, then, tocor r ect fo r natura l f rac tionation of
14
C and express this correction
in age, which is done onthe rightof Figure4.8.
It was realized that the
14
C content of the atmospherehad varied over the c ourse of time.
This e¡ect was shown by measuring the
14
C of tree rings.Tree rings are evidence of annual
δ
13
C (‰)
Age correction (
Δt), years
0
400
–10
300
200
100
–100
0
–20
–30
Marine
carbonates
Soils
carbonates
Freshwater
carbonates
Bicarbonates in
subsurface water
C
4
plants
(grass)
C
3
plants
(wood)
Atmospheric CO
2
Animal
bone
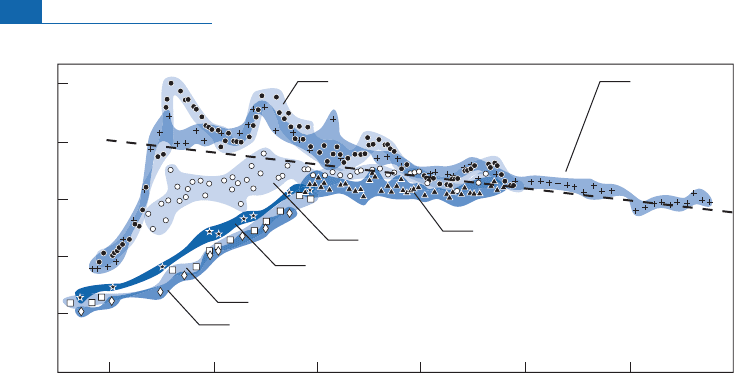
Figure 4.8 Carbon isotope fractionation relative to the atmosphere depending on the nature of the
substrate.
119 Carbon-14 dating
growth, with each ring representing one year. By counting the rings, we can work back
throughtime, yearby year.This is known as de n d roch ron olog y. Itwasnoticedthatthe ages
ofrings measured by
14
C andtheagesobtainedbycounting thesame ringsfailedto match.
Systematic investigation has shown that multiple phenomena are involved in this. The
burning of coal and oil, that is, materials whose
14
C is‘‘dead,’’ has diluted the‘‘natural’’
14
C
contentofthe atmosphere.The present-day content is toolow c ompared withwhatit would
be without this e¡ect. Likewise, for recent periods, nuclear testing by explosions in the
atmosphere has injected a large quantity of
14
C, which has largely disrupted the natural
cycle(Figure4.9) and,ofcourse, increasedthe
14
C contentofth e atmosphere.
The £uxofcosmic particles and therefore the production of
14
C varies over the course of
time. This is related to solar activity, to £uctuations in the Earth’s magnetic ¢eld, etc.We
therefore need a calibration curve describing variation ofthe
14
C/C ratio over time. At ¢rst
sight, this looks something like a chicken-and-egg situation because we wish to determine
an age fro m the
14
C/C measure ment but at the s ame ti me we wish to calculate the
14
C/C
ratio by using age measurement.The curve of
14
C/C variation in the atmosphere was con-
structed by dating samples using a di¡erent method. For recent per iods, tree rings were
used as the benchmark, and for earlier periods dates were ascertained by radioactive dise-
quilibrium methods.
To c a l i b r a t e t h e
14
C/C ratio, we ¢rst seek to calculate (
14
C/C)
initial
¼(
14
C/C)
measured
e
l
t
,
where t is the independently determined age. In this way a correction can be applied to the
age measured by the conventional method (Figure 4. 1 0). It is then p ossible to draw a curve
conne cting
14
C dates tohistorical calendar ages.To do this,1950 was taken as the reference
date for
14
C. Suppose we calculate a
14
C date of 3000 yearsbefore1950 (ifwe made the mea-
surementintheyear2000 wewouldremove 50 years!).Toobtainthe BCdate,wemustthere-
fore subtract1950: 3000 ^ 1950 ¼1050 BC(Figure 4. 11).
Years
Percentage excess
14
C
100
80
60
40
20
1963 1964 1965
41°
S
1966 1967 1967
36° N
21°
N
9° N
18° N
71° N
38° N
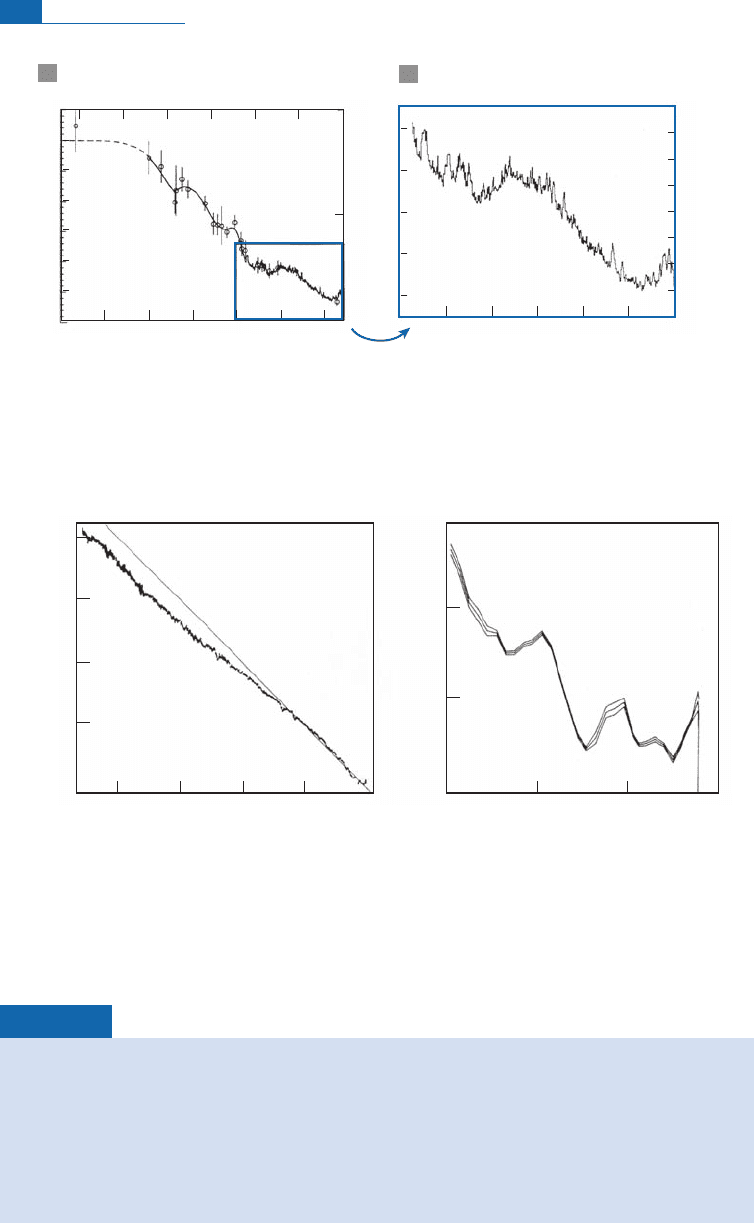
Figure 4.9 Changes in excess
14
C injected into the atmosphere by U.S. atom-bomb testing in the
Pacific. Each symbol corresponds to a latitude. The various, ever weaker, injection dates can be seen:
1963, 1964, 1965, 1966. It took several decades to return to equilibrium. After Libby (1970).
120 Cosmogenic isotopes
Exercise
We use the curve of
14
C/C variation with time (Figure 4.11). Suppose we find an age of 200
years for a piece of fabric using the standard
14
C formula. What date does this correspond to?
Answer
As can be seen, this ‘‘age’’ corresponds to two possible dates: 1630 or 1800. How can we
decide between the two? The answer is obtained by using other independent information
such as the nature of the fabric. This illustrates the limits of precision of
14
C.
Δt
atm
130
–1000
90
–800
–600
–400
–200
+200
0
50
10
–30
8000 6000
from –10
000 to 2000 years
Time (ka)
Time (years)
from –30
000 years to today
4000 2000 20000
500
400
0
100
200
300
25 20 15
15 10 5 0202530
10 5 0
a
b
14
C age (calendar year)
Δ
14
C (‰)
Figure 4.10 Calibration curves for
14
C. (a) For the older period, we use methods based on radioactive
disequilibrium as did Edouard Bard (Bard
et
a
l
., 1990); (b) for the recent period we can use tree rings
(Stuiver, 1965).
8000
6000
4000
2000
6000
4000 2000
Calendar age (years)
Radiocarbon age
0 2000
200
1600
1800 2000
400
Figure 4.11 Correspondence between calendar ages and
14
C ages. The
14
C age is the time between the
death of the organism and 1950. The calendar date begins at the birth of Jesus Christ. To this difference,
we must add the fluctuations caused by calibrations because of historical variations of (
14
C/C)
initial
.
121 Carbon-14 dating

Synthe t i c for m ula forage cal cu lation
When making calculations, we can convert everythingtothe additionofmagnitudeswhich
themselves have age dimensions.When applying the uncorrected conventional formulawe
obtain:
t
apparent
¼
1
l
ln
A
c
A
m
where A
c
is the initial conventional activityand A
m
is the activity as measured.The true age
mustbewritten:
t
true
¼
1
l
ln
A
0;real
P
2;4
A
m
where A
0,real
isthe real,initialactivityofthe atmosphere andP
2,4
isthe isotopefractionation
factor.We can also introduce in the parenthesis the reference value A
c
for the initial activity.
Dividing thetopand bottom gives:
t
true
¼
1
l
ln
A
0;real
A
c
A
c
A
m
P
2;4
:
Taking advantageofthe additivepropertyoflogarithms, wehave:
t
true
¼
1
l
ln
A
c
A
m
þ
1
l
ln P
2;4
þ
1
l
ln
A
0;real
A
c
:
Fromwhich, bytransform ingeverything intotimeunits:
t
true
¼ t
apparent
þ Dt
fractionation
þ Dt
atmospheric correction
where:
Dt
fractionation
¼
1
l
lnðP
2;4
Þ and Dt
atmospheric correction
¼
1
l
ln
A
0;real
A
c
;
withalittleextracalculationtrickbecause A
0;real
=A
c
canbeevaluatedasafunctionoftime
only.
We the refore calculate t
1
¼t
apparent
þt
fractionation
,thenwecanuset
1
to calculate
t
atmospheric correction
usingthe £uctuation curves of Figure 4. 11 ,an dwethen obtaint
true
.
Exercise
We measure the activity of a camel bone found in the tomb of the vizier Hemaka as 6.68 dpm g
1
.
What is the real date of the vizier’s death? (Use the existing calculations and graphs.)
Answer
In an exercise in Section 4.2.1 we dated the death of vizier Hemaka (4880 years ago) using an
ordinary wooden beam.
t
1
¼
t
apparent
þ D
t
fractionation
122 Cosmogenic isotopes
Using Figure 4.8 and the previous result, we get
t
1
¼4800 þ100 ¼4980 years, or 3030 BC.
By using the graph in Figure 4.10, we find for a date of 3000 BC a correction of –250 years:
t
real
¼ 4980 250 ¼ 4730 years:
4.2.4 Other forms of cosmogenic radioactivity
Carbon-14 is far more important than any other spallation product created in the atmo-
sphere by interaction of cosmic rays, but some oth ers exist as well. These can be divided
intothreegroups(see Figure4.3):
The rare gases, which are free gases. These are incorporated into solid material by
trapping partof the atmosphe re.These are
39
Ar (T
1/2
¼269 years) and
81
Kr (T
1/2
¼2.1
10
5
years);
Gaseous products, which, similarly to
14
C, are incorporate d into reactive atmospheric
molecules. Forexample
3
H(tritium;T
1/2
¼12.43 years)or
36
Cl (T
1/2
¼3.08 10
5
years);
Productswhicharenotgaseousbutadhereimmediatelyafter their formationtodustpar-
ticles and follow the history of the dust rather than the gaseou s atmosphere. Examples
are
10
Be(T
1/2
¼1.51 10
6
years) or
26
Al(T
1/2
¼7.16 10
5
years).
Beryllium-10
Beryllium-10 (
10
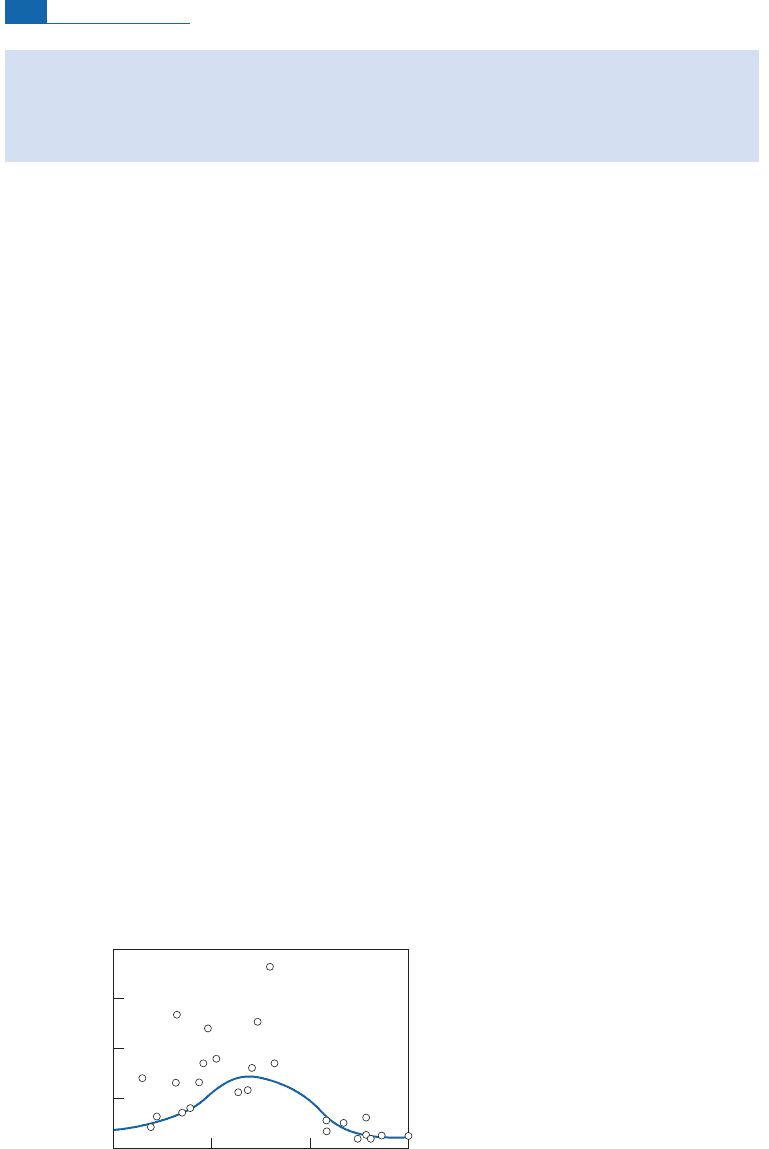
Be)isproducedbyspallationofnitrogenandoxygen intheatmosphere.As
soon as it forms, it is adsorbed onto particles in the atmosphere an d incorporated in rain.
Accordingly, it is more or less well mixed. Its lifetime in the atmosphere is short and as its
production varies with latitude (as with
14
C), its distribution may be extremely heteroge-
neous an d evenerratic (Figure 4.1 2).
A further complication arises b e cause
9
Be, common beryllium (which has just this one
isotope), has a completely di¡erent geochemical history to
10
Be. It is incorporated in rocks
andsoin dustderivedfrom erosionandscatteredbythewind.The
10
Be/
9
Beratioistherefore
just as erratic as the absolute
10
Be content.We cannotuse
10
B e like
14
C, assuming auniform
Latitude, N or S
10
Be flux
(10
6
atoms cm
–2
yr
–1
)
4
30°
60° 90°
2
1
Figure 4.12 Variations in the flux of
10
Be with latitude display substantial dispersion.
123 Carbon-14 dating
value for the entire Earth at anygiven time. One m ethod is to assume that, at a given place,
£uctuations in the
10
Be/
9
Be ratio are low and at any rate much lower than those arising
from the radioactive decayof
10
Be. Itisthenpossibletouse
10
Beas achronometer.
Exercise
We wish to measure the rate of accretion of manganese nodules found in the ocean. How can
we set about this, knowing that the variation in the
10
Be/
9
Be ratio with depth is
10
Be/
9
Be ¼(
10
Be/
9
Be)
0
e
lt
?
Answer
t
¼
x
thicknessðÞ
a accretion rateðÞ
,
from which:
10
Be
9
Be
¼
10
Be
9
Be
0
e
l
x
a
.
Switching to logarithms gives:
ln
10
Be
9
Be
¼ ln
10
Be
9
Be
0
l
x
a
:
The logarithm of the ratio
10
Be/
9
Be plotted as a function of thickness is a straight line of slope
l=
aÞð , which gives the rate of accretion,
a
.
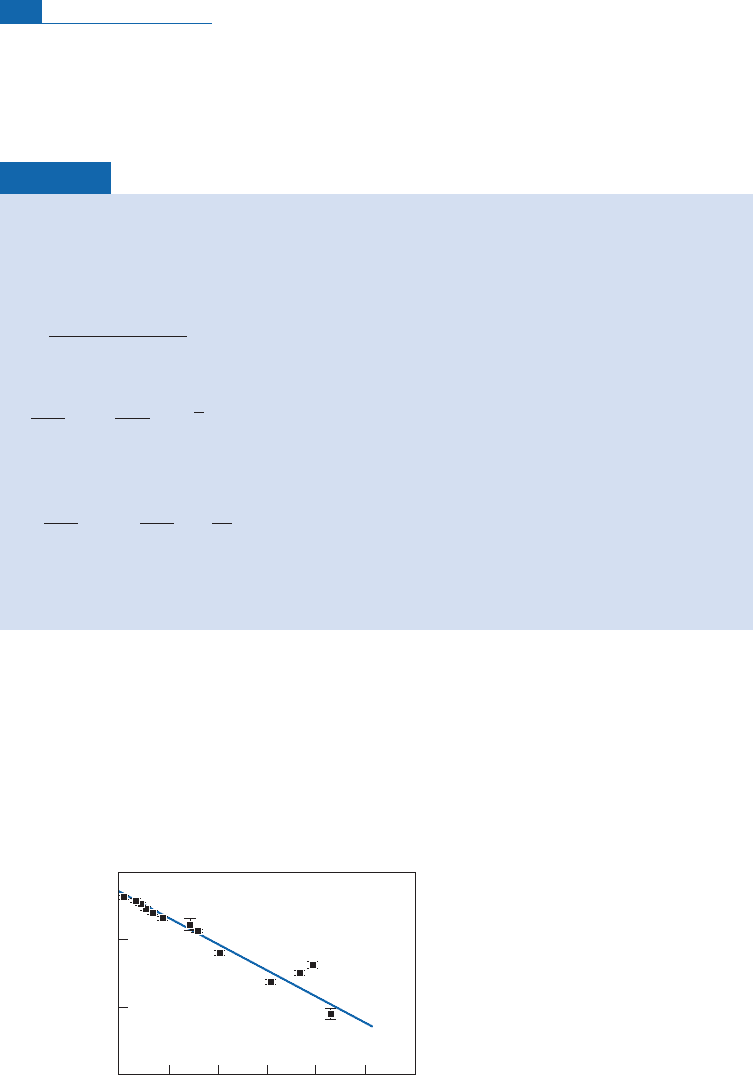
O’Nions et al.(1998) measured the
10
Be/
9
Be ratios in manganese crusts of the North
Atlantic. Figure 4. 13 shows the results theyobtained.This methodyielded an accretion rate
of 2.37 0. 15 mm Ma
1
.
10
–8
10
–9
10
–10
10
–7
5 10 15 20 25
Thickness (mm)
10
Be/
9
Be
a = 2.37 ± 0.15 mm/ Ma
–1
Figure 4.13 Variation in the
10
Be/
9
Be ratios in a manganese concretion from the Atlantic Ocean.
Magnitude
a
indicates the rate of accretion of the nodule. After O’Nions
et
a
l
.(1998).
124 Cosmogenic isotopes
4.2.5 Dating oceanic cycles with
14
C
This is a rather unusual m ethod of dating, but one that is very important in oceanography.
The residence time of a chemi cal element in a reservoir is the average time the element
spends in the reservoir (Figure 4. 1 4) (s ee further discussion in Chapter 4). If W is the £ux
and V the reservoir volume, we positthat ¼(V/W).
Broecker and colleagues at the Lamont Observatory of Columbia University at
NewYork came up with the idea ofusing
14
C to determine the residence time ofwater in the
deep ocean (Broecker et al., 196 0;BroeckerandLi,1970). The ocean is divided into two
layers: a surface layer that is well mixed by currents and wh ich is constantly exchanging its
CO
2
(andsoits
14
C)withtheatmosphere,andadeeplayerwhich exchangeswaterand matter
withthe surface layer. Let B denotethe £owofsolid carbonate particles (moles yr
1
)falling
from the surface and dissolving in the deep ocean; W and W
0
are the £ows of descending
and ascending water which summarize the exchange between the upper layer and the
deep ocean (m
3
yr
1
):W ¼W
0
; C
s
and C
d
are the concentrations of carb on dissolved in
the surface and deep layers (moles m
3
); R is the
14
C/C ratio standardized relative to
the atmosphere, R
s
and R
d
being the ratios for the surface water and deep water.The total
carbon conservation equation is written:
ðWC
s
þ BÞ¼WC
d
:
The equation for
14
C is:
ðWC
s
þ BÞR
s
¼ WC
d
R
d
þ V
d
C
d
R
d
l:
The residencetime in the deep water is:
d
¼
V
d
C
d
WC
d
¼
V
d
W
;
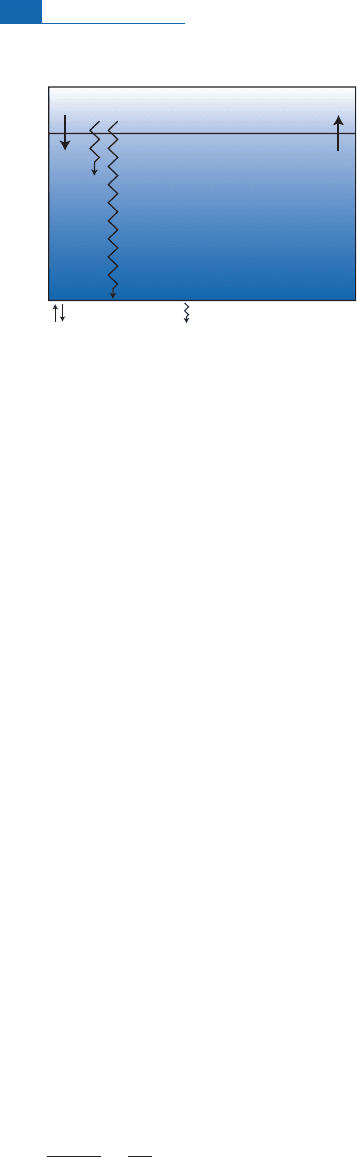
Atmosphere
Surface water
Deep water
R
A
= 1
R
S
= 0.95
R
p
= 0.80
W'
W
B
Water exchange Solid particle flux
Figure 4.14 The behavior of
14
C in the ocean. The ocean is divided into two reservoirs: the upper layer,
which is well mixed, and the deep ocean.
R
is the
14
C/C ratio.
B
, flow of solid carbonate particles;
W
,
W
1
,
descending and ascending flows of water.
125 Carbon-14 dating

which, giventheforegoing equations, is written:
d
¼
R
s
R
d
1
1
l
:
Now, l ¼1.20 9 10
4
yr
1
, therefore
d
¼1550 years.
4.3 Exposure ages
4.3.1 Meteorites
Meteorites are fragments of planetarybodies resulting from collisions and whose primary
age is close to that of the Solar System (4.55 Ga, as an indication). They are p iec es of rock
‘‘£oating’’ in i nterplan etary space. Most come from the asteroid belt, between Mars and
Jupiter,which isformedofrockdebris,pie cesofwh ich maymeasureakilometerorsoacross
(Ceres). Some were ripped from Marsor the Moon.These rocks driftloose in space and are
continuallysubjectedto cosmic radiationwhose average energy is1GeV. Just as happens in
the atmosphere, when cosmic‘‘primary’’protons penetratethese rocks theygive ris e tosec-
ondary neutrons, which produce most of the nuclear reactions.
5
These parti cles produce
nuclear reactions at depths ranging from a few tens of centimeters up to a meter at most.
Thesurface layers ofrocks exposedto cosmic rays arethereforethe siteofnuclear reactions,
usually spallation reactions.Theygive rise to isotopes of lower mass than the target, whi ch
are known as cos mo gen ic is otope s (see Paneth et al.,1952; Honda and Arnold,1964). The
nuclei engenderedbysuch reactions include radioactive and stable isotopes.Both types are
very numerous.
Stable i sotop es
Thenumberofcosmogenicstable isotopes N
s
producedperunittimeiswritten :
dN
s
ðtÞ
dt
¼
s
N
c!s
;
where is the particle £ux,
s
is the e¡ective cross-se ction of the reaction, thatis, the prob-
abilityofa nuclear reaction o ccurring, and N
c!s
thenumb eroftarget atomsproducingthe
stable daughter isotope, s, by nuclear reaction. If th e £ux is constant in terms of intensity
and spectralenergy, then:
N
s
ðtÞ¼
s
N
c!s
t:
Thenumberofdaughter isotopes is directly propor tionaltotheirradiationtime.
Itseemsstraightfor wardenoughto calculatetheageofirradiation,providedweknow,
s
,
and N
c!s
. It is comparatively easy to measure the parameter N
c!s
:itistheconcentrationof
5
As explained, protons carry a positive charge and do not penetrate readily into matter because they are
repelled electronically. Neutrons carry no charge and so penetrate much more readily.
126 Cosmogenic isotopes