Anderson D.R., Sweeney D.J., Williams T.A. Essentials of Statistics for Business and Economics
Подождите немного. Документ загружается.


Supplementary Exercises 135
Men 26 23 28 25 27 30 26 35 28
21 24 27 29 30 27 32 27 25
Women 20 28 23 30 24 29 26 25
22 22 25 23 27 26 19
a. Determine the median age at the time of first marriage for men and women.
b. Compute the first and third quartiles for both men and women.
c. Twenty-five years ago the median age at the time of first marriage was 25 for men and
22 for women. What insight does this information provide about the decision of when
to marry among young people today?
60. Dividend yield is the annual dividend per share a company pays divided by the current
market price per share expressed as a percentage. Asample of 10 large companies provided
the following dividend yield data (The Wall Street Journal, January 16, 2004).
Company Yield % Company Yield %
Altria Group 5.0 General Motors 3.7
American Express 0.8 JPMorgan Chase 3.5
Caterpillar 1.8 McDonald’s 1.6
Eastman Kodak 1.9 United Technology 1.5
ExxonMobil 2.5 Wal-Mart Stores 0.7
file
WEB
Ages
a. What are the mean and median dividend yields?
b. What are the variance and standard deviation?
c. Which company provides the highest dividend yield?
d. What is the z-score for McDonald’s? Interpret this z-score.
e. What is the z-score for
General Motors? Interpret this z-score.
f. Based on z-scores, do the data contain any outliers?
61. The U.S. Department of Education reports that about 50% of all college students use a
student loan to help cover college expenses (National Center for Educational Studies,
January 2006). A sample of students who graduated with student loan debt is shown here.
The data, in thousands of dollars, show typical amounts of debt upon graduation.
10.1 14.8 5.0 10.2 12.4 12.2 2.0 11.5 17.8 4.0
a. For those students who use a student loan, what is the mean loan debt upon graduation?
b. What is the variance? Standard deviation?
62. Small business owners often look to payroll service companies to handle their employee
payroll. Reasons are that small business owners face complicated tax regulations, and
penalties for employment tax errors are costly. According to the Internal Revenue Service,
26% of all small business employment tax returns contained errors that resulted in a tax
penalty to the owner (The Wall Street Journal, January 30, 2006). The tax penalty for a
sample of 20 small business owners follows:
820 270 450 1010 890 700 1350 350 300 1200
390 730 2040 230 640 350 420 270 370 620
a. What is the mean tax penalty for improperly filed employment tax returns?
b. What is the standard deviation?
c. Is the highest penalty, $2040, an outlier?
d. What are some of the advantages of a small business owner hiring a payroll service
company to handle employee payroll services, including the employment tax returns?
63. Publictransportationandtheautomobilearetwomethodsanemployeecanusetogettowork
each day. Samples of times recorded for each method are shown.Timesare in minutes.
file
WEB
Penalty
CH003.qxd 8/16/10 6:28 PM Page 135
Copyright 2010 Cengage Learning. All Rights Reserved. May not be copied, scanned, or duplicated, in whole or in part. Due to electronic rights, some third party content may be suppressed from the eBook and/or eChapter(s).
Editorial review has deemed that any suppressed content does not materially affect the overall learning experience. Cengage Learning reserves the right to remove additional content at any time if subsequent rights restrictions require it.

136 Chapter 3 Descriptive Statistics: Numerical Measures
State Region Poverty % State Region Poverty %
Alabama SE 23.0 Montana W 17.3
Alaska W 15.1 Nebraska MW 14.4
Arizona SW 19.5 Nevada W 13.9
Arkansas SE 24.3 New Hampshire NE 9.6
California W 18.1 New Jersey NE 11.8
Colorado W 15.7 New Mexico SW 25.6
Connecticut NE 11.0 New York NE 20.0
Delaware NE 15.8 North Carolina SE 20.2
Florida SE 17.5 North Dakota MW 13.0
Georgia SE 20.2 Ohio MW 18.7
Hawaii W 11.4 Oklahoma SW 24.3
Idaho W 15.1 Oregon W 16.8
Illinois MW 17.1 Pennsylvania NE 16.9
Indiana MW 17.9 Rhode Island NE 15.1
Iowa MW 13.7 South Carolina SE 22.1
Kansas MW 15.6 South Dakota MW 16.8
Kentucky SE 22.8 Tennessee SE 22.7
Louisiana SE 27.8 Texas SW 23.9
Maine NE 17.6 Utah W 11.9
Maryland NE 9.7 Vermont NE 13.2
Massachusetts NE 12.4 Virginia SE 12.2
Michigan MW 18.3 Washington W 15.4
Minnesota MW 12.2 West Virginia SE 25.2
Mississippi SE 29.5 Wisconsin MW 14.9
Missouri MW 18.6 Wyoming W 12.0
Public Transportation: 28 29 32 37 33 25 29 32 41 34
Automobile: 29 31 33 32 34 30 31 32 35 33
a. Compute the sample mean time to get to work for each method.
b. Compute the sample standard deviation for each method.
c. On the basis of your results from parts (a) and (b), which method of transportation
should be preferred? Explain.
d. Develop a box plot for each method. Does a comparison of the box plots support your
conclusion in part (c)?
64. The National Association of Realtors reported the median home price in the United States
and the increase in median home price over a five-year period (The Wall Street Journal, Jan-
uary 16, 2006). Use the sample home prices shown here to answer the following questions.
995.9 48.8 175.0 263.5 298.0 218.9 209.0
628.3 111.0 212.9 92.6 2325.0 958.0 212.5
a. What is the sample median home price?
b. In January 2001, the National Association of Realtors reported a median home price
of $139,300 in the United States. What was the percentage increase in the median
home price over the five-year period?
c. What are the first quartile and the third quartile for the sample data?
d. Provide a five-number summary for the home prices.
e. Do the data contain any outliers?
f. What is the mean home price for the sample? Why does the National Association of
Realtors prefer to use the median home price in its reports?
65. The U.S. Census Bureau’s American Community Survey reported the percentage of
children under 18 years of age who had lived below the poverty level during the previous
12 months (U.S. Census Bureau website, August 2008). The region of the country, North-
east (NE), Southeast (SE), Midwest (MW), Southwest (SW), and West (W) and the per-
centage of children under 18 who had lived below the poverty level are shown for each state.
file
W
EB
Homes
file
WEB
PovertyLevel
CH003.qxd 8/16/10 6:28 PM Page 136
Copyright 2010 Cengage Learning. All Rights Reserved. May not be copied, scanned, or duplicated, in whole or in part. Due to electronic rights, some third party content may be suppressed from the eBook and/or eChapter(s).
Editorial review has deemed that any suppressed content does not materially affect the overall learning experience. Cengage Learning reserves the right to remove additional content at any time if subsequent rights restrictions require it.

Supplementary Exercises 137
file
WEB
FairValue
a. What is the median poverty level percentage for the 50 states?
b. What are the first and third quartiles? What is your interpretation of the quartiles?
c. Show a box plot for the data. Interpret the box plot in terms of what it tells you about
the level of poverty for children in the United States. Are any states considered out-
liers? Discuss.
d. Identify the states in the lower quartile. What is your interpretation of this group and
what region or regions are represented most in the lower quartile?
66. Travel + Leisure magazine presented its annual list of the 500 best hotels in the world
(Travel + Leisure, January 2009). The magazine provides a rating for each hotel along
with a brief description that includes the size of the hotel, amenities, and the cost
per night for a double room. Asample of 12 of the top-rated hotels in the United States
follows.
Hotel Location Rooms Cost/Night
Boulders Resort & Spa Phoenix, AZ 220 499
Disney
’s Wilderness Lodge Orlando, FL 727 340
Four Seasons Hotel Beverly Hills Los Angeles, CA 285 585
Four Seasons Hotel Boston, MA 273 495
Hay-Adams Washington, DC 145 495
Inn on Biltmore Estate Asheville, NC 213 279
Loews Ventana Canyon Resort Phoenix, AZ 398 279
Mauna Lani Bay Hotel Island of Hawaii 343 455
Montage Laguna Beach Laguna Beach, CA 250 595
Sofitel Water Tower Chicago, IL 414 367
St. Regis Monarch Beach Dana Point, CA 400 675
The Broadmoor Colorado Springs, CO 700 420
file
WEB
Travel
a. What is the mean number of rooms?
b. What is the mean cost per night for a double room?
c. Develop a scatter diagram with the number of rooms on the horizontal axis and the
cost per night on the vertical axis. Does there appear to be a relationship between the
number of rooms and the cost per night? Discuss.
d. What is the sample correlation coefficient? What does it tell you about the relation-
ship between the number of rooms and the cost per night for a double room? Does this
appear reasonable? Discuss.
67. Morningstar tracks the performance of a large number of companies and publishes an eval-
uation of each. Along with a variety of financial data, Morningstar includes a Fair Value
estimate for the price that should be paid for a share of the company’s common stock. Data
for 30 companies are available in the file named FairValue. The data include the Fair Value
estimate per share of common stock, the most recent price per share, and the earning per
share for the company (Morningstar Stocks 500, 2008).
a. Develop a scatter diagram for the Fair Value and Share Price data with Share Price on
the horizontal axis. What is the sample correlation coefficient, and what can you say
about the relationship between the variables?
b. Develop a scatter diagram for the Fair Value and Earnings per Share data with Earn-
ings per Share on the horizontal axis. What is the sample correlation coefficient, and
what can you say about the relationship between the variables?
68. Does a major league baseball team’s record during spring training indicate how the team
will play during the regular season? Over the last six years, the correlation coefficient be-
tween a team’s winning percentage in spring training and its winning percentage in the reg-
ular season is .18 (The Wall Street Journal, March 30, 2009). Shown are the winning
percentages for the 14 American League teams during the 2008 season.
CH003.qxd 8/16/10 6:28 PM Page 137
Copyright 2010 Cengage Learning. All Rights Reserved. May not be copied, scanned, or duplicated, in whole or in part. Due to electronic rights, some third party content may be suppressed from the eBook and/or eChapter(s).
Editorial review has deemed that any suppressed content does not materially affect the overall learning experience. Cengage Learning reserves the right to remove additional content at any time if subsequent rights restrictions require it.

138 Chapter 3 Descriptive Statistics: Numerical Measures
Speed
(miles per hour) Frequency
45–49 10
50–54 40
55–59 150
60–64 175
65–69 75
70–74 15
75–79 10
Total 475
70. Automobiles traveling on a road with a posted speed limit of 55 miles per hour are
checked for speed by a state police radar system. Following is a frequency distribution
of speeds.
a. What is the correlation coefficient between the spring training and the regular season
winning percentages?
b. What is your conclusion about a team’s record during spring training indicating how
the team will play during the regular season? What are some of the reasons why this
occurs? Discuss.
69. The days to maturity for a sample of five money market funds are shown here. The
dollar amounts invested in the funds are provided. Use the weighted mean to determine
the mean number of days to maturity for dollars invested in these five money mar-
ket funds.
Days to Dollar Value
Maturity ($millions)
20 20
12 30
710
515
610
file
WEB
SpringTraining
Spring Regular Spring Regular
Team Training Season Team Training Season
Baltimore Orioles .407 .422 Minnesota Twins .500 .540
Boston Red Sox .429 .586 New York Yankees .577 .549
Chicago White Sox .417 .546 Oakland A
’s .692 .466
Cleveland Indians .569 .500 Seattle Mariners .500 .377
Detroit Tigers .569 .457 Tampa Bay Rays .731 .599
Kansas City Royals .533 .463 Texas Rangers .643 .488
Los Angeles Angels .724 .617 Toronto Blue Jays .448 .531
a. What is the mean speed of the automobiles traveling on this road?
b. Compute the variance and the standard deviation.
Case Problem 1 Pelican Stores
Pelican Stores, a division of National Clothing, is a chain of women’s apparel stores
operating throughout the country. The chain recently ran a promotion in which discount
CH003.qxd 8/16/10 6:28 PM Page 138
Copyright 2010 Cengage Learning. All Rights Reserved. May not be copied, scanned, or duplicated, in whole or in part. Due to electronic rights, some third party content may be suppressed from the eBook and/or eChapter(s).
Editorial review has deemed that any suppressed content does not materially affect the overall learning experience. Cengage Learning reserves the right to remove additional content at any time if subsequent rights restrictions require it.

Case Problem 1 Pelican Stores 139
coupons were sent to customers of other National Clothing stores. Data collected for a
sample of 100 in-store credit card transactions at Pelican Stores during one day while the
promotion was running are contained in the file named PelicanStores. Table 3.12 shows a
portion of the data set. The proprietary card method of payment refers to charges made us-
ing a National Clothing charge card. Customers who made a purchase using a discount
coupon are referred to as promotional customers and customers who made a purchase but
did not use a discount coupon are referred to as regular customers. Because the promo-
tional coupons were not sent to regular Pelican Stores customers, management considers
the sales made to people presenting the promotional coupons as sales it would not other-
wise make. Of course, Pelican also hopes that the promotional customers will continue to
shop at its stores.
Most of the variables shown in Table 3.12 are self-explanatory, but two of the variables
require some clarification.
Items The total number of items purchased
Net Sales The total amount ($) charged to the credit card
Pelican’s management would like to use this sample data to learn about its customer base
and to evaluate the promotion involving discount coupons.
Managerial Report
Use the methods of descriptive statistics presented in this chapter to summarize the
data and comment on your findings. At a minimum, your report should include the
following:
1. Descriptive statistics on net sales and descriptive statistics on net sales by various
classifications of customers.
2. Descriptive statistics concerning the relationship between age and net sales.
file
W
EB
PelicanStores
Type of Method of Marital
Customer Customer Items Net Sales Payment Gender Status Age
1 Regular 1 39.50 Discover Male Married 32
2 Promotional 1 102.40 Proprietary Card Female Married 36
3 Regular 1 22.50 Proprietary Card Female Married 32
4 Promotional 5 100.40 Proprietary Card Female Married 28
5 Regular 2 54.00 MasterCard Female Married 34
6 Regular 1 44.50 MasterCard Female Married 44
7 Promotional 2 78.00 Proprietary Card Female Married 30
8 Regular 1 22.50 Visa Female Married 40
9 Promotional 2 56.52 Proprietary Card Female Married 46
10 Regular 1 44.50 Proprietary Card Female Married 36
.... . ...
.... . ...
.... . ...
96 Regular 1 39.50 MasterCard Female Married 44
97 Promotional 9 253.00 Proprietary Card Female Married 30
98 Promotional 10 287.59 Proprietary Card Female Married 52
99 Promotional 2 47.60 Proprietary Card Female Married 30
100 Promotional 1 28.44 Proprietary Card Female Married 44
TABLE 3.12
SAMPLE OF 100 CREDIT CARD PURCHASES AT PELICAN STORES
CH003.qxd 8/16/10 6:28 PM Page 139
Copyright 2010 Cengage Learning. All Rights Reserved. May not be copied, scanned, or duplicated, in whole or in part. Due to electronic rights, some third party content may be suppressed from the eBook and/or eChapter(s).
Editorial review has deemed that any suppressed content does not materially affect the overall learning experience. Cengage Learning reserves the right to remove additional content at any time if subsequent rights restrictions require it.

140 Chapter 3 Descriptive Statistics: Numerical Measures
Opening Total Number Weeks
Gross Sales Gross Sales of in Top
Motion Picture ($millions) ($millions) Theaters 60
Coach Carter 29.17 67.25 2574 16
Ladies in Lavender 0.15 6.65 119 22
Batman Begins 48.75 205.28 3858 18
Unleashed 10.90 24.47 1962 8
Pretty Persuasion 0.06 0.23 24 4
Fever Pitch 12.40 42.01 3275 14
Harry Potter and the Goblet of Fire 102.69 287.18 3858 13
Monster-in-Law 23.11 82.89 3424 16
White Noise 24.11 55.85 2279 7
Mr. and Mrs. Smith 50.34 186.22 3451 21
TABLE 3.13
PERFORMANCE DATA FOR 10 MOTION PICTURES
Case Problem 2 Motion Picture Industry
The motion picture industry is a competitive business. More than 50 studios produce a total
of 300 to 400 new motion pictures each year, and the financial success of each motion pic-
ture varies considerably. The opening weekend gross sales, the total gross sales, the number
of theaters the movie was shown in, and the number of weeks the motion picture was in the
top 60 for gross sales are common variables used to measure the success of a motion picture.
Data collected for a sample of 100 motion pictures produced in 2005 are contained in the file
named Movies. Table 3.13 shows the data for the first 10 motion pictures in the file.
Managerial Report
Usethenumericalmethodsofdescriptivestatisticspresentedinthischaptertolearnhowthese
variables contribute to the success of a motion picture. Include the following in your report.
1. Descriptive statistics for each of the four variables along with a discussion of what
the descriptive statistics tell us about the motion picture industry.
2. What motion pictures, if any, should be considered high-performance outliers? Explain.
3. Descriptive statistics showing the relationship between total gross sales and each of
the other variables. Discuss.
Case Problem 3 Heavenly Chocolates Website Transactions
Heavenly Chocolates manufactures and sells quality chocolate products at its plant and retail
store located in Saratoga Springs, New York. Two years ago the company developed a web-
site and began selling its products over the Internet. Website sales have exceeded the com-
pany’s expectations, and mangement is now considering stragegies to increase sales even
further. To learn more about the website customers, a sample of 50 Heavenly Chocolate
transactions was selected from the previous month’s sales. Data showing the day of the week
each transaction was made, the type of browser the customer used, the time spent on the web-
site, the number of website pages viewed, and the amount spent by each of the 50 customers
are contained in the file named Shoppers. A portion of the data are shown in Table 3.14.
Heavenly Chocolates would like to use the sample data to determine if online shoppers
who spend more time and view more pages also spend more money during their visit to the
file
W
EB
Movies
CH003.qxd 8/16/10 6:28 PM Page 140
Copyright 2010 Cengage Learning. All Rights Reserved. May not be copied, scanned, or duplicated, in whole or in part. Due to electronic rights, some third party content may be suppressed from the eBook and/or eChapter(s).
Editorial review has deemed that any suppressed content does not materially affect the overall learning experience. Cengage Learning reserves the right to remove additional content at any time if subsequent rights restrictions require it.

Appendix 3.1 Descriptive Statistics Using Minitab 141
file
W
EB
Shoppers
Pages Amount
Customer Day Browser Time (min) Viewed Spent ($)
1 Mon Internet Explorer 12.0 4 54.52
2 Wed Other 19.5 6 94.90
3 Mon Internet Explorer 8.5 4 26.68
4 Tue Firefox 11.4 2 44.73
5 Wed Internet Explorer 11.3 4 66.27
6 Sat Firefox 10.5 6 67.80
7 Sun Internet Explorer 11.4 2 36.04
.. . . . .
.. . . . .
.. . . . .
.. . . . .
48 Fri Internet Explorer 9.7 5 103.15
49 Mon Other 7.3 6 52.15
50 Fri Internet Explorer 13.4 3 98.75
TABLE 3.14
ASAMPLE OF 50 HEAVENLY CHOCOLATES WEBSITE TRANSACTIONS
website. The company would also like to investigate the effect that the day of the week and
the type of browser have on sales.
Managerial Report
Use the methods of descriptive statistics to learn about the customers who visit the Heav-
enly Chocolates website. Include the following in your report.
1. Graphical and numerical summaries for the length of time the shopper spends on
the website, the number of pages viewed, and the mean amount spent per transac-
tion. Discuss what you learn about Heavenly Cholcolates’ online shoppers from
these numerical summaries.
2. Summarize the frequency, the total dollars spent, and the mean amount spent per
transaction for each day of week. What observations can you make about Hevenly
Chocolates’business based on the day of the week? Discuss.
3. Summarize the frequency, the total dollars spent, and the mean amount spent per
transaction for each type of browser. What observations can you make about Heav-
enly Chocolate’s business based on the type of browser? Discuss.
4. Develop a scatter diagram and compute the sample correlation coefficient to explore
the relationship between the time spent on the website and the dollar amount spent.
Use the horizontal axis for the time spent on the website. Discuss.
5. Develop a scatter diagram and compute the sample correlation coefficient to explore
the relationship between the the number of website pages viewed and the amount
spent. Use the horizontal axis for the number of website pages viewed. Discuss.
6. Develop a scatter diagram and compute the sample correlation coefficient to explore
the relationship between the time spent on the website and the number of pages
viewed. Use the horizontal axis to represent the number of pages viewed. Discuss.
Appendix 3.1 Descriptive Statistics Using Minitab
In this appendix, we describe how Minitab can be used to compute a variety of descriptive
statistics and display box plots. We then show how Minitab can be used to obtain covari-
ance and correlation measures for two variables.
CH003.qxd 8/16/10 6:28 PM Page 141
Copyright 2010 Cengage Learning. All Rights Reserved. May not be copied, scanned, or duplicated, in whole or in part. Due to electronic rights, some third party content may be suppressed from the eBook and/or eChapter(s).
Editorial review has deemed that any suppressed content does not materially affect the overall learning experience. Cengage Learning reserves the right to remove additional content at any time if subsequent rights restrictions require it.

142 Chapter 3 Descriptive Statistics: Numerical Measures
†
With the n observations arranged in ascending order (smallest value to largest value), Minitab uses the positions given by
(n ⴙ 1)/4 and 3(n ⴙ 1)/4 to locate Q
1
and Q
3
, respectively. When a position is fractional, Minitab interpolates between the
two adjacent ordered data values to determine the corresponding quartile.
Descriptive Statistics
Table 3.1 provided the starting salaries for 12 business school graduates. These data are
available in column C2 of the file StartSalary. The following steps can be used to generate
descriptive statistics for the starting salaries.
Step 1. Select the Stat menu
Step 2. Choose Basic Statistics
Step 3. Choose Display Descriptive Statistics
Step 4. When the Display Descriptive Statistics dialog box appears:
Enter C2 in the Variables box
Click OK
Figure 3.12 shows the descriptive statistics for the salary data obtained by using Minitab.
Definitions of the headings follow.
N number of data values
N* number of missing data values
Mean mean
SE Mean standard error of mean
StDev standard deviation
Minimum minimum data value
Q1 first quartile
Median median
Q3 third quartile
Maximum maximum data value
The label SE Mean refers to the standard error of the mean. It is computed by divid-
ing the standard deviation by the square root of N. The interpretation and use of this measure
are discussed in Chapter 7 when we introduce the topics of sampling and sampling
distributions.
Note that Minitab’s quartiles Q
1
⫽ 3457.5 and Q
3
⫽ 3625 are slightly different from
the quartiles Q
1
⫽ 3465 and Q
3
⫽ 3600 computed in Section 3.1. The different
conventions
†
used to identify the quartiles explain this variation. Hence, the values of Q
1
and Q
3
provided by one convention may not be identical to the values of Q
1
and Q
3
provided
by another convention. Any differences tend to be negligible, however, and the results
provided should not mislead the user in making the usual interpretations associated with
quartiles.
file
WEB
StartSalary
FIGURE 3.12 DESCRIPTIVE STATISTICS PROVIDED BY MINITAB
N N* Mean SEMean StDev
12 0 3540.0 47.8 165.7
Minimum Q1 Median Q3 Maximum
3310.0 3457.5 3505.0 3625.0 3925.0
CH003.qxd 8/16/10 6:28 PM Page 142
Copyright 2010 Cengage Learning. All Rights Reserved. May not be copied, scanned, or duplicated, in whole or in part. Due to electronic rights, some third party content may be suppressed from the eBook and/or eChapter(s).
Editorial review has deemed that any suppressed content does not materially affect the overall learning experience. Cengage Learning reserves the right to remove additional content at any time if subsequent rights restrictions require it.

Appendix 3.2 Descriptive Statistics Using Excel 143
Minitab provides 15 additional descriptive statistics that may be selected at the option
of the user. These additional descriptive statistics may be obtained by modifying step 4 as
follows:
Step 4. When the Display Descriptive Statistics dialog box appears:
Select Statistics
When the Display Descriptive Statistics—Statistics dialog box appears:
Check the desired descriptive statistics
Click OK
Click OK
Common additional descriptive statistics that may be selected include the variance, coeffi-
cient of variation, interquartile range, mode, sum, range, and skewness.
Box Plot
The following steps use the file StartSalary to generate the box plot for the starting salary
data.
Step 1. Select the Graph menu
Step 2. Choose Boxplot
Step 3. Select Simple and click OK
Step 4. When the Boxplot-One Y, Simple dialog box appears:
Enter C2 in the Graph variables box
Click OK
If you would like to show the box plots for two or more groups side-by-side on one graph,
select One Y With Groups in step 3 and then enter the groups in step 4.
Covariance and Correlation
Table 3.6 provided for the number of commercials and the sales volume for a stereo and
sound equipment store. These data are available in the file Stereo, with the number of com-
mercials in column C2 and the sales volume in column C3. The following steps show how
Minitab can be used to compute the covariance for the two variables.
Step 1. Select the Stat menu
Step 2. Choose Basic Statistics
Step 3. Choose Covariance
Step 4. When the Covariance dialog box appears:
Enter C2 C3 in the Variables box
Click OK
The Minitab output provides the variance of each variable in addition to the covariance.
To obtain the correlation coefficient for the number of commercials and the sales vol-
ume, only one change is necessary in the preceding procedure. In step 3, choose the
Correlation option.
Appendix 3.2 Descriptive Statistics Using Excel
Excel can be used to generate the descriptive statistics discussed in this chapter. We show
how Excel can be used to generate several measures of location and variability for a single
file
W
EB
StartSalary
file
WEB
StartSalary
CH003.qxd 8/16/10 6:28 PM Page 143
Copyright 2010 Cengage Learning. All Rights Reserved. May not be copied, scanned, or duplicated, in whole or in part. Due to electronic rights, some third party content may be suppressed from the eBook and/or eChapter(s).
Editorial review has deemed that any suppressed content does not materially affect the overall learning experience. Cengage Learning reserves the right to remove additional content at any time if subsequent rights restrictions require it.
144 Chapter 3 Descriptive Statistics: Numerical Measures
file
WEB
Stereo
variable and to generate the covariance and correlation coefficient as measures of
association between two variables.
Using Excel Functions
Excel provides functions for computing the mean, median, mode, sample variance, and sample
standard deviation. We illustrate the use of these Excel functions by computing the mean, median,
mode, sample variance, and sample standard deviation for the starting salary data in Table 3.1.
Refer to Figure 3.13 as we describe the steps involved. The data are entered in column B.
Excel’s AVERAGE function can be used to compute the mean by entering the follow-
ing formula into cell E1:
Similarly, the formulas ⫽MEDIAN(B2:B13), ⫽MODE(B2:B13), ⫽VAR(B2:B13), and
⫽STDEV(B2:B13) are entered into cells E2:E5, respectively, to compute the median,
mode, variance, and standard deviation. The worksheet in the foreground shows that
the values computed using the Excel functions are the same as we computed earlier in
the chapter.
Excel also provides functions that can be used to compute the covariance and correla-
tion coefficient. You must be careful when using these functions because the covariance
function treats the data as a population and the correlation function treats the data as a sam-
ple.Thus, the result obtained using Excel’s covariance function must be adjusted to provide
the sample covariance.We show here how these functions can be used to compute the sam-
ple covariance and the sample correlation coefficient for the stereo and sound equipment
store data in Table 3.7. Refer to Figure 3.14 as we present the steps involved.
⫽AVERAGE(B2:B13)
FIGURE 3.13 USING EXCEL FUNCTIONS FOR COMPUTING THE MEAN, MEDIAN, MODE, VARIANCE,
AND STANDARD DEVIATION
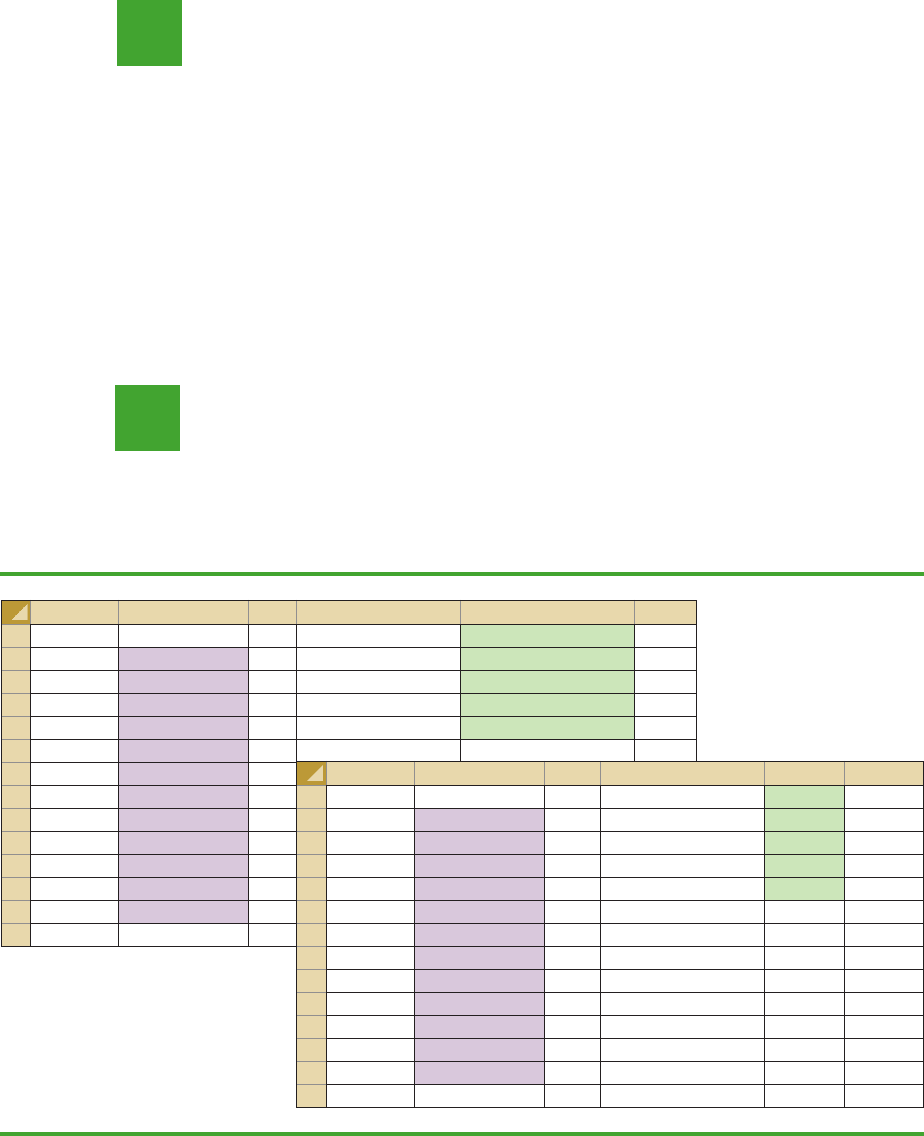
ABCD E F
1 Graduate Starting Salary Mean =AVERAGE(B2:B13)
2 1 3450 Median =MEDIAN(B2:B13)
3 2 3550 Mode =MODE(B2:B13)
4 3 3650 Variance =VAR(B2:B13)
5 4 3480 Standard Deviation =STDEV(B2:B13)
6 5 3355
7 6 3310
8 7 3490
9 8 3730
10 9 3540
11 10 3925
12 11 3520
13 12 3480
14
ABCD EF
1 Graduate Starting Salary Mean 3540
2 1 3450 Median 3505
3 2 3550 Mode 3480
4 3 3650 Variance 27440.91
5 4 3480 Standard Deviation 165.65
6 5 3355
7 6 3310
8 7 3490
9 8 3730
10 9 3540
11 10 3925
12 11 3520
13 12 3480
14
file
W
EB
StartSalary
CH003.qxd 8/16/10 6:28 PM Page 144
Copyright 2010 Cengage Learning. All Rights Reserved. May not be copied, scanned, or duplicated, in whole or in part. Due to electronic rights, some third party content may be suppressed from the eBook and/or eChapter(s).
Editorial review has deemed that any suppressed content does not materially affect the overall learning experience. Cengage Learning reserves the right to remove additional content at any time if subsequent rights restrictions require it.