Anderson D.R., Sweeney D.J., Williams T.A. Essentials of Statistics for Business and Economics
Подождите немного. Документ загружается.

9.3 Population Mean: σ Known 355
Let us see how the p-value is computed and used. The value of the test statistic is
used to compute the p-value. The method used depends on whether the test is a lower
tail, an upper tail, or a two-tailed test. For a lower tail test, the p-value is the probability
of obtaining a value for the test statistic as small as or smaller than that provided by the
sample. Thus, to compute the p-value for the lower tail test in the σ known case, we must
find using the standard normal distribution, the probability that z is less than or equal to
the value of the test statistic. After computing the p-value, we must then decide whether
it is small enough to reject the null hypothesis; as we will show, this decision involves
comparing the p-value to the level of significance.
Let us now compute the p-value for the Hilltop Coffee lower tail test. Suppose the sam-
ple of 36 Hilltop coffee cans provides a sample mean of 2.92 pounds. Is 2.92 small
enough to cause us to reject H
0
? Because this is a lower tail test, the p-value is the area un-
der the standard normal curve for values of z the value of the test statistic. Using
2.92, σ .18, and n 36, we compute the value of the test statistic z.
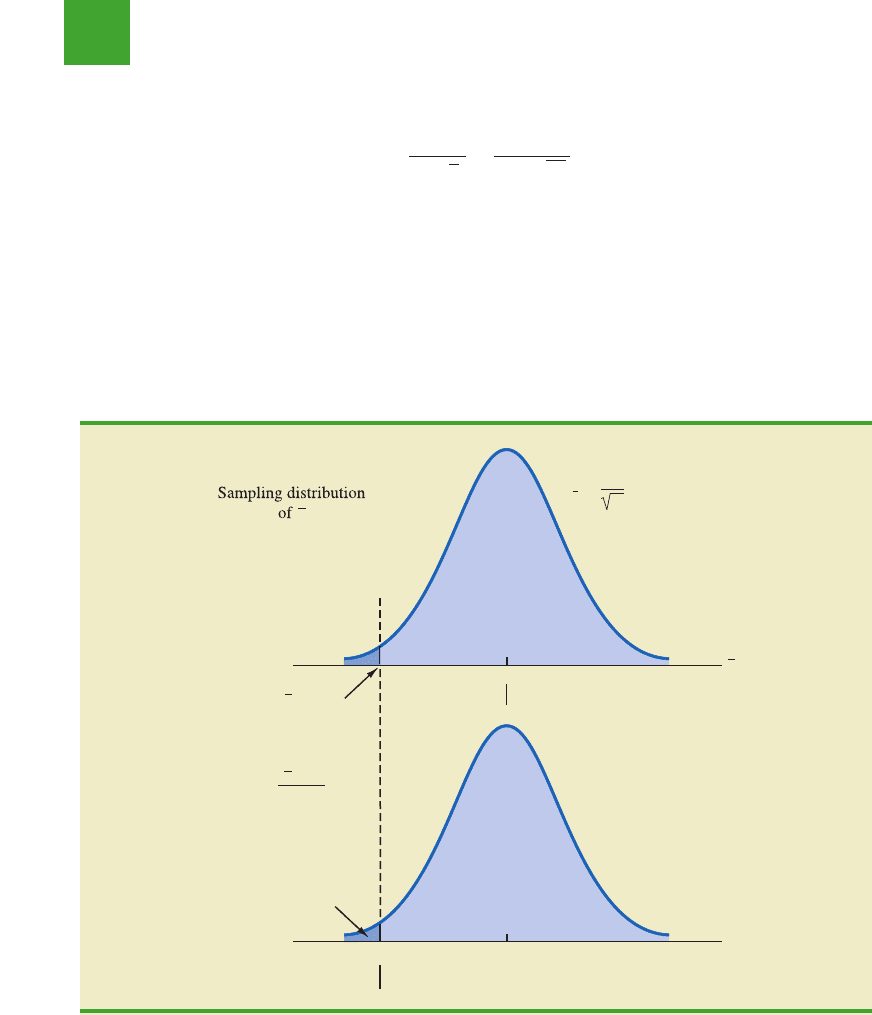
Thus, the p-value is the probability that z is less than or equal to 2.67 (the lower tail area
corresponding to the value of the test statistic).
Using the standard normal probability table, we find that the lower tail area at z
2.67 is .0038. Figure 9.2 shows that 2.92 corresponds to z 2.67 and a p-value
.0038. This p-value indicates a small probability of obtaining a sample mean of 2.92
(and a test statistic of 2.67) or smaller when sampling from a population with μ 3. This
x¯
x¯
z
x¯ μ
0
σ兾
兹
n
2.92 3
.18兾
兹
36
2.67
x¯
x¯x¯
x
0
z
p-value = .0038
z =
–2.67
.03
of z =
x – 3
x
x
= 2.92
Sampling distribution
= 3
µ
0
σ
x
=
σ
n
=
.03
FIGURE 9.2 p-VALUE FOR THE HILLTOP COFFEE STUDY WHEN 2.92 AND z 2.67x¯
file
W
EB
Coffee
CH009.qxd 8/16/10 6:40 PM Page 355
Copyright 2010 Cengage Learning. All Rights Reserved. May not be copied, scanned, or duplicated, in whole or in part. Due to electronic rights, some third party content may be suppressed from the eBook and/or eChapter(s).
Editorial review has deemed that any suppressed content does not materially affect the overall learning experience. Cengage Learning reserves the right to remove additional content at any time if subsequent rights restrictions require it.

p-value does not provide much support for the null hypothesis, but is it small enough to
cause us to reject H
0
? The answer depends upon the level of significance for the test.
As noted previously, the director of the FTC’s testing program selected a value of .01
for the level of significance. The selection of α .01 means that the director is willing to
tolerate a probability of .01 of rejecting the null hypothesis when it is true as an equality
(μ
0
3). The sample of 36 coffee cans in the Hilltop Coffee study resulted in a p-value
.0038, which means that the probability of obtaining a value of 2.92 or less when the
null hypothesis is true as an equality is .0038. Because .0038 is less than or equal to α .01,
we reject H
0
. Therefore, we find sufficient statistical evidence to reject the null hypothesis
at the .01 level of significance.
We can now state the general rule for determining whether the null hypothesis can be
rejected when using the p-value approach. For a level of significance α, the rejection rule
using the p-value approach is as follows.
x¯
356 Chapter 9 Hypothesis Tests
In the Hilltop Coffee test, the p-value of .0038 resulted in the rejection of the null hy-
pothesis. Although the basis for making the rejection decision involves a comparison of the
p-value to the level of significance specified by the FTC director, the observed p-value of
.0038 means that we would reject H
0
for any value of α .0038. For this reason, the p-value
is also called the observed level of significance.
Different decision makers may express different opinions concerning the cost of mak-
ing a Type I error and may choose a different level of significance. By providing the p-value
as part of the hypothesis testing results, another decision maker can compare the reported
p-value to his or her own level of significance and possibly make a different decision with
respect to rejecting H
0
.
Critical value approach The critical value approach requires that we first determine a
value for the test statistic called the critical value. For a lower tail test, the critical value
serves as a benchmark for determining whether the value of the test statistic is small enough
to reject the null hypothesis. It is the value of the test statistic that corresponds to an area of
α (the level of significance) in the lower tail of the sampling distribution of the test statis-
tic. In other words, the critical value is the largest value of the test statistic that will result
in the rejection of the null hypothesis. Let us return to the Hilltop Coffee example and see
how this approach works.
In the σ known case, the sampling distribution for the test statistic z is a standard nor-
mal distribution. Therefore, the critical value is the value of the test statistic that corresponds
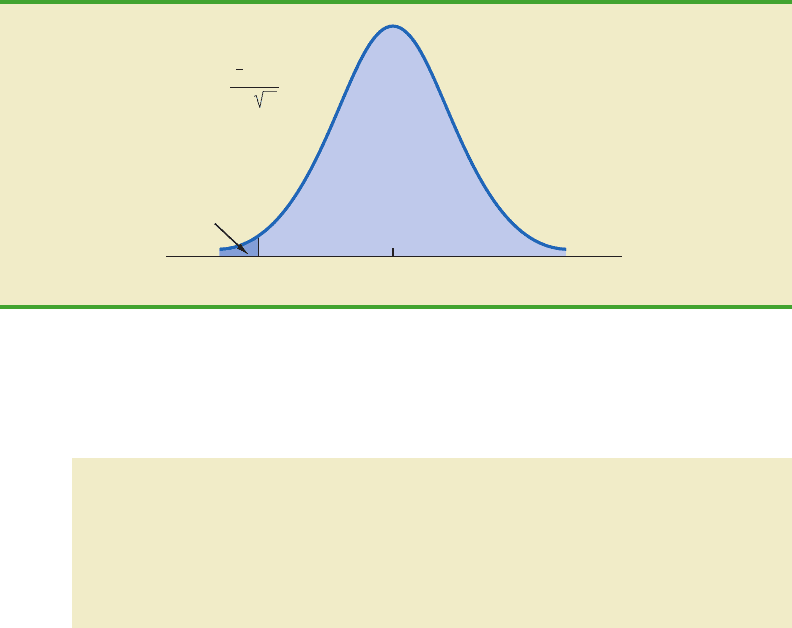
to an area of α .01 in the lower tail of a standard normal distribution. Using the standard
normal probability table, we find that z 2.33 provides an area of .01 in the lower tail
(see Figure 9.3). Thus, if the sample results in a value of the test statistic that is less than or
equal to 2.33, the corresponding p-value will be less than or equal to .01; in this case, we
should reject the null hypothesis. Hence, for the Hilltop Coffee study the critical value re-
jection rule for a level of significance of .01 is
In the Hilltop Coffee example, 2.92 and the test statistic is z 2.67. Because z
2.67 2.33, we can reject H
0
and conclude that Hilltop Coffee is underfilling cans.
x¯
Reject H
0
if z 2.33
REJECTION RULE USING p-VALUE
Reject H
0
if p-value α
CH009.qxd 8/16/10 6:40 PM Page 356
Copyright 2010 Cengage Learning. All Rights Reserved. May not be copied, scanned, or duplicated, in whole or in part. Due to electronic rights, some third party content may be suppressed from the eBook and/or eChapter(s).
Editorial review has deemed that any suppressed content does not materially affect the overall learning experience. Cengage Learning reserves the right to remove additional content at any time if subsequent rights restrictions require it.
We can generalize the rejection rule for the critical value approach to handle any level
of significance. The rejection rule for a lower tail test follows.
Summary The p-value approach to hypothesis testing and the critical value approach will
always lead to the same rejection decision; that is, whenever the p-value is less than or equal
to α, the value of the test statistic will be less than or equal to the critical value. The ad-
vantage of the p-value approach is that the p-value tells us how significant the results are
(the observed level of significance). If we use the critical value approach, we only know
that the results are significant at the stated level of significance.
At the beginning of this section, we said that one-tailed tests about a population mean
take one of the following two forms:
Lower Tail Test Upper Tail Test
We used the Hilltop Coffee study to illustrate how to conduct a lower tail test. We can use
the same general approach to conduct an upper tail test. The test statistic z is still com-
puted using equation (9.1). But, for an upper tail test, the p-value is the probability of ob-
taining a value for the test statistic as large as or larger than that provided by the sample.
Thus, to compute the p-value for the upper tail test in the σ known case, we must find
using the standard normal distribution, the probability that z is greater than or equal to the
value of the test statistic. Using the critical value approach causes us to reject the null hy-
pothesis if the value of the test statistic is greater than or equal to the critical value z
α
;in
other words, we reject H
0
if z z
α
.
H
0
:
H
a
:
μ μ
0
μ μ
0
H
0
:
H
a
:
μ μ
0
μ μ
0
9.3 Population Mean: σ Known 357
z
z = –2.33
= .01
0
Sampling distribution of
z =
x –
n/
α
µ
0
σ
FIGURE 9.3 CRITICAL VALUE 2.33 FOR THE HILLTOP COFFEE HYPOTHESIS TEST
REJECTION RULE FOR A LOWER TAIL TEST: CRITICAL VALUE APPROACH
where z
α
is the critical value; that is, the z value that provides an area of α in the
lower tail of the standard normal distribution.
Reject H
0
if z z
α
CH009.qxd 8/16/10 6:40 PM Page 357
Copyright 2010 Cengage Learning. All Rights Reserved. May not be copied, scanned, or duplicated, in whole or in part. Due to electronic rights, some third party content may be suppressed from the eBook and/or eChapter(s).
Editorial review has deemed that any suppressed content does not materially affect the overall learning experience. Cengage Learning reserves the right to remove additional content at any time if subsequent rights restrictions require it.

Let us summarize the steps involved in computing p-values for one-tailed hypothesis tests.
358 Chapter 9 Hypothesis Tests
COMPUTATION OF p-VALUES FOR ONE-TAILED TESTS
1. Compute the value of the test statistic using equation (9.1).
2. Lower tail test: Using the standard normal distribution, compute the proba-
bility that z is less than or equal to the value of the test statistic (area in the
lower tail).
3. Upper tail test: Using the standard normal distribution, compute the proba-
bility that z is greater than or equal to the value of the test statistic (area in the
upper tail).
Two-Tailed Test
In hypothesis testing, the general form for a two-tailed test about a population mean is
as follows:
In this subsection we show how to conduct a two-tailed test about a population mean for
the σ known case. As an illustration, we consider the hypothesis testing situation facing
MaxFlight, Inc.
The U.S. Golf Association (USGA) establishes rules that manufacturers of golf equipment
must meet if their products are to be acceptable for use in USGA events. MaxFlight uses a
high-technology manufacturing process to produce golf balls with a mean driving distance of
295 yards. Sometimes, however, the process gets out of adjustment and produces golf balls
with a mean driving distance different from 295 yards. When the mean distance falls below
295 yards, the company worries about losing sales because the golf balls do not provide as much
distance as advertised. When the mean distance passes 295 yards, MaxFlight’s golf balls may
be rejected by the USGA for exceeding the overall distance standard concerning carry and roll.
MaxFlight’s quality control program involves taking periodic samples of 50 golf balls
to monitor the manufacturing process. For each sample, a hypothesis test is conducted to
determine whether the process has fallen out of adjustment. Let us develop the null and
alternative hypotheses. We begin by assuming that the process is functioning correctly; that
is, the golf balls being produced have a mean distance of 295 yards. This assumption
establishes the null hypothesis. The alternative hypothesis is that the mean distance is not
equal to 295 yards. With a hypothesized value of μ
0
295, the null and alternative
hypotheses for the MaxFlight hypothesis test are as follows:
If the sample mean is significantly less than 295 yards or significantly greater than
295 yards, we will reject H
0
. In this case, corrective action will be taken to adjust the manu-
facturing process. On the other hand, if does not deviate from the hypothesized mean
μ
0
295 by a significant amount, H
0
will not be rejected and no action will be taken to
adjust the manufacturing process.
The quality control team selected α .05 as the level of significance for the test. Data
from previous tests conducted when the process was known to be in adjustment show that
x¯
x¯
H
0
:
H
a
:
μ 295
μ 295
H
0
:
H
a
:
μ μ
0
μ μ
0
CH009.qxd 8/16/10 6:40 PM Page 358
Copyright 2010 Cengage Learning. All Rights Reserved. May not be copied, scanned, or duplicated, in whole or in part. Due to electronic rights, some third party content may be suppressed from the eBook and/or eChapter(s).
Editorial review has deemed that any suppressed content does not materially affect the overall learning experience. Cengage Learning reserves the right to remove additional content at any time if subsequent rights restrictions require it.
the population standard deviation can be assumed known with a value of σ 12. Thus, with
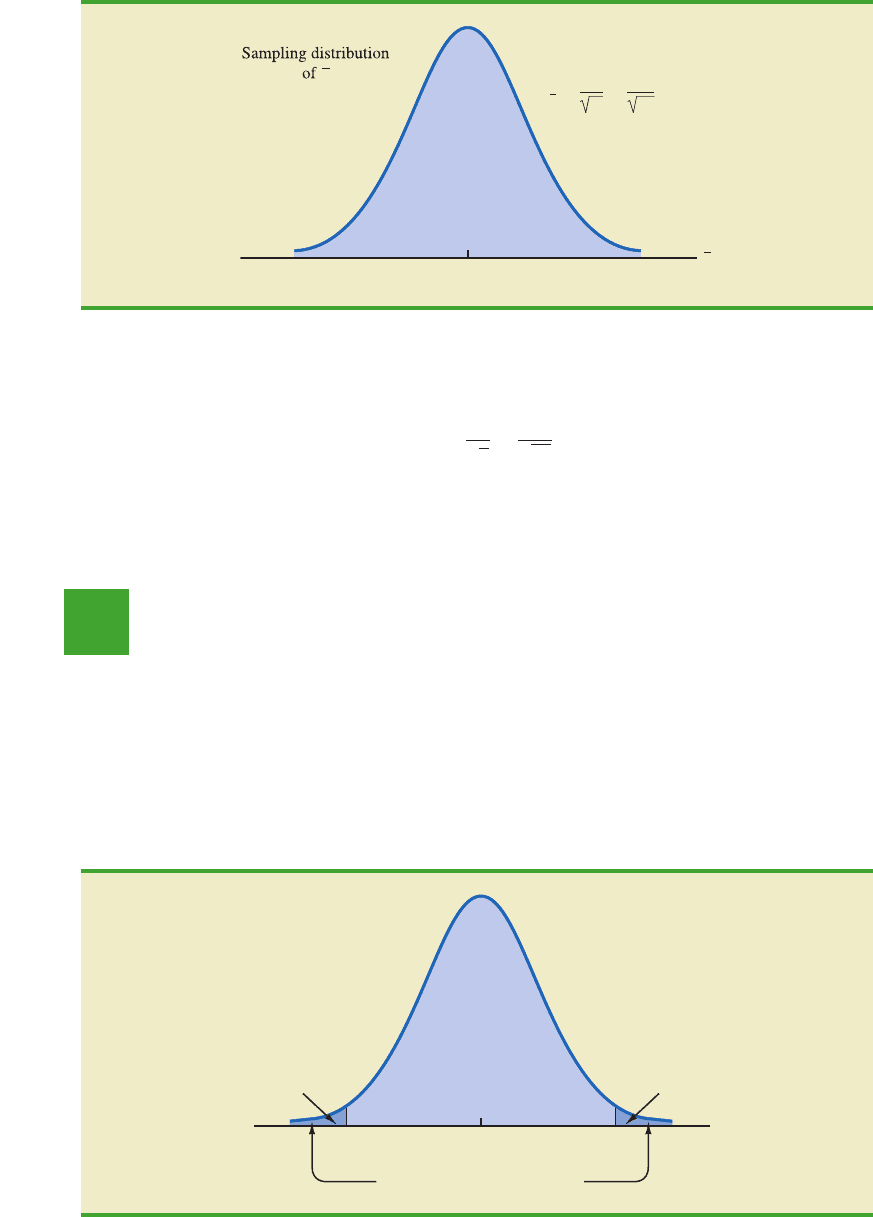
a sample size of n 50, the standard error of is
Because the sample size is large, the central limit theorem (see Chapter 7) allows us to
conclude that the sampling distribution of can be approximated by a normal distribution.
Figure 9.4 shows the sampling distribution of for the MaxFlight hypothesis test with a
hypothesized population mean of μ
0
295.
Suppose that a sample of 50 golf balls is selected and that the sample mean is
297.6 yards. This sample mean provides support for the conclusion that the population
mean is larger than 295 yards. Is this value of enough larger than 295 to cause us to reject
H
0
at the .05 level of significance? In the previous section we described two approaches that
can be used to answer this question: the p-value approach and the critical value approach.
p
-value approach Recall that the p-value is a probability used to determine whether
the null hypothesis should be rejected. For a two-tailed test, values of the test statistic in
either tail provide evidence against the null hypothesis. For a two-tailed test, the p-value is
x¯
x¯
x¯
x¯
σ
x
¯
σ
兹
n
12
兹
50
1.7
x¯
9.3 Population Mean: σ Known 359
= 295
x
μ
0
x
σ
x
=
σ
n
=
50
12
=
1.7
FIGURE 9.4 SAMPLING DISTRIBUTION OF FOR THE MAXFLIGHT HYPOTHESIS TESTx¯
file
WEB
GolfTest
1.53
P(z ≥ 1.53) = .0630
z
–1.53
P(z ≤ –1.53) = .0630
0
p-value = 2(.0630) = .1260
FIGURE 9.5 p-VALUE FOR THE MAXFLIGHT HYPOTHESIS TEST
CH009.qxd 8/16/10 6:40 PM Page 359
Copyright 2010 Cengage Learning. All Rights Reserved. May not be copied, scanned, or duplicated, in whole or in part. Due to electronic rights, some third party content may be suppressed from the eBook and/or eChapter(s).
Editorial review has deemed that any suppressed content does not materially affect the overall learning experience. Cengage Learning reserves the right to remove additional content at any time if subsequent rights restrictions require it.
the probability of obtaining a value for the test statistic as unlikely as or more unlikely than
that provided by the sample. Let us see how the p-value is computed for the MaxFlight
hypothesis test.
First we compute the value of the test statistic. For the σ known case, the test statistic z
is a standard normal random variable. Using equation (9.1) with 297.6, the value of the
test statistic is
Now to compute the p-value we must find the probability of obtaining a value for the
test statistic at least as unlikely as z 1.53. Clearly values of z 1.53 are at least as
unlikely. But, because this is a two-tailed test, values of z 1.53 are also at least as
unlikely as the value of the test statistic provided by the sample. In Figure 9.5, we see
that the two-tailed p-value in this case is given by P(z 1.53) P(z 1.53).
Because the normal curve is symmetric, we can compute this probability by finding the
upper tail area at z 1.53 and doubling it. The table for the standard normal distribu-
tion shows that p(z 1.53) is .9370. Thus, p(z 1.53) is 1.0000 .9370 .0630.
Doubling this, we find the p-value for the MaxFlight two-tailed hypothesis test is
p-value 2(.0630) .1260.
Next we compare the p-value to the level of significance to see whether the null
hypothesis should be rejected. With a level of significance of α .05, we do not reject H
0
because the p-value .1260 .05. Because the null hypothesis is not rejected, no action
will be taken to adjust the MaxFlight manufacturing process.
Let us summarize the steps involved in computing p-values for two-tailed hypothesis tests.
z
x¯ μ
0
σ兾
兹
n
297.6 295
12兾
兹
50
1.53
x¯
360 Chapter 9 Hypothesis Tests
COMPUTATION OF p-VALUES FOR TWO-TAILED TESTS
1. Compute the value of the test statistic using equation (9.1).
2. If the value of the test statistic is in the upper tail, compute the probability that
z is greater than or equal to the value of the test statistic (the upper tail area).
If the value of the test statistic is in the lower tail, compute the probability that
z is less than or equal to the value of the test statistic (the lower tail area).
3. Double the probability (or tail area) from step 2 to obtain the p-value.
1.96
Area = .025
z
–1.96
Area = .025
0
Reject H
0
Reject H
0
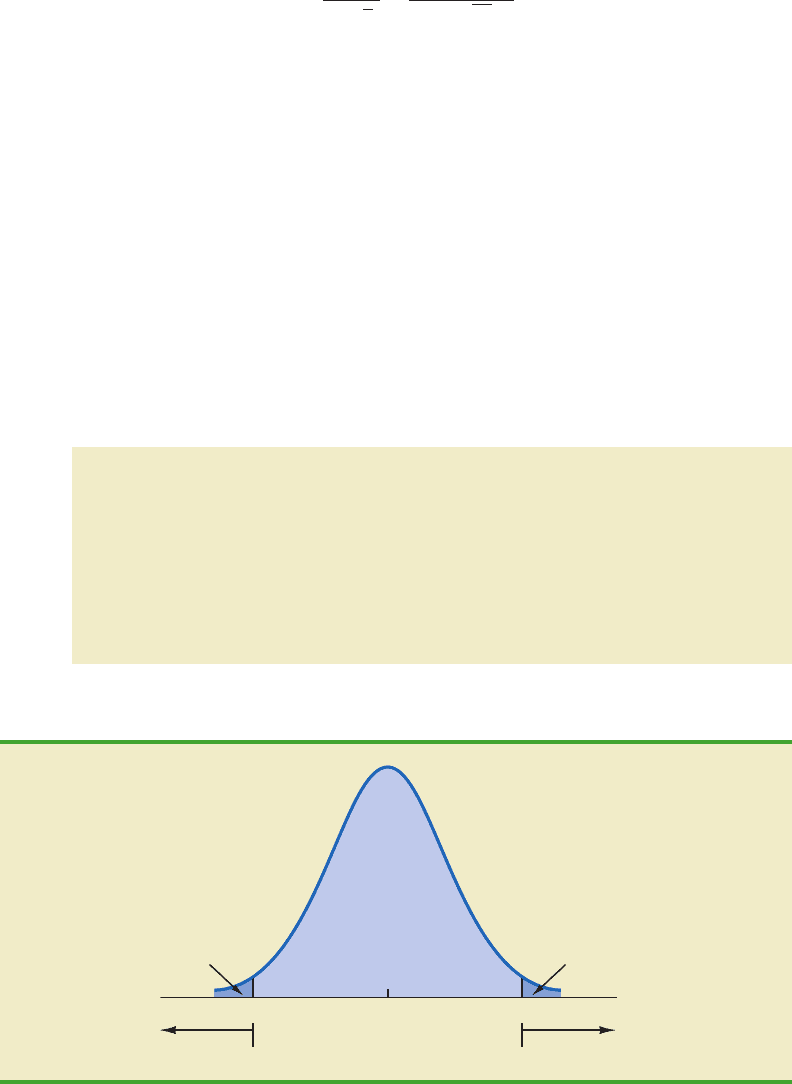
FIGURE 9.6 CRITICAL VALUES FOR THE MAXFLIGHT HYPOTHESIS TEST
CH009.qxd 8/16/10 6:40 PM Page 360
Copyright 2010 Cengage Learning. All Rights Reserved. May not be copied, scanned, or duplicated, in whole or in part. Due to electronic rights, some third party content may be suppressed from the eBook and/or eChapter(s).
Editorial review has deemed that any suppressed content does not materially affect the overall learning experience. Cengage Learning reserves the right to remove additional content at any time if subsequent rights restrictions require it.

9.3 Population Mean: σ Known 361
Lower Tail Test Upper Tail Test Two-Tailed Test
Hypotheses
Test Statistic
Rejection Rule: Reject H
0
if Reject H
0
if Reject H
0
if
p-Value Approach p-value α p-value α p-value α
Rejection Rule: Reject H
0
if Reject H
0
if Reject H
0
if
Critical Value z z
α
z z
α
z z
α/2
Approach or if z z
α/2
z
x¯ μ
0
σ兾
兹
n
z
x¯ μ
0
σ兾
兹
n
z
x¯ μ
0
σ兾
兹
n
H
0
:
H
a
:
μ μ
0
μ μ
0
H
0
:
H
a
:
μ μ
0
μ μ
0
H
0
:
H
a
:
μ μ
0
μ μ
0
TABLE 9.2 SUMMARY OF HYPOTHESIS TESTS ABOUTA POPULATION MEAN:
σ KNOWN CASE
STEPS OF HYPOTHESIS TESTING
Step 1. Develop the null and alternative hypotheses.
Step 2. Specify the level of significance.
Step 3. Collect the sample data and compute the value of the test statistic.
p-Value Approach
Step 4. Use the value of the test statistic to compute the p-value.
Step 5. Reject H
0
if the p-value α.
Critical Value Approach
Step 4. Use the level of significance to determine the critical value and the
rejection rule.
Step 5. Use the value of the test statistic and the rejection rule to determine
whether to reject H
0
.
Critical value approach Before leaving this section, let us see how the test statistic zcan
be compared to a critical value to make the hypothesis testing decision for a two-tailed test.
Figure 9.6 shows that the critical values for the test will occur in both the lower and upper
tails of the standard normal distribution. With a level of significance of α .05, the area in
each tail corresponding to the critical values is α/2 .05/2 .025. Using the standard nor-
mal probability table, we find the critical values for the test statistic are z
.025
1.96 and
z
.025
1.96. Thus, using the critical value approach, the two-tailed rejection rule is
Because the value of the test statistic for the MaxFlight study is z 1.53, the statistical
evidence will not permit us to reject the null hypothesis at the .05 level of significance.
Summary and Practical Advice
We presented examples of a lower tail test and a two-tailed test about a population mean.
Based upon these examples, we can now summarize the hypothesis testing procedures
about a population mean for the σ known case as shown in Table 9.2. Note that μ
0
is the
hypothesized value of the population mean.
The hypothesis testing steps followed in the two examples presented in this section are
common to every hypothesis test.
Reject H
0
if z 1.96 or if z 1.96
CH009.qxd 8/16/10 6:40 PM Page 361
Copyright 2010 Cengage Learning. All Rights Reserved. May not be copied, scanned, or duplicated, in whole or in part. Due to electronic rights, some third party content may be suppressed from the eBook and/or eChapter(s).
Editorial review has deemed that any suppressed content does not materially affect the overall learning experience. Cengage Learning reserves the right to remove additional content at any time if subsequent rights restrictions require it.

Practical advice about the sample size for hypothesis tests is similar to the advice we pro-
vided about the sample size for interval estimation in Chapter 8. In most applications, a sam-
ple size of n 30 is adequate when using the hypothesis testing procedure described in this
section. In cases where the sample size is less than 30, the distribution of the population from
which we are sampling becomes an important consideration. If the population is normally
distributed, the hypothesis testing procedure that we described is exact and can be used for
any sample size. If the population is not normally distributed but is at least roughly sym-
metric, sample sizes as small as 15 can be expected to provide acceptable results.
Relationship Between Interval Estimation
and Hypothesis Testing
In Chapter 8 we showed how to develop a confidence interval estimate of a population
mean. For the σ known case, the (1 α)% confidence interval estimate of a population
mean is given by
In this section, we showed that a two-tailed hypothesis test about a population mean
takes the following form:
where μ
0
is the hypothesized value for the population mean.
Suppose that we follow the procedure described in Chapter 8 for constructing a
100(1 α)% confidence interval for the population mean.We know that 100(1 α)% of
the confidence intervals generated will contain the population mean and 100α% of the con-
fidence intervals generated will not contain the population mean. Thus, if we reject H
0
when-
ever the confidence interval does not contain μ
0
, we will be rejecting the null hypothesis
when it is true (μ μ
0
) with probability α. Recall that the level of significance is the prob-
ability of rejecting the null hypothesis when it is true. So constructing a 100(1 α)% con-
fidence interval and rejecting H
0
whenever the interval does not contain μ
0
is equivalent to
conducting a two-tailed hypothesis test with α as the level of significance. The procedure for
using a confidence interval to conduct a two-tailed hypothesis test can now be summarized.
H
0
:
H
a
:
μ μ
0
μ μ
0
x¯
z
α/2
σ
兹
n
362 Chapter 9 Hypothesis Tests
A CONFIDENCE INTERVALAPPROACH TO TESTING A HYPOTHESIS
OF THE FORM
1. Select a simple random sample from the population and use the value of the
sample mean to develop the confidence interval for the population mean μ.
2. If the confidence interval contains the hypothesized value μ
0
, do not reject H
0
.
Otherwise, reject
2
H
0
.
x¯
z
α/2
σ
兹
n
x¯
H
0
:
H
a
:
μ μ
0
μ μ
0
For a two-tailed hypothesis
test, the null hypothesis can
be rejected if the confidence
interval does not include μ
0
.
2
To be consistent with the rule for rejecting H
0
when the p-value α, we would also reject H
0
using the confidence interval
approach if μ
0
happens to be equal to one of the end points of the 100(1 α)% confidence interval.
CH009.qxd 8/16/10 6:40 PM Page 362
Copyright 2010 Cengage Learning. All Rights Reserved. May not be copied, scanned, or duplicated, in whole or in part. Due to electronic rights, some third party content may be suppressed from the eBook and/or eChapter(s).
Editorial review has deemed that any suppressed content does not materially affect the overall learning experience. Cengage Learning reserves the right to remove additional content at any time if subsequent rights restrictions require it.

Let us illustrate by conducting the MaxFlight hypothesis test using the confidence
interval approach. The MaxFlight hypothesis test takes the following form:
To test these hypotheses with a level of significance of α .05, we sampled 50 golf balls
and found a sample mean distance of 297.6 yards. Recall that the population standard
deviation is σ 12. Using these results with z
.025
1.96, we find that the 95% confidence
interval estimate of the population mean is
or
This finding enables the quality control manager to conclude with 95% confidence that
the mean distance for the population of golf balls is between 294.3 and 300.9 yards.
Because the hypothesized value for the population mean, μ
0
295, is in this interval, the
hypothesis testing conclusion is that the null hypothesis, H
0
: μ 295, cannot be rejected.
Note that this discussion and example pertain to two-tailed hypothesis tests about a
population mean. However, the same confidence interval and two-tailed hypothesis testing
relationship exists for other population parameters. The relationship can also be extended
to one-tailed tests about population parameters. Doing so, however, requires the develop-
ment of one-sided confidence intervals, which are rarely used in practice.
294.3 to 300.9
297.6
3.3
297.6
1.96
12
兹
50
x¯
z
.025
σ
兹
n
x¯
H
0
:
H
a
:
μ 295
μ 295
Exercises
Note to Student: Some of the exercises that follow ask you to use the p-value approach
and others ask you to use the critical value approach. Both methods will provide the same
hypothesis testing conclusion. We provide exercises with both methods to give you prac-
tice using both. In later sections and in following chapters, we will generally emphasize
the p-value approach as the preferred method, but you may select either based on personal
preference.
9.3 Population Mean: σ Known 363
NOTES AND COMMENTS
We have shown how to use p-values. The smaller
the p-value the greater the evidence against H
0
and
the more the evidence in favor of H
a
. Here are some
guidelines statisticians suggest for interpreting
small p-values.
• Less than .01—Overwhelming evidence to
conclude H
a
is true.
• Between .01 and .05—Strong evidence to
conclude H
a
is true.
• Between .05 and .10—Weak evidence to
conclude H
a
is true.
• Greater than .10—Insufficient evidence to
conclude H
a
is true.
CH009.qxd 8/16/10 6:40 PM Page 363
Copyright 2010 Cengage Learning. All Rights Reserved. May not be copied, scanned, or duplicated, in whole or in part. Due to electronic rights, some third party content may be suppressed from the eBook and/or eChapter(s).
Editorial review has deemed that any suppressed content does not materially affect the overall learning experience. Cengage Learning reserves the right to remove additional content at any time if subsequent rights restrictions require it.

Methods
9. Consider the following hypothesis test:
A sample of 50 provided a sample mean of 19.4. The population standard deviation is 2.
a. Compute the value of the test statistic.
b. What is the p-value?
c. Using α .05, what is your conclusion?
d. What is the rejection rule using the critical value? What is your conclusion?
10. Consider the following hypothesis test:
A sample of 40 provided a sample mean of 26.4. The population standard deviation is 6.
a. Compute the value of the test statistic.
b. What is the p-value?
c. At α .01, what is your conclusion?
d. What is the rejection rule using the critical value? What is your conclusion?
11. Consider the following hypothesis test:
A sample of 50 provided a sample mean of 14.15. The population standard deviation is 3.
a. Compute the value of the test statistic.
b. What is the p-value?
c. At α .05, what is your conclusion?
d. What is the rejection rule using the critical value? What is your conclusion?
12. Consider the following hypothesis test:
Asample of 100 is used and the population standard deviation is 12. Compute the p-value
and state your conclusion for each of the following sample results. Use α .01.
a. 78.5
b. 77
c. 75.5
d. 81
13. Consider the following hypothesis test:
A sample of 60 is used and the population standard deviation is 8. Use the critical value
approach to state your conclusion for each of the following sample results. Use
α .05.
a. 52.5
b. 51
c. 51.8x¯
x¯
x¯
H
0
:
H
a
:
μ 50
μ 50
x¯
x¯
x¯
x¯
H
0
:
H
a
:
μ 80
μ 80
H
0
:
H
a
:
μ 15
μ 15
H
0
:
H
a
:
μ 25
μ 25
H
0
:
H
a
:
μ 20
μ 20
364 Chapter 9 Hypothesis Tests
test
SELF
test
SELF
CH009.qxd 8/16/10 6:40 PM Page 364
Copyright 2010 Cengage Learning. All Rights Reserved. May not be copied, scanned, or duplicated, in whole or in part. Due to electronic rights, some third party content may be suppressed from the eBook and/or eChapter(s).
Editorial review has deemed that any suppressed content does not materially affect the overall learning experience. Cengage Learning reserves the right to remove additional content at any time if subsequent rights restrictions require it.