Anderson D.R., Sweeney D.J., Williams T.A. Essentials of Statistics for Business and Economics
Подождите немного. Документ загружается.

10.1 Inferences About the Difference Between Two Population Means: σ
1
and σ
2
Known 395
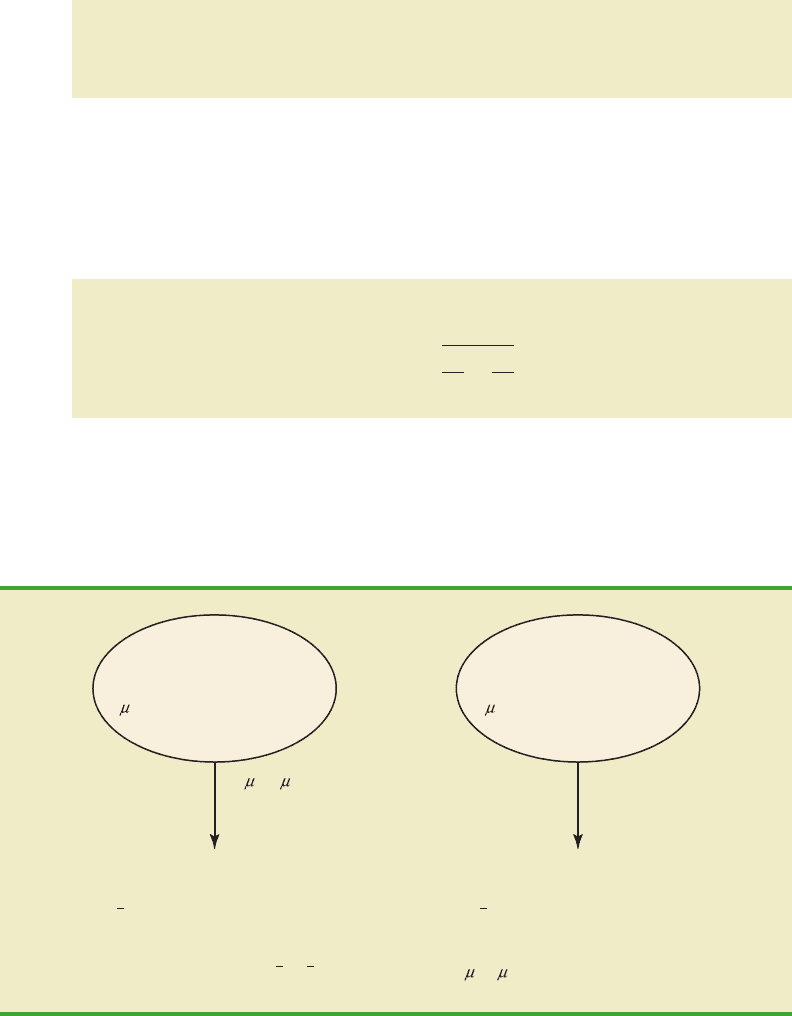
Figure 10.1 provides an overview of the process used to estimate the difference between
two population means based on two independent random samples.
As with other point estimators, the point estimator
1
2
has a standard error that
describes the variation in the sampling distribution of the estimator. With two independent
random samples, the standard error of
1
2
is as follows.x¯x¯
x¯x¯
Population 1
Inner-City Store Customers
1
= mean age of inner-city
store customers
Population 2
Suburban Store Customers
2
= mean age of suburban
store customers
1
–
2
= difference between the mean ages
x
1
– x
2
= Point estimator of
1
–
2
Two Independent Simple Random Samples
Random sample of
n
1
inner-city customers
x
1
= sample mean age for the
inner-city store customers
Random sample of
n
2
suburban customers
x
2
= sample mean age for the
suburban store customers
POINT ESTIMATOR OF THE DIFFERENCE BETWEEN TWO POPULATION MEANS
(10.1)
x¯
1
x¯
2
STANDARD ERROR OF
(10.2)
σ
x¯
1
x¯
2
冑
σ
2
1
n
1
σ
2
2
n
2
¯x
1
¯x
2
FIGURE 10.1 ESTIMATING THE DIFFERENCE BETWEEN TWO POPULATION MEANS
The standard error of
1
2
is the standard
deviation of the sampling
distribution of
1
2
.x¯x¯
x¯x¯
To estimate μ
1
μ
2
, we will select a random sample of n
1
customers from population
1 and a sample of n
2
customers from population 2. We then compute the two sample means.
The point estimator of the difference between the two population means is the difference
between the two sample means.
x¯
1
x¯
2
sample mean age for the random sample of n
1
inner-city customers
sample mean age for the random sample of n
2
suburban customers
If both populations have a normal distribution, or if the sample sizes are large enough that
the central limit theorem enables us to conclude that the sampling distributions of
1
and
2
can be approximated by a normal distribution, the sampling distribution of
1
2
will
have a normal distribution with mean given by μ
1
μ
2
.
x¯x¯x¯
x¯
CH010.qxd 8/16/10 7:49 PM Page 395
Copyright 2010 Cengage Learning. All Rights Reserved. May not be copied, scanned, or duplicated, in whole or in part. Due to electronic rights, some third party content may be suppressed from the eBook and/or eChapter(s).
Editorial review has deemed that any suppressed content does not materially affect the overall learning experience. Cengage Learning reserves the right to remove additional content at any time if subsequent rights restrictions require it.

396 Chapter 10 Comparisons Involving Means, Experimental Design, and Analysis of Variance
As we showed in Chapter 8, an interval estimate is given by a point estimate a mar-
gin of error. In the case of estimation of the difference between two population means, an
interval estimate will take the following form:
With the sampling distribution of
1
2
having a normal distribution, we can write the
margin of error as follows:
(10.3)
Thus the interval estimate of the difference between two population means is as follows.
Margin of error z
α/2
σ
x¯
1
x¯
2
z
α/2
冑
σ
2
1
n
1
σ
2
2
n
2
x¯x¯
x¯
1
x¯
2
Margin of error
Let us return to the Greystone example. Based on data from previous customer demo-
graphic studies, the two population standard deviations are known with σ
1
9 years and
σ
2
10 years. The data collected from the two independent random samples of Greystone
customers provided the following results:
Using expression (10.1), we find that the point estimate of the difference between the
mean ages of the two populations is
1
2
40 35 5 years. Thus, we estimate that
the customers at the inner-city store have a mean age five years greater than the mean age of
the suburban store customers. We can now use expression (10.4) to compute the margin
of error and provide the interval estimate of μ
1
μ
2
. Using 95% confidence and
z
α/2
z
.025
1.96, we have
Thus, the margin of error is 4.06 years and the 95% confidence interval estimate of the
difference between the two population means is 5 4.06 .94 years to 5 4.06
9.06 years.
5
4.06
40 35
1.96
冑
9
2
36
10
2
49
x¯
1
x¯
2
z
α/2
冑
σ
2
1
n
1
σ
2
2
n
2
x¯x¯
The margin of error is
given by multiplying the
standard error by z
α/2
.
INTERVAL ESTIMATE OF THE DIFFERENCE BETWEEN TWO POPULATION
MEANS: σ
1
AND σ
2
KNOWN
(10.4)
where 1 α is the confidence coefficient.
x¯
1
x¯
2
z
α/2
冑
σ
2
1
n
1
σ
2
2
n
2
Inner-City Store Suburban Store
Sample Size
Sample Mean x¯
2
35 yearsx¯
1
40 years
n
2
49n
1
36
CH010.qxd 8/16/10 7:49 PM Page 396
Copyright 2010 Cengage Learning. All Rights Reserved. May not be copied, scanned, or duplicated, in whole or in part. Due to electronic rights, some third party content may be suppressed from the eBook and/or eChapter(s).
Editorial review has deemed that any suppressed content does not materially affect the overall learning experience. Cengage Learning reserves the right to remove additional content at any time if subsequent rights restrictions require it.

10.1 Inferences About the Difference Between Two Population Means: σ
1
and σ
2
Known 397
Hypothesis Tests About μ
1
ⴚ μ
2
Let us consider hypothesis tests about the difference between two population means. Using
D
0
to denote the hypothesized difference between μ
1
and μ
2
, the three forms for a hypothe-
sis test are as follows:
In many applications, D
0
0. Using the two-tailed test as an example, when D
0
0 the
null hypothesis is H
0
: μ
1
μ
2
0. In this case, the null hypothesis is that μ
1
and μ
2
are
equal. Rejection of H
0
leads to the conclusion that H
a
: μ
1
μ
2
0 is true; that is, μ
1
and
μ
2
are not equal.
The steps for conducting hypothesis tests presented in Chapter 9 are applicable here.
We must choose a level of significance, compute the value of the test statistic, and find the
p-value to determine whether the null hypothesis should be rejected. With two independent
random samples, we showed that the point estimator
1
2
has a standard error
given by expression (10.2) and, when the sample sizes are large enough, the distribution of
1
2
can be described by a normal distribution. In this case, the test statistic for the
difference between two population means when σ
1
and σ
2
are known is as follows.
x¯x¯
σ
x
¯
1
x
¯
2
x¯x¯
H
0
:
H
a
:
μ
1
μ
2
D
0
μ
1
μ
2
D
0
H
0
:
H
a
:
μ
1
μ
2
D
0
μ
1
μ
2
D
0
H
0
:
H
a
:
μ
1
μ
2
D
0
μ
1
μ
2
D
0
Let us demonstrate the use of this test statistic in the following hypothesis testing example.
As part of a study to evaluate differences in education quality between two training cen-
ters, a standardized examination is given to individuals who are trained at the centers. The
difference between the mean examination scores is used to assess quality differences
between the centers. The population means for the two centers are as follows.
We begin with the tentative assumption that no difference exists between the training
quality provided at the two centers. Hence, in terms of the mean examination scores, the
null hypothesis is that μ
1
μ
2
0. If sample evidence leads to the rejection of this hy-
pothesis, we will conclude that the mean examination scores differ for the two populations.
This conclusion indicates a quality differential between the two centers and suggests that a
follow-up study investigating the reason for the differential may be warranted. The null and
alternative hypotheses for this two-tailed test are written as follows:
H
0
:
H
a
:
μ
1
μ
2
0
μ
1
μ
2
0
μ
2
the mean examination score for the population
of individuals trained at center B
μ
1
the mean examination score for the population
of individuals trained at center A
TEST STATISTIC FOR HYPOTHESIS TESTS ABOUT μ
1
μ
2
: σ
1
AND σ
2
KNOWN
(10.5)z
(x¯
1
x¯
2
) D
0
冑
σ
2
1
n
1
σ
2
2
n
2
CH010.qxd 8/16/10 7:49 PM Page 397
Copyright 2010 Cengage Learning. All Rights Reserved. May not be copied, scanned, or duplicated, in whole or in part. Due to electronic rights, some third party content may be suppressed from the eBook and/or eChapter(s).
Editorial review has deemed that any suppressed content does not materially affect the overall learning experience. Cengage Learning reserves the right to remove additional content at any time if subsequent rights restrictions require it.

The standardized examination given previously in a variety of settings always resulted in
an examination score standard deviation near 10 points. Thus, we will use this information
to assume that the population standard deviations are known with σ
1
10 and σ
2
10. An
α .05 level of significance is specified for the study.
Independent random samples of n
1
30 individuals from training center Aand n
2
40
individuals from training center B are taken. The respective sample means are
1
82 and
2
78. Do these data suggest a significant difference between the population
means at the two training centers? To help answer this question, we compute the test sta-
tistic using equation (10.5).
Next let us compute the p-value for this two-tailed test. Because the test statistic z is in the
upper tail, we first compute P(z 1.66). Using the standard normal distribution table, the area
to the left of z 1.66 is .9515. Thus, the area in the upper tail of the distribution is
1.0000 .9515 .0485. Because this test is a two-tailed test, we must double the tail area:
p-value 2(.0485) .0970. Following the usual rule to reject H
0
if p-value α, we see that
the p-value of .0970 does not allow us to reject H
0
at the .05 level of significance. The sample
results do not provide sufficient evidence to conclude the training centers differ in quality.
In this chapter we will use the p-value approach to hypothesis testing as described in
Chapter 9. However, if you prefer, the test statistic and the critical value rejection rule may
be used. With α .05 and z
α/2
z
.025
1.96, the rejection rule employing the critical value
approach would be “reject H
0
if z 1.96 or if z 1.96.” With z 1.66, we reach the
same “do not reject H
0
” conclusion.
In the preceding example, we demonstrated a two-tailed hypothesis test about the dif-
ference between two population means. Lower tail and upper tail tests can also be consid-
ered. These tests use the same test statistic as given in equation (10.5). The procedure for
computing the p-value and the rejection rules for these one-tailed tests is the same as those
presented in Chapter 9.
Practical Advice
In most applications of the interval estimation and hypothesis testing procedures presented
in this section, random samples with n
1
30 and n
2
30 are adequate. In cases where ei-
ther or both sample sizes are less than 30, the distributions of the populations become im-
portant considerations. In general, with smaller sample sizes, it is more important for the
analyst to be satisfied that it is reasonable to assume that the distributions of the two popu-
lations are at least approximately normal.
Exercises
Methods
1. The following resultscome from two independent random samplestaken of two populations.
z
(x¯
1
x¯
2
) D
0
冑
σ
2
1
n
1
σ
2
2
n
2
(82 78) 0
冑
10
2
30
10
2
40
1.66
x¯x¯
398 Chapter 10 Comparisons Involving Means, Experimental Design, and Analysis of Variance
test
SELF
Sample 1 Sample 2
σ
2
3.0 σ
1
2.2
x¯
2
11.6x¯
1
13.6
n
2
35 n
1
50
file
WEB
ExamScores
CH010.qxd 8/16/10 7:49 PM Page 398
Copyright 2010 Cengage Learning. All Rights Reserved. May not be copied, scanned, or duplicated, in whole or in part. Due to electronic rights, some third party content may be suppressed from the eBook and/or eChapter(s).
Editorial review has deemed that any suppressed content does not materially affect the overall learning experience. Cengage Learning reserves the right to remove additional content at any time if subsequent rights restrictions require it.

10.1 Inferences About the Difference Between Two Population Means: σ
1
and σ
2
Known 399
a. What is the point estimate of the difference between the two population means?
b. Provide a 90% confidence interval for the difference between the two population means.
c. Provide a 95% confidence interval for the difference between the two population means.
2. Consider the following hypothesis test.
The following results are for two independent random samples taken from the two populations.
H
0
:
H
a
:
μ
1
μ
2
0
μ
1
μ
2
0
test
SELF
test
SELF
a. What is the value of the test statistic?
b. What is the p-value?
c. With α .05, what is your hypothesis testing conclusion?
3. Consider the following hypothesis test.
The following results are for two independent samples taken from the two populations.
H
0
:
H
a
:
μ
1
μ
2
0
μ
1
μ
2
0
a. What is the value of the test statistic?
b. What is the p-value?
c. With α .05, what is your hypothesis testing conclusion?
Applications
4. Condé Nast Traveler conducts an annual survey in which readers rate their favorite cruise ship.
All ships are rated on a 100-point scale, with higher values indicating better service. Asample of
37 ships that carry fewer than 500 passengers resulted in an average rating of 85.36, and a sam-
ple of 44 ships that carry 500 or more passengers provided an average rating of 81.40 (Condé
Nast Traveler, February 2008). Assume that the population standard deviation is 4.55 for ships
that carry fewer than 500 passengers and 3.97 for ships that carry 500 or more passengers.
a. What is the point estimate of the difference between the population mean rating for
ships that carry fewer than 500 passengers and the population mean rating for ships
that carry 500 or more passengers?
b. At 95% confidence, what is the margin of error?
c. What is a 95% confidence interval estimate of the difference between the population
mean ratings for the two sizes of ships?
5. The average expenditure on Valentine’s Day was expected to be $100.89 (USA Today,
February 13, 2006). Do male and female consumers differ in the amounts they spend?
The average expenditure in a sample survey of 40 male consumers was $135.67, and the
average expenditure in a sample survey of 30 female consumers was $68.64. Based on past
Sample 1 Sample 2
σ
2
6.0 σ
1
5.2
x¯
2
22.8x¯
1
25.2
n
2
50 n
1
40
Sample 1 Sample 2
n
1
80 n
2
70
104 106
σ
1
8.4 σ
2
7.6
x¯
2
x¯
1
CH010.qxd 8/16/10 7:49 PM Page 399
Copyright 2010 Cengage Learning. All Rights Reserved. May not be copied, scanned, or duplicated, in whole or in part. Due to electronic rights, some third party content may be suppressed from the eBook and/or eChapter(s).
Editorial review has deemed that any suppressed content does not materially affect the overall learning experience. Cengage Learning reserves the right to remove additional content at any time if subsequent rights restrictions require it.

400 Chapter 10 Comparisons Involving Means, Experimental Design, and Analysis of Variance
surveys, the standard deviation for male consumers is assumed to be $35, and the standard
deviation for female consumers is assumed to be $20.
a. What is the point estimate of the difference between the population mean expenditure
for males and the population mean expenditure for females?
b. At 99% confidence, what is the margin of error?
c. Develop a 99% confidence interval for the difference between the two population means.
6. Suppose that you are responsible for making arrangements for a business convention. Be-
cause of budget cuts due to the recent recession, you have been charged with choosing a
city for the convention that has the least expensive hotel rooms. You have narrowed your
choices to Atlanta and Houston. The file named Hotel contains samples of prices for rooms
in Atlanta and Houston that are consistent with the results reported by Smith Travel Re-
search (SmartMoney, March 2009). Because considerable historical data on the prices of
rooms in both cities are available, the population standard deviations for the prices can be
assumed to be $20 in Atlanta and $25 in Houston. Based on the sample data, can you con-
clude that the mean price of a hotel room in Atlanta is lower than one in Houston?
7. During the 2003 season, Major League Baseball took steps to speed up the play of base-
ball games in order to maintain fan interest (CNN Headline News, September 30, 2003).
The following results come from a sample of 60 games played during the summer of 2002
and a sample of 50 games played during the summer of 2003. The sample mean shows the
mean duration of the games included in each sample.
a. A research hypothesis was that the steps taken during the 2003 season would reduce
the population mean duration of baseball games. Formulate the null and alternative
hypotheses.
b. What is the point estimate of the reduction in the mean duration of games during the
2003 season?
c. Historical data indicate a population standard deviation of 12 minutes is a reasonable
assumption for both years. Conduct the hypothesis test and report the p-value. At a .05
level of significance, what is your conclusion?
d. Provide a 95% confidence interval estimate of the reduction in the mean duration of
games during the 2003 season.
e. What was the percentage reduction in the mean time of baseball games during the 2003
season? Should management be pleased with the results of the statistical analysis? Dis-
cuss.Shouldthelengthofbaseballgamescontinuetobeanissueinfutureyears? Explain.
8. Will improving customer service result in higher stock prices for the companies providing
the better service? “When a company’s satisfaction score has improved over the prior year’s
results and is above the national average (currently 75.7), studies show its shares have a good
chance of outperforming the broad stock market in the long run” (BusinessWeek, March 2,
2009). The following satisfaction scores of three companies for the 4th quarters of 2007 and
2008 were obtained from the American Customer Satisfaction Index. Assume that the scores
are based on a poll of 60 customers from each company. Because the polling has been done
for several years, the standard deviation can be assumed to equal 6 points in each case.
Company 2007 Score 2008 Score
Rite Aid 73 76
Expedia 75 77
J.C. Penney 77 78
2002 Season 2003 Season
n
1
60 n
2
50
2 hours, 52 minutes 2 hours, 46 minutesx¯
2
x¯
1
file
WEB
Hotel
CH010.qxd 8/16/10 7:49 PM Page 400
Copyright 2010 Cengage Learning. All Rights Reserved. May not be copied, scanned, or duplicated, in whole or in part. Due to electronic rights, some third party content may be suppressed from the eBook and/or eChapter(s).
Editorial review has deemed that any suppressed content does not materially affect the overall learning experience. Cengage Learning reserves the right to remove additional content at any time if subsequent rights restrictions require it.

a. For Rite Aid, is the increase in the satisfaction score from 2007 to 2008 statistically
significant? Use
α .05. What can you conclude?
b. Can you conclude that the 2008 score for Rite Aid is above the national average of
75.7? Use
α .05.
c. For Expedia, is the increase from 2007 to 2008 statistically significant? Use
α .05.
d. When conducting a hypothesis test with the values given for the standard deviation,
sample size, and
α, how large must the increase from 2007 to 2008 be for it to be sta-
tistically significant?
e. Use the result of part (d) to state whether the increase for J.C. Penney from 2007 to
2008 is statistically significant.
10.2 Inferences About the Difference Between Two
Population Means: σ
1
and σ
2
Unknown
In this section we extend the discussion of inferences about the difference between two
population means to the case when the two population standard deviations, σ
1
and σ
2
, are
unknown. In this case, we will use the sample standard deviations, s
1
and s
2
, to estimate the
unknown population standard deviations. When we use the sample standard deviations, the
interval estimation and hypothesis testing procedures will be based on the t distribution
rather than the standard normal distribution.
Interval Estimation of μ
1
ⴚ μ
2
In the following example we show how to compute a margin of error and develop an inter-
val estimate of the difference between two population means when σ
1
and σ
2
are unknown.
Clearwater National Bank is conducting a study designed to identify differences between
checking account practices by customers at two of its branch banks. Asample of 28 check-
ing accounts is selected from the Cherry Grove Branch and an independent sample of 22
checking accounts is selected from the Beechmont Branch. The current checking account
balance is recorded for each of the checking accounts. A summary of the account balances
follows:
Cherry Grove Beechmont
Sample Size n
1
28 n
2
22
Sample Mean $1025 $910
Sample Standard Deviation s
1
$150 s
2
$125
file
W
EB
CheckAcct
Clearwater National Bank would like to estimate the difference between the mean
checking account balance maintained by the population of Cherry Grove customers and the
population of Beechmont customers. Let us develop the margin of error and an interval es-
timate of the difference between these two population means.
In Section 10.1, we provided the following interval estimate for the case when the
population standard deviations, σ
1
and σ
2
, are known.
x¯
1
x¯
2
z
α/2
冑
σ
2
1
n
1
σ
2
2
n
2
10.2 Inferences About the Difference Between Two Population Means: σ
1
and σ
2
Unknown 401
x¯
1
x¯
2
CH010.qxd 8/16/10 7:49 PM Page 401
Copyright 2010 Cengage Learning. All Rights Reserved. May not be copied, scanned, or duplicated, in whole or in part. Due to electronic rights, some third party content may be suppressed from the eBook and/or eChapter(s).
Editorial review has deemed that any suppressed content does not materially affect the overall learning experience. Cengage Learning reserves the right to remove additional content at any time if subsequent rights restrictions require it.

In this expression, the use of the t distribution is an approximation, but it provides excellent
results and is relatively easy to use. The only difficulty that we encounter in using expression
(10.6) is determining the appropriate degrees of freedom for t
α/2
. Statistical software packages
compute the appropriate degrees of freedom automatically. The formula used is as follows.
Let us return to the Clearwater National Bank example and show how to use expression
(10.6) to provide a 95% confidence interval estimate of the difference between the population
mean checking account balances at the two branch banks.The sample data show n
1
28,
1
$1025, and s
1
$150 for the Cherry Grove branch, and n
2
22,
2
$910, and s
2
$125
for the Beechmont branch. The calculation for degrees of freedom for t
α/2
is as follows:
We round the noninteger degrees of freedom down to 47 to provide a larger t value and a
more conservative interval estimate. Using the t distribution table with 47 degrees of free-
dom, we find t
.025
2.012. Using expression (10.6), we develop the 95% confidence in-
terval estimate of the difference between the two population means as follows.
The point estimate of the difference between the population mean checking account balances
at the two branches is $115. The margin of error is $78, and the 95% confidence interval
115
78
1025 910
2.012
冑
150
2
28
125
2
22
x¯
1
x¯
2
t
.025
冑
s
2
1
n
1
s
2
2
n
2
df
冢
s
2
1
n
1
s
2
2
n
2
冣
2
1
n
1
1
冢
s
2
1
n
1
冣
2
1
n
2
1
冢
s
2
2
n
2
冣
2
冢
150
2
28
125
2
22
冣
2
1
28 1
冢
150
2
28
冣
2
1
22 1
冢
125
2
22
冣
2
47.8
x¯
x¯
402 Chapter 10 Comparisons Involving Means, Experimental Design, and Analysis of Variance
When σ
1
and σ
2
are
estimated by s
1
and s
2
, the
t distribution is used to
make inferences about the
difference between two
population means.
INTERVAL ESTIMATE OF THE DIFFERENCE BETWEEN TWO POPULATION
MEANS: σ
1
AND σ
2
UNKNOWN
(10.6)
where 1 α is the confidence coefficient.
x¯
1
x¯
2
t
α/2
冑
s
2
1
n
1
s
2
2
n
2
DEGREES OF FREEDOM: t DISTRIBUTION WITH TWO INDEPENDENT RANDOM
SAMPLES
(10.7)
df
冢
s
2
1
n
1
s
2
2
n
2
冣
2
1
n
1
1
冢
s
2
1
n
1
冣
2
1
n
2
1
冢
s
2
2
n
2
冣
2
With σ
1
and σ
2
unknown, we will use the sample standard deviations s
1
and s
2
to estimate
σ
1
and σ
2
and replace z
α/2
with t
α/2
. As a result, the interval estimate of the difference be-
tween two population means is given by the following expression.
CH010.qxd 8/16/10 7:49 PM Page 402
Copyright 2010 Cengage Learning. All Rights Reserved. May not be copied, scanned, or duplicated, in whole or in part. Due to electronic rights, some third party content may be suppressed from the eBook and/or eChapter(s).
Editorial review has deemed that any suppressed content does not materially affect the overall learning experience. Cengage Learning reserves the right to remove additional content at any time if subsequent rights restrictions require it.

Let us demonstrate the use of this test statistic in the following hypothesis testing example.
Consider a new computer software package developed to help systems analysts reduce
the time required to design, develop, and implement an information system. To evaluate the
benefits of the new software package, a random sample of 24 systems analysts is selected.
Each analyst is given specifications for a hypothetical information system. Then 12 of the
analysts are instructed to produce the information system by using current technology. The
other 12 analysts are trained in the use of the new software package and then instructed to
use it to produce the information system.
This study involves two populations: a population of systems analysts using the current
technology and a population of systems analysts using the new software package. In terms
of the time required to complete the information system design project, the population
means are as follow.
The researcher in charge of the new software evaluation project hopes to show that
the new software package will provide a shorter mean project completion time. Thus,
the researcher is looking for evidence to conclude that μ
2
is less than μ
1
; in this case, the
μ
2
the mean project completion time for systems analysts
using the new software package
μ
1
the mean project completion time for systems analysts
using the current technology
10.2 Inferences About the Difference Between Two Population Means: σ
1
and σ
2
Unknown 403
estimate of the difference between the two population means is 115 78 $37 to
115 78 $193.
The computation of the degrees of freedom (equation 10.7) is cumbersome if you are doing
the calculation by hand, but it is easily implemented with a computer software package. However,
note that the expressions and appear in both expression (10.6) and equation (10.7).
These values only need to be computed once in order to evaluate both (10.6) and (10.7).
Hypothesis Tests About μ
1
ⴚ μ
2
Let us now consider hypothesis tests about the difference between the means of two popu-
lations when the population standard deviations σ
1
and σ
2
are unknown. Letting D
0
denote
the hypothesized difference between μ
1
and μ
2
, Section 10.1 showed that the test statistic
used for the case where σ
1
and σ
2
are known is as follows.
The test statistic, z, follows the standard normal distribution.
When σ
1
and σ
2
are unknown, we use s
1
as an estimator of σ
1
and s
2
as an estimator of
σ
2
. Substituting these sample standard deviations for σ
1
and σ
2
provides the following test
statistic when σ
1
and σ
2
are unknown.
z
(x¯
1
x¯
2
) D
0
冑
σ
2
1
n
1
σ
2
2
n
2
s
2
2
兾n
2
s
2
1
兾n
1
This suggestion should
help if you are using
equation (10.7) to
calculate the degrees
of freedom by hand.
TEST STATISTIC FOR HYPOTHESIS TESTS ABOUT μ
1
μ
2
: σ
1
AND σ
2
UNKNOWN
(10.8)
The degrees of freedom for t are given by equation (10.7).
t
(x¯
1
x¯
2
) D
0
冑
s
2
1
n
1
s
2
2
n
2
CH010.qxd 8/16/10 7:49 PM Page 403
Copyright 2010 Cengage Learning. All Rights Reserved. May not be copied, scanned, or duplicated, in whole or in part. Due to electronic rights, some third party content may be suppressed from the eBook and/or eChapter(s).
Editorial review has deemed that any suppressed content does not materially affect the overall learning experience. Cengage Learning reserves the right to remove additional content at any time if subsequent rights restrictions require it.

404 Chapter 10 Comparisons Involving Means, Experimental Design, and Analysis of Variance
difference between the two population means, μ
1
μ
2
, will be greater than zero. The re-
search hypothesis μ
1
μ
2
0 is stated as the alternative hypothesis. Thus, the hypothe-
sis test becomes
We will use α .05 as the level of significance.
Suppose that the 24 analysts complete the study with the results shown in Table 10.1.
Using the test statistic in equation (10.8), we have
Computing the degrees of freedom using equation (10.7), we have
Rounding down, we will use a t distribution with 21 degrees of freedom. This row of the
t distribution table is as follows:
df
冢
s
2
1
n
1
s
2
2
n
2
冣
2
1
n
1
1
冢
s
2
1
n
1
冣
2
1
n
2
1
冢
s
2
2
n
2
冣
2
冢
40
2
12
44
2
12
冣
2
1
12 1
冢
40
2
12
冣
2
1
12 1
冢
44
2
12
冣
2
21.8
t
(x¯
1
x¯
2
) D
0
冑
s
2
1
n
1
s
2
2
n
2
(325 286) 0
冑
40
2
12
44
2
12
2.27
H
0
:
H
a
:
μ
1
μ
2
0
μ
1
μ
2
0
Current Technology New Software
300 274
280 220
344 308
385 336
372 198
360 300
288 315
321 258
376 318
290 310
301 332
283 263
Summary Statistics
Sample size n
1
12 n
2
12
Sample mean
1
325 hours
2
286 hours
Sample standard deviation s
1
40 s
2
44
x¯x¯
TABLE 10.1
COMPLETION TIME DATAAND SUMMARY STATISTICS
FOR THE SOFTWARE TESTING STUDY
Area in Upper Tail .20 .10 .05 .025 .01 .005
t-Value (21 df) 0.859 1.323 1.721 2.080 2.518 2.831
t 2.27
file
WEB
SoftwareTest
CH010.qxd 8/16/10 7:49 PM Page 404
Copyright 2010 Cengage Learning. All Rights Reserved. May not be copied, scanned, or duplicated, in whole or in part. Due to electronic rights, some third party content may be suppressed from the eBook and/or eChapter(s).
Editorial review has deemed that any suppressed content does not materially affect the overall learning experience. Cengage Learning reserves the right to remove additional content at any time if subsequent rights restrictions require it.