Arya S.P.S. Introduction to Micrometeorology
Подождите немного. Документ загружается.

208 13 Marine Atmospheric Boundary Layer
on wind speed,
sea
state, and atmospheric stability. To this end, many
experimental determinations of Co have been made by different investiga-
tors, using different measurement techniques. Early determinations were
largely
based
on
rather
crude estimates of the tilt of water surface and the
geostrophic departure of flow in the PBL, and are not considered very
reliable. More recently, the sea-surface drag has been determined by
using the more reliable eddy correlation, gradient, and profile methods. A
comprehensive review of the existing data on Co up to 1975was made by
Garratt
(1977). After applying the appropriate corrections for atmospheric
stability
and
actual observation height and using the Monin-Obukhov
similarity relations, the neutral drag coefficient
CON,
referred to the stan-
dard height
of
10 m, is obtained as a function of wind speed at 10m
(U
IO
) .
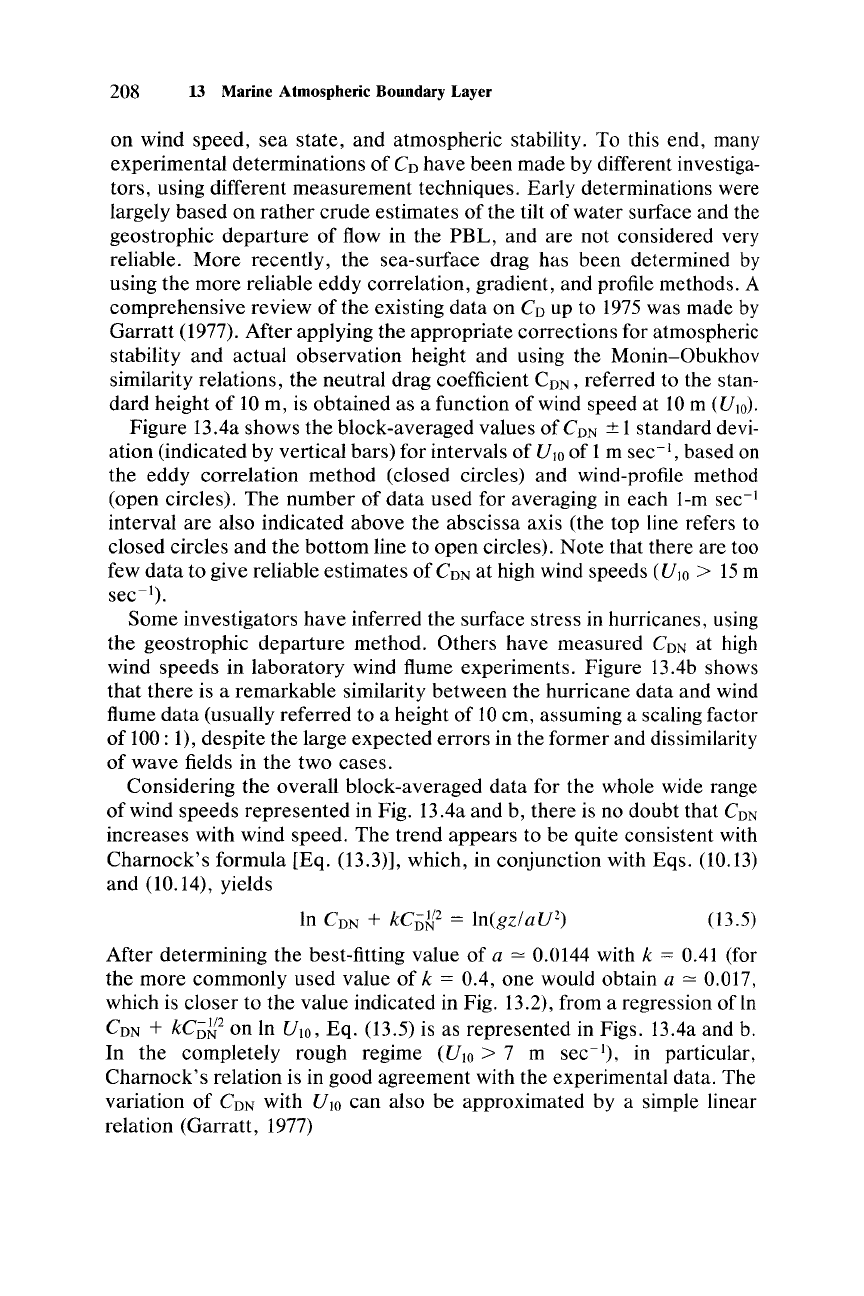
Figure
B.4a
shows the block-averaged values of
CON
± 1standard devi-
ation (indicated by vertical bars) for intervals of U
IO
of 1m sec:", based on
the eddy correlation method (closed circles) and wind-profile method
(open circles). The number of
data
used for averaging in each I-m sec"
interval are also indicated above the abscissa axis (the top line refers to
closed circles and the bottom line to
open
circles). Note that there are too
few
data
to give reliable estimates of
CON
at high wind speeds
(U
IO
> 15
ill
sec-I).
Some investigators have inferred the surface stress in hurricanes, using
the geostrophic departure method. Others have measured
CON
at high
wind speeds in laboratory wind flume experiments. Figure
13Ab shows
that
there is a remarkable similarity between the hurricane data and wind
flume
data
(usually referred to a height of 10em, assuming a scaling factor
of 100:
1), despite the large expected errors in the former and dissimilarity
of wave fields in the two cases.
Considering the overall block-averaged data for the whole wide range
of wind speeds represented in Fig.
BAa
and b, there is no doubt that
CON
increases with wind speed. The trend appears to be quite consistent with
Charnock's
formula [Eq. (13.3)], which, in conjunction with Eqs. (10.13)
and (10.14), yields
In
CON
+
kCiJW
=
In(gz/aU2)
(13.5)
After determining the best-fitting value of a = 0.0144 with k =
0041
(for
the more commonly used value of
k = 004, one would obtain a = 0.017,
which is closer to the value indicated in Fig. 13.2), from a regression of In
CON
+
kCD~2
on In U
IO
,
Eq. (13.5) is as represented in Figs.
BAa
and b.
In the completely rough regime
(U
IO
> 7 m sec
"),
in particular,
Charnock's
relation is in good agreement with the experimental data. The
variation of
CON
with U
IO
can
also be approximated by a simple linear
relation (Garratt, 1977)
13.2
Momentum
Transfer to the Sea Surface 209
II
3.0.----,-..,....-,.--,--,--..,..---.----,.---r--....-
.......
(a )
>C
Z
o
U
2.0 -
1.01-
-
I
16 21 71 43 31 63 56 27 19 5 10 6 I I 3
18 37 56 84 71 51 II 34 18 14 9 6 4 I
-
-
2 2
2 4 6 8 10 12 14 16
U
10
(m/s
)
18 20 22
50
40
10
I
I I
I 0
-
( b )
","""
'"
,..
t
-
"'+
t
-
'"
t 9
'"
•
-
3 6 6
5 2 6
5
I
10
I
5 I
2
5 I
3
3 I
2
I I
3
4
o
>C
Z 2
o
U
...,
o
20
30
U,O
(m/s)
Fig.13.4
Neutral
drag coefficient as a function of wind speed at a lO-m height compared
with
Charnock's
formula [Eq. (13.5), indicated by the
arrows
in (a) and (b)] with a = 0.0144.
Block-averaged values are shown for (a)
l-rn
sec-
1
intervals, based on eddy correlation and
profile methods,
and
(b) 5-m sec:" intervals,
based
on geostrophic departure method and
wind flume simulation experiments. [After
Garratt
(1977).]
(0.75 + 0.067U
lO
)
x 10-
3
(13.6)
or a power relation
C
DN
= 0.00051
U?046
in which U
IO
is to be expressed in meters
per
second.
(13.7)
210 13 Marine Atmospheric Bonndary Layer
A linear relationship, similar to
Eq.
(13.6), is also suggested by more
recent
measurements
of
drag in gale-force winds (see, e.g., Smith, 1980).
Such
linear or
power
relations, although convenient for practical applica-
tions, are
not
dimensionally homogeneous (empirical constants must have
rather
odd
dimensions).
Equation
(13.5) suggests that the more appropri-
ate dimensionless
parameter
governing C
DN
is the
Froude
number F
==
VI
(gZ)1/2,
which should be
used
instead
of
wind speed.
For
a fixed (standard)
reference height
of
10 m,
however,
F is directly proportional to the wind
speed
(F
=
O.
lOV
IO
,
for V
IO
in meters
per
second) and the latter can be
used for
convenience.
There
is some
controversy
over
the
variation of C
DN
with V
lO
at low and
moderate
wind
speeds
(say, V
IO
< 7.5 m sec
").
At very low wind speeds
(V
IO
< 2.5 m sec: I),
observations
from laboratory flume experiments and
from
over
lakes
and
oceans
indicate a slight tendency of C
DN
to decrease
with
the
increase
in wind
speed,
as would be
expected
for an aerodynamic
smooth surface.
But
sea
surface is rarely completely smooth; ripples and
wavelets
generated
by
weak
to
moderate
winds give it a moderate rough-
ness, which is transitional
between
smooth and completely rough re-
gimes.
Some
investigators
have
argued that the
dependence
of C
DN
on V
lO
should be
weak,
if any, in this transitional regime (2.5 < V
lO
< 7.5 m
sec
").
The
data
of
Fig. 13.4 do suggesta
weaker
dependence
of
CON
on V
lO
in this range.
Other
oceanic
data
have
even
indicated a nearly constant
value
of
CON
= 1.2 X 10-
3
in the
moderate
range of wind speeds (see,
e.g.,
Kraus,
1972).
Dependence
of
C
DN
on
other
parameters,
such as fetch, wind direction
relative to
the
coastline, temporal changes in wind speed and direction,
and
stage
of
wave
development, also need to be investigated. Most of the
original studies
of
sea-surface drag do
not
provide quantitative informa-
tion on
these
parameters
and do not classify C
DN
accordingly. Their ef-
fects remain
obscured
in
the
scatter
of individual
data
sets around the
mean values (indicated by
standard
deviations shown by vertical bars in
Fig. 13.4a
and
b) and also in
the
scatter
of
mean values.
Few
investigators
have
sought to investigate the
dependence
of
CON
on wind direction,
fetch,
and
sea-state
parameters,
such as Colu* (see,
e.g.,
Kitaigorodski,
1970;
SethuRaman,
1978; Smith, 1980).
There
is only a slight tendency for
the
drag coefficient to
decrease
with increasing fetch.
It
has also been
argued
that
the
coefficient a in
Charnock's
formula should decrease with
increasing
Cdu
;
and
may
reach
a
constant
asymptotic value only at the
equilibrium stage
of
wave
development. This would imply that
CON
should also
decrease
with increasing Colu*. An observational evidence in
support
of
such
a
trend
is given by
SethuRaman
(1978), who also shows
dramatic changes in
CON
in
response
to a rapid shift in wind direction.
13.3 Parameterization of
Air-Sea
Exchanges
211
13.3 PARAMETERIZATION OF
AIR-SEA
EXCHANGES
In addition to the transfer
of
momentum between the atmosphere and
the
ocean
at their interface, substantial amounts of heat (both sensible and
latent) and mass (e.g.,
water
vapor, CO
2
,
O
2
,
and salt nuclei) are ex-
changed across the
air-sea
interface. Of primary importance to the dy-
namics and thermodynamics of the atmosphere are
the exchanges of heat
and water vapor, which are usually parameterized as
H
o
= pCpC
H
U(0
0
-
0)
(13.8)
Eo = pCwU(Qo - Q)
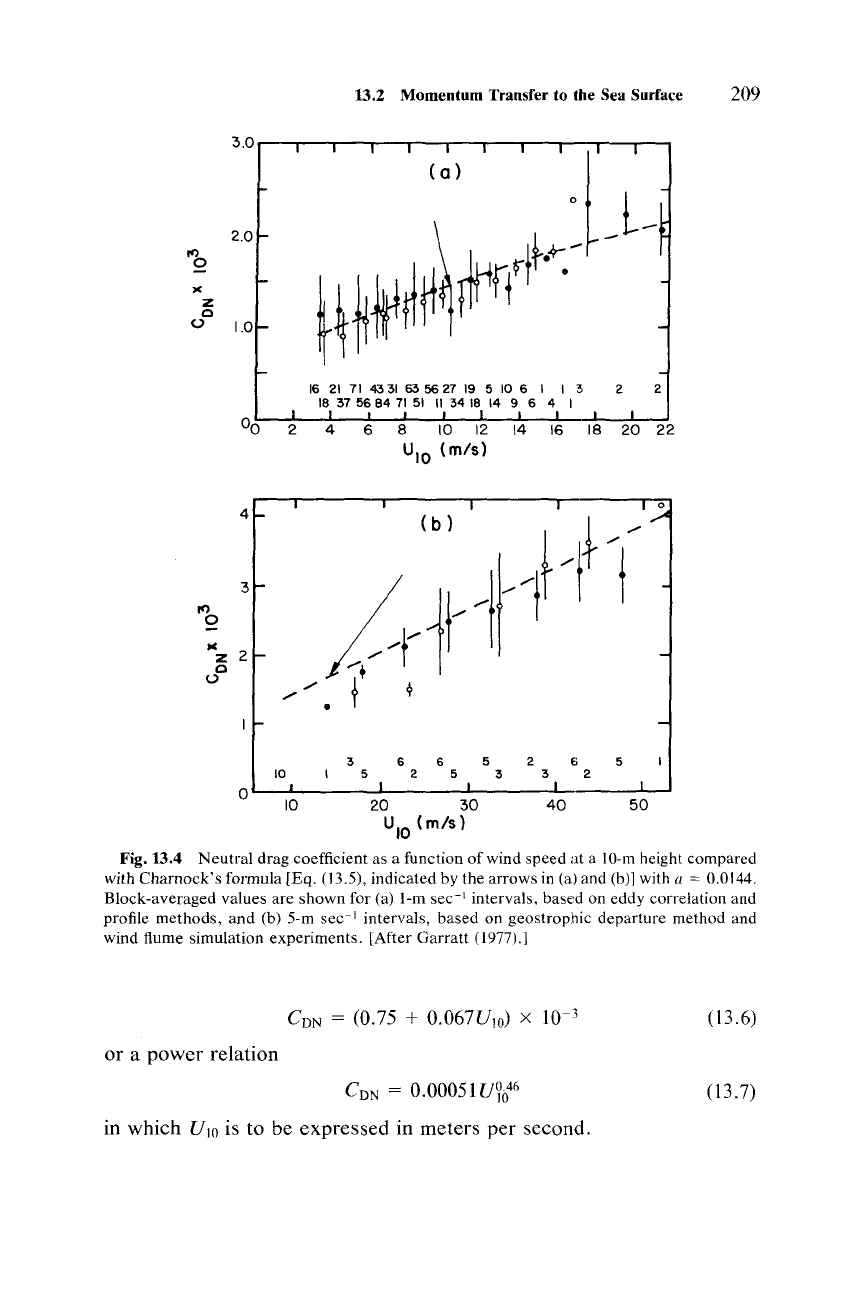
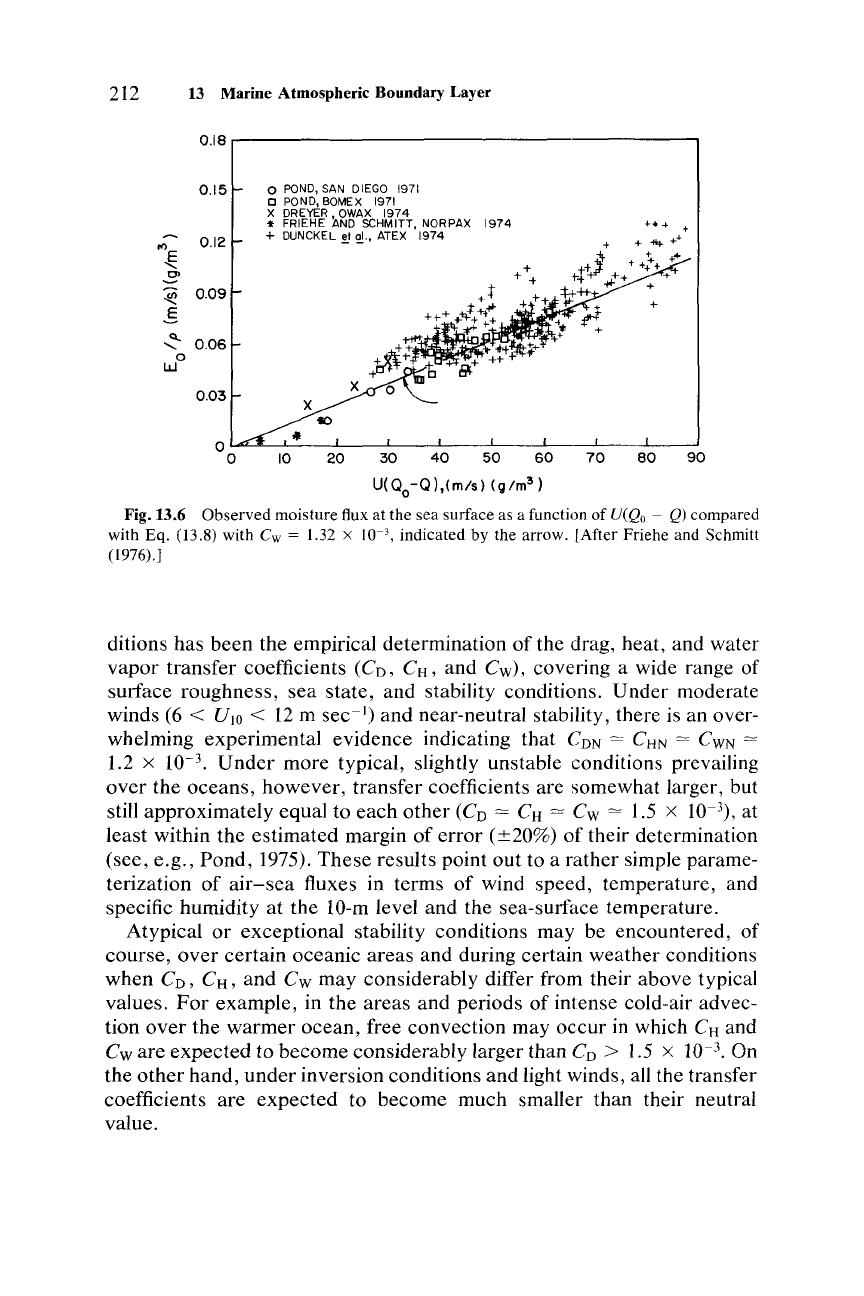
An experimental verification
of
Eq. (13.8) is given in Figs. 13.5 and 13.6,
in which vertical fluxes of heat and moisture are shown to be well corre-
lated (nearly proportional) with the products
U(0
0
-
0)
and U(Qo - Q),
respectively, at a reference height z = 10 m.
Note
that the bulk transfer
coefficients C
H
and
C
w
are given by the slopes of the regression lines
passing through the origin in Figs. 13.5 and 13.6, respectively.
A central objective of many
air-sea
interaction experiments and expe-
" "
"
"
"
"
0.25
0.20
0.15
-!!!
~
0.10
E
o~
XO
0.05
"
"
"0
-0.05
-20
0
20
"
"
40
60
80
100
U(8
o-8).
(mK/s)
120 140
160
Fig.13.5 Sensible heat flux at the sea surface as a function of
U(0
o
-
0)
in strong winds
compared with Eq. (13.8) with C
H
= 1.41 X 10
3
,
indicated by the arrow. [After Friehe and
Schmitt (1976); data from Smith and Banke (1975).J
212 13 Marine Atmospheric Boundary Layer
0.18.----------------·-------,
0.15
o POND, SAN DIEGO 1971
n POND, BOMEX
1971
X DREYER, OWAX 1974
" FRIEHE AND
SCHMITT, NORPAX
1974
0.12
+ DUNCKEL ~
'1!.,
ATEX
1974
...,
~
.!!}
~
0.09
S
Q..
0.06
<,
0
w
0.03
"
O.....
....L..----L-
__
L.-_--'-_--'
__
...J-_----'
__
~
_
__L_--'
o 10 20
30
40
50
60
70
80
90
U( Q
o
-Q
),(m/5)
(g/m
3)
Fig.13.6 Observed moisture flux at the sea surface as a function of U(Qo - Q) compared
with Eq. (13.8) with C
w
= 1.32 X 10-
3
,
indicated by the arrow. [After Friehe and Schmitt
(1976).]
ditions has been the empirical determination of the drag, heat, and water
vapor transfer coefficients (CD, C
H
,
and C
w
), covering a wide range of
surface roughness,
sea
state, and stability conditions. Under moderate
winds (6
< U
IO
< 12 m sec-I) and near-neutral stability, there is an over-
whelming experimental evidence indicating that C
DN
=0
C
HN
=0
C
WN
=0
1.2 X 10-
3
.
Under
more typical, slightly unstable conditions prevailing
over
the oceans, however, transfer coefficients are somewhat larger, but
still approximately equal to each
other
(CD
=0
C
H
=0
C
w
=0
1.5 x 10-
3
) ,
at
least within the estimated margin of error (±20%) of their determination
(see, e.g., Pond, 1975).
These
results point out to a rather simple parame-
terization of
air-sea
fluxes in terms of wind speed, temperature, and
specific humidity at
the
lO-m level and the sea-surface temperature.
Atypical or exceptional stability conditions may be encountered, of
course,
over
certain oceanic areas and during certain weather conditions
when
Co,
C
H
,
and C
w
may considerably differ from their above typical
values.
For
example, in the areas and periods of intense cold-air advec-
tion
over
the
warmer
ocean, free convection may occur in which C
H
and
C
w
are expected to become considerably larger than
CD
> 1.5 X 10-
3
.
On
the
other
hand,
under
inversion conditions and light winds, all the transfer
coefficients are expected to become much smaller than their neutral
value.
(13.10)
13.3 Parameterization of
Air-Sea
Exchanges 213
I-
Z
W
U 2
E~
w....J
8~
ffici
,,-0::
cnl-
z::>
~ ~
I
1---------=----='----------''\-------1
I-
cn
"-I-
0-
00
i=1-
<t
0::
-0.4
-0.3
-0.2
-0.1 0 0.1
0.2
RiB
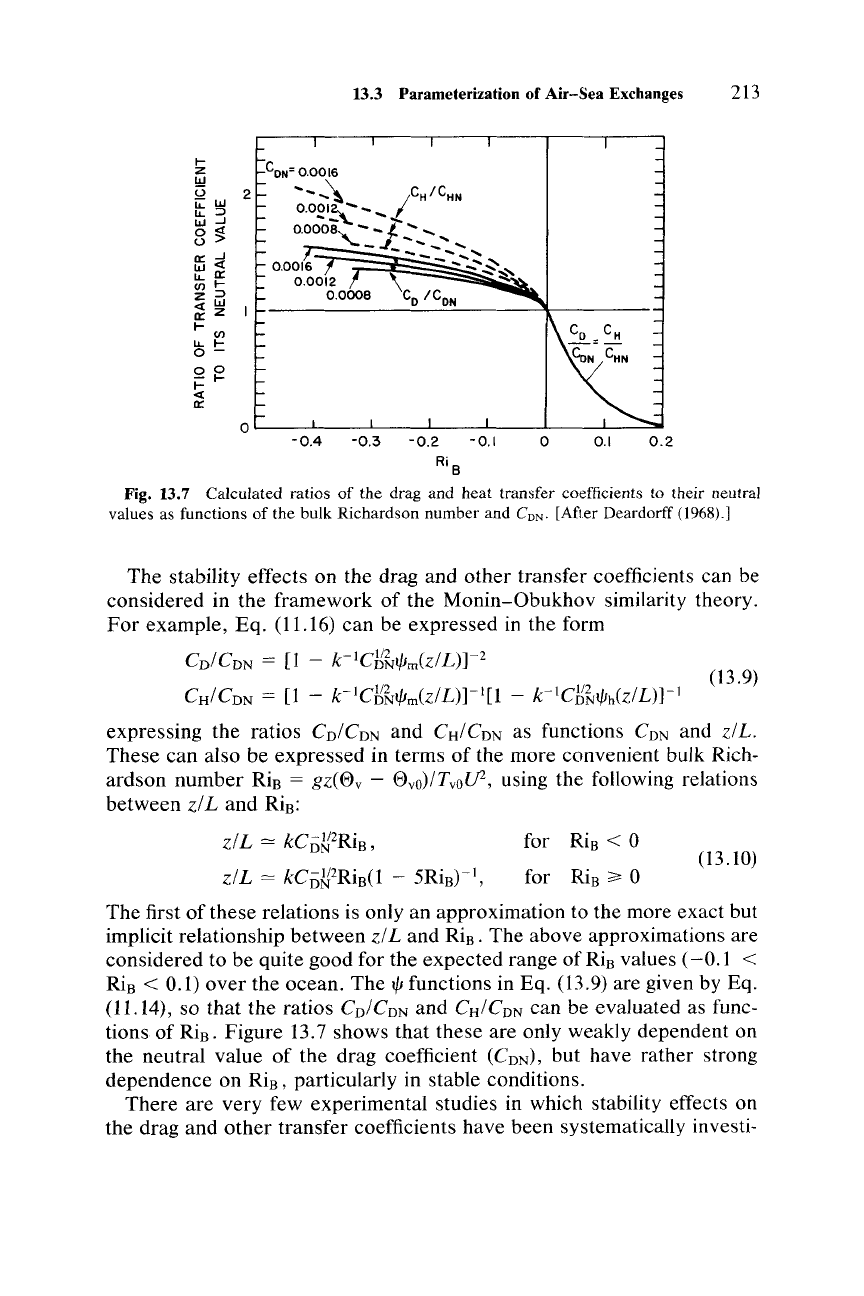
Fig. 13.7 Calculated ratios of the drag and heat transfer coefficients to their neutral
values as functions of the bulk Richardson number and C
DN
•
[After Deardorff (1968).]
The stability effects on the drag and
other
transfer coefficients can be
considered in the framework of the
Monin-Obukhov
similarity theory.
For
example, Eq. (11.16)
can
be expressed in the form
CD/CON
= [1 -
k-lcg~tjJm(z/L)]-2
(13.9)
CH/C
DN
=
[l
-
k-lcg~tjJm(z/L)]-l[l
-
k-lCH~tjJh(Z/L)]-1
expressing the ratios
CD/CON
and CH/C
ON
as functions
CON
and
z/L.
These
can
also be expressed in terms
of
the more convenient bulk Rich-
ardson
number
RiB
=
gz(0
v
-
0
v
o)/T
vo
rJ2
, using the following relations
between
z/L
and
RiB:
z/L = kC
oM2Ri
B,
for
RiB
< 0
z/
L =
kC
o
WRi
B
(1 - 5Ri
B
)- I, for
RiB?
0
The first of these relations is only an approximation to the more exact but
implicit relationship between
z/L and RiB. The above approximations are
considered to be quite good for the expected range of
RiB
values
(-0.1
<
RiB
< 0.1)
over
the ocean. The
tjJ
functions in Eq. (13.9) are given by Eq.
(11.14), so that the ratios
CD/CON
and CH/C
ON
can
be evaluated as func-
tions of RiB. Figure 13.7 shows that these are only weakly dependent on
the neutral value of the drag coefficient
(CON),
but have rather strong
dependence on RiB, particularly in stable conditions.
There are very few experimental studies in which stability effects on
the drag and
other
transfer coefficients have been systematically investi-
214 13 Marine Atmospheric Boundary Layer
•
•
2
•
•
•
•
..
'"
•
0
;----
•
•
x
0
•
u
•
...
•
..
0
-0.9
-0.8-0.4
-0.3
-0.2
-0.1
0 0.1
0.2
0.3 0.4
UNSTABLE
NEUTRAL
STABLE
ZlL
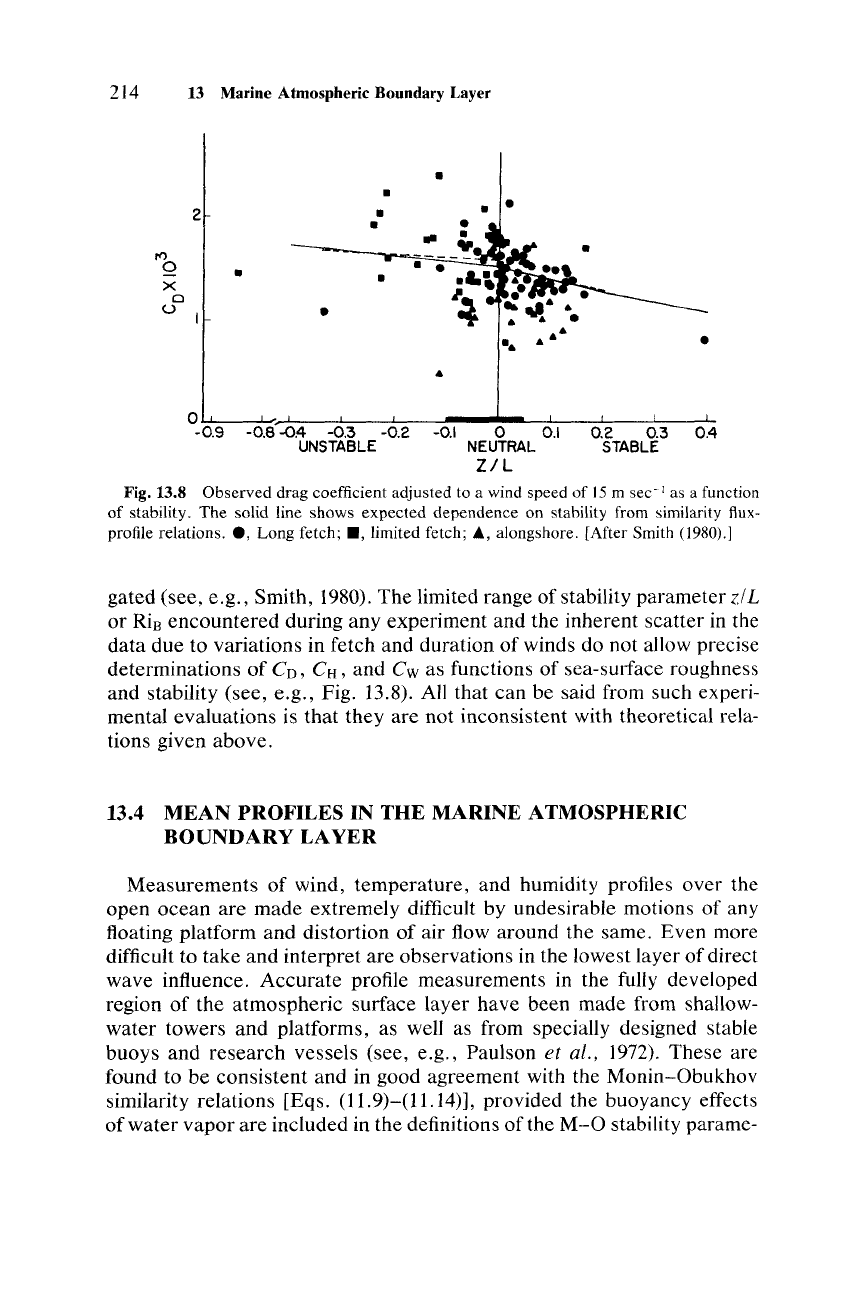
Fig. 13.8 Observed drag coefficient adjusted to a wind speed of 15 m sec-I as a function
of stability. The solid line shows expected dependence on stability from similarity flux-
profile relations. • , Long fetch;
.,
limited fetch; A, alongshore. [After Smith (1980).]
gated (see, e.g., Smith, 1980). The limited range of stability parameter zlI.
or
RiB
encountered during any experiment and the inherent scatter in the
data due to variations in fetch and duration of winds do not allow precise
determinations of CD, C
H
,
and C
w
as functions of sea-surface roughness
and stability (see, e.g., Fig. 13.8). All that can be said from such experi-
mental evaluations is that they are not inconsistent with theoretical rela-
tions given above.
13.4
MEAN
PROFILES
IN
THE
MARINE
ATMOSPHERIC
BOUNDARY
LAYER
Measurements of wind, temperature, and humidity profiles over the
open
ocean
are made extremely difficult by undesirable motions of any
floating platform and distortion of air flow around the same. Even more
difficult to take
and
interpret are observations in the lowest layer of direct
wave influence. Accurate profile measurements in the fully developed
region of the atmospheric surface layer have been made from shallow-
water
towers
and
platforms, as well as from specially designed stable
buoys and research vessels (see, e.g., Paulson
et al., 1972). These are
found to be consistent and in good agreement with the Monin-Obukhov
similarity relations [Eqs. (11.9)-(11.14)], provided the buoyancy effects
of
water
vapor
are included in the definitions of the
M-O
stability parame-
13.4 Mean Profiles in the MARL 215
7.0
6.5
6.0
E
I
~
I
...
.=
5.5
l
r
5.0
l
/
+
3 4
5
6
U
(rn/s
)
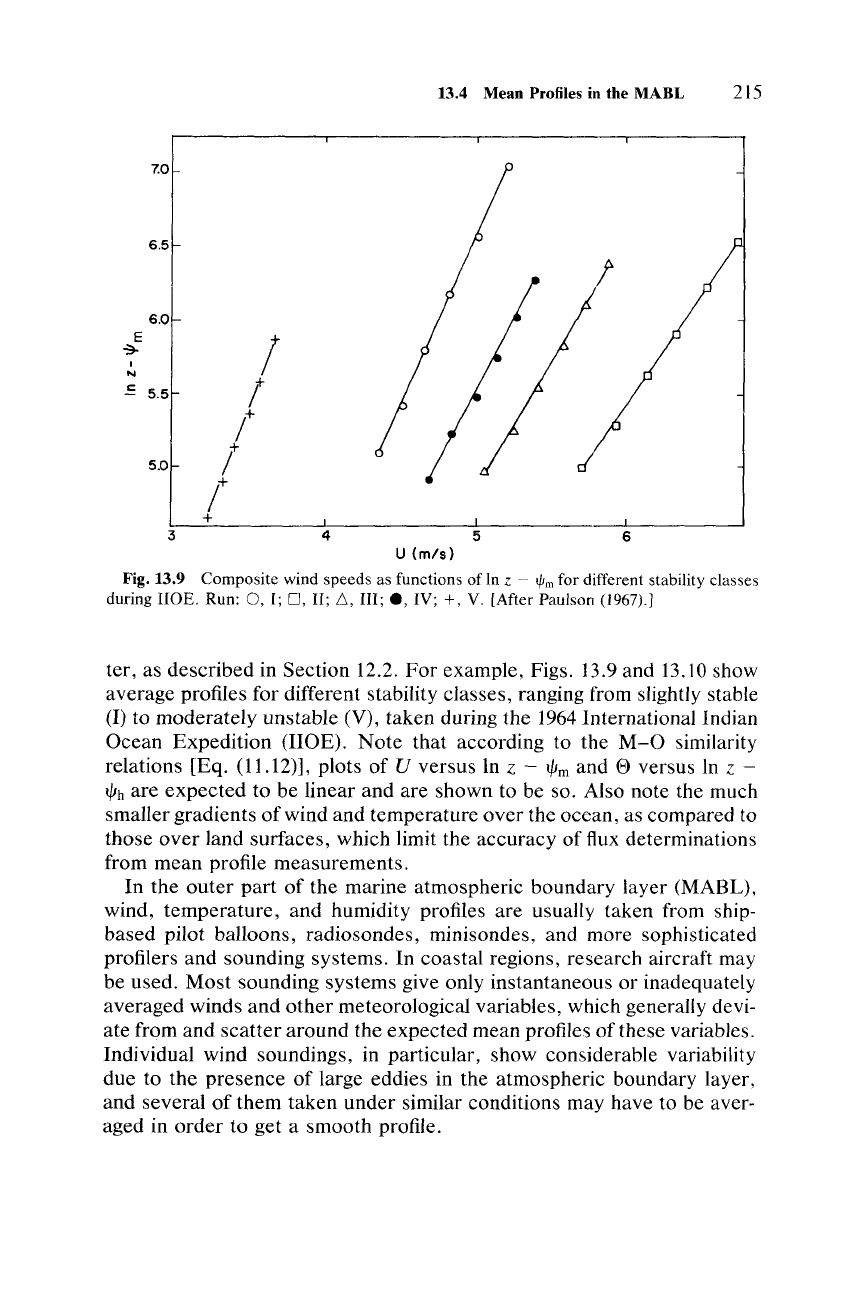
Fig. 13.9 Composite wind speeds as functions of In z
~
lfJrn
for different stability classes
during IIOE. Run:
0,
I; D, II; L.,
III;.,
IV; +, V. [After Paulson (1967).]
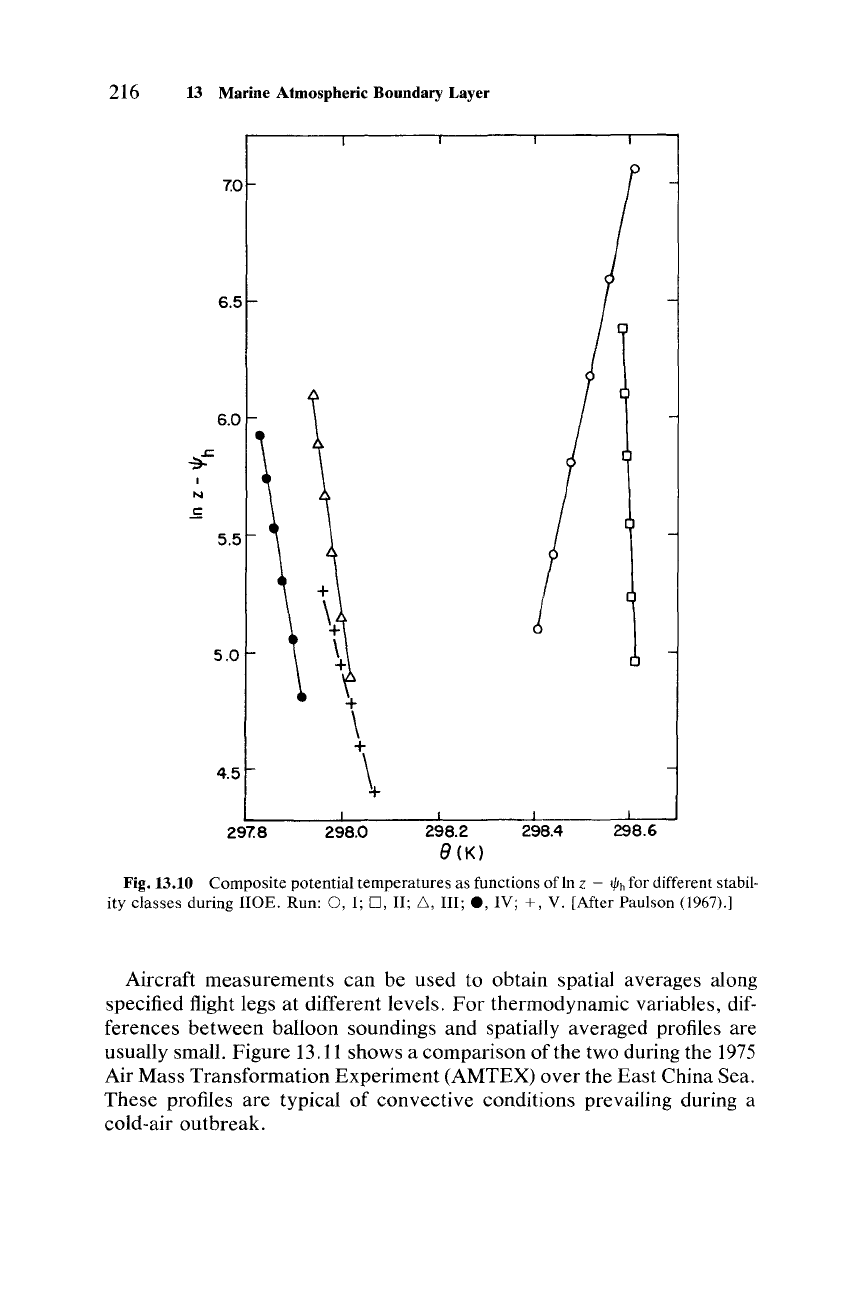
tel', as described in Section 12.2.
For
example, Figs. 13.9 and 13.10 show
average profiles for different stability classes, ranging from slightly stable
(I) to moderately unstable (V), taken during the 1964International Indian
Ocean Expedition (HOE).
Note
that according to the
M-O
similarity
relations [Eq. (11.12)], plots of
U versus In z -
t/lrn
and ® versus In z -
t/lh
are
expected
to be linear and are shown to be so. Also note the much
smallergradients of wind and temperature
over
the ocean, as compared to
those
over
land surfaces, which limit the accuracy of flux determinations
from mean profile measurements.
In the
outer
part
of the marine atmospheric boundary layer (MABL),
wind, temperature, and humidity profiles are usually taken from ship-
based pilot balloons, radiosondes, minisondes, and more sophisticated
profilers and sounding systems. In coastal regions, research aircraft may
be used. Most sounding systems give only instantaneous or inadequately
averaged winds
and
other
meteorological variables, which generally devi-
ate from and
scatter
around the expected mean profiles of these variables.
Individual wind soundings, in particular, show considerable variability
due to the presence of large eddies in the atmospheric boundary layer,
and several of them taken under similar conditions may have to be aver-
aged in
order
to get a smooth profile.
216 13 Marine Atmospheric Boundary Layer
7.0
6.5
6.0
~L:.
I
N
.s
5.5
5.0
4.5
297.8
+
\
+
\
298.0
298.2
8<Kl
298.4
298.6
Fig. 13.10 Composite potential temperatures as functions of In z -
o)Jh
for different stabil-
ity classes during HOE. Run:
0,
I; D, II;
6,
III;.,
IV; +, V. [After Paulson (1967).]
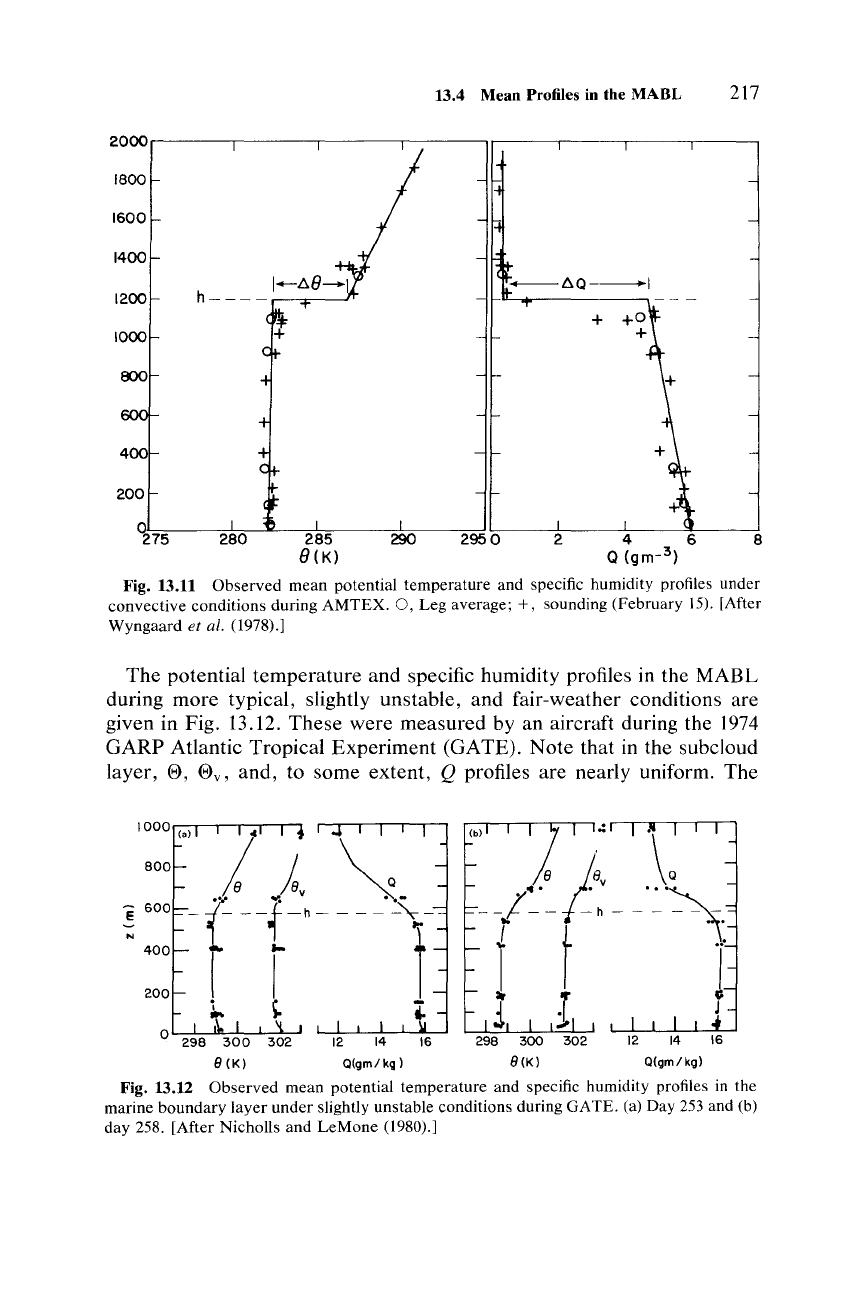
Aircraft measurements
can
be used to obtain spatial averages along
specified flight legs at different levels.
For
thermodynamic variables, dif-
ferences
between
balloon soundings and spatially averaged profiles are
usually small. Figure 13.11 shows a comparison of the two during the
1975
Air Mass Transformation Experiment (AMTEX)
over
the
East
China Sea.
These profiles are typical
of
convective conditions prevailing during a
cold-air outbreak.
13.4
Mean
Profiles in the
MARL
217
2000...-----,----,----,----,,..---,-----.----,.------.
1800
1600
1400
1200
1000
800
400
200
~75
2950
---l::>Q--1
8
Fig. 13.11
Observed
mean
potential
temperature
and specific humidity profiles under
convective conditions during
AMTEX.
0,
Leg average; +, sounding (February 15). [After
Wyngaard
et al. (1978).]
The
potential
temperature
and specific humidity profiles in the MABL
during
more
typical, slightly unstable,
and
fair-weather conditions are
given in Fig. 13.12.
These
were
measured
by an aircraft during the 1974
GARP
Atlantic Tropical
Experiment
(GATE).
Note
that in the subcloud
layer,
B, By, and, to some
extent,
Q profiles are nearly uniform. The
o
400
200
1000
(a)
..
.:
.:
-I-l,-~--('-J~
_\'1:
r r r I t J
l..
~
~
l 1 J
12 14
e
(K)
Q(gm/kg)
Q(gm/
kg)
Fig. 13.12
Observed
mean potential
temperature
and specific humidity profiles in the
marine
boundary
layer
under
slightly unstable conditions during
GATE.
(a) Day 253 and (b)
day
258. [After Nicholls and
LeMone
(1980).]