Catuneanu O. Principles of Sequence Stratigraphy
Подождите немного. Документ загружается.


50 2. METHODS OF SEQUENCE STRATIGRAPHIC ANALYSIS
Physical Attributes of Seismic Data
The makeup of a seismic image reflects the interac-
tion between the substrate geology and the seismic
waves traveling through the rocks, modulated by the
physical properties of the rocks. The seismic waves
emitted by a source at the surface are characterized by
specific physical attributes, including shape (spatial
form as depicted by a seismograph), polarity (direction
of main deflection), frequency (number of complete
oscillations per second), and amplitude (magnitude of
deflection, proportional to the energy released by
source). Excepting for frequency, which is a constant
parameter that depends upon the source of the seismic
signal, all other attributes may change as the waves
travel through the geological substrate.
The physical properties which are most relevant to
seismic data include the travel velocity of seismic
waves, and the acoustic impedance (velocity multi-
plied by the rock’s density) of the various layers and
the contrasts thereof. Changes in acoustic impedance
with depth are marked on seismic lines by reflections,
which can signify changes in lithology, changes in
fluid content within the same lithosome, or even dia-
genetic contrasts. Often, however, seismic reflections
do not necessarily correspond to single lithological
or fluid contacts, but may amalgamate a succession
of strata that has a thickness less than the seismic
resolution of that particular data set. As a general rule,
a seismic reflection that preserves the polarity of the
original seismic signal (i.e., ‘positive polarity’) indi-
cates an increase in acoustic impedance with depth
across that geological ‘interface’, whereas a change in
the polarity of the seismic signal (‘negative polarity’)
indicates a decrease in acoustic impedance with depth.
The amplitude of the seismic reflection is usually
proportional to the contrast in acoustic impedance
across the geological ‘contact’. Thus, high negative
anomalies at the top of reservoir facies are commonly
seen as a good ‘sign’ for petroleum exploration, as
they suggest a sudden decrease in acoustic impedance
inside the reservoir, which may potentially be related
to the presence of porosity and low density fluids
(i.e., hydrocarbons). For example, negative polarity
reflections may mark a change from shales to underly-
ing porous sandstones with hydrocarbons (ideal
context of sealed reservoirs), but also a potential
shift from compact sandstones (high acoustic imped-
ance) to underlying shales (relatively lower acoustic
impedance). Similarly, positive polarity reflections
may also be equivocal, and indicative of various
scenarios: shale overlying compact sandstones, porous
sandstones overlying shale, or top of salt diapirs
which are generally characterized by high acoustic
impedance.
The nature of the seismic reflector (single contact vs.
amalgamated package of strata) adds another degree
of uncertainty to any attempts to interpret polarity
data in terms of rock and fluid phases. Where the verti-
cal distance between stratigraphic horizons is greater
than the vertical resolution (i.e., seismic reflectors may
correspond to single geological interfaces), the polarity
of the reflections is more reliable in terms of geological
interpretations. However, where seismic reflectors
amalgamate closely spaced stratigraphic horizons,
polarity interpretations become less reliable, as what
we see on seismic lines is a composite signal. Therefore,
besides simple polarity and amplitude studies, an entire
range of additional techniques has been developed
to assist with the fluid evaluation from seismic data,
including the observation of bright spots (gas-driven
high negative anomalies), flat spots (hydrocarbon/water
contacts marked by horizontal high positive anomalies),
and AVO (amplitude variance with offset) methods of
computer data-analysis that increase the chances of
locating natural gas or light petroleum with a mini-
mum of 5% gas.
The vertical resolution of seismic data is primarily a
function of the frequency of the emitted seismic signal.
A high-frequency signal increases the resolution at the
expense of the effective depth of investigation. A low-
frequency signal can travel greater distances, thus
increasing the depth of investigation, but at the
expense of the seismic resolution. In practice, vertical
resolution is generally calculated as a quarter of the
wavelength of the seismic wave (Brown, 1991), so it
also depends to some extent on travel velocity, which
in turn is proportional to the rocks’ densities. For
example, the vertical resolution provided by a 30 Hz
seismic wave traveling with a velocity of 2400 m/s
is 20 m. This means that a sedimentary unit with a
thickness of 20 m or less cannot be seen as a distinct
package, as its top and base are amalgamated within
a single reflection on the seismic line. Acquiring the
optimum resolution for any specific case study
requires therefore a careful balance between the
frequency of the emitted signal and the desired depth
of investigation (Fig. 2.42).
The limitation imposed by vertical resolution has
been a main hindrance to the use of seismic data in
resolving the details at the smaller scale of many
individual reservoirs or depositional elements. For
this reason, traditionally, seismic data have been
regarded as useful for assessing the larger-scale struc-
tural and stratigraphic styles, but with limited applica-
tions when it comes to details at smaller-scale level.
SEISMIC DATA 51
However, as technology has improved, the limits of
vertical resolution have been pushed from tens of meters
down to meters, and spectacular three-dimensional seis-
mic images can now be obtained from the geological
substrate. In spite of this technological progress, seismic
data still provide only indirect information on the solid
and fluid phases in the subsurface, so calibration with
borehole data is essential for fine tuning the seismic
facies—lithofacies relationship, for velocity measure-
ments, or for time—depth conversions (Fig. 2.43).
Workflow of Seismic Data Analysis
The analysis of seismic data is facilitated by
computer algorithms, and this is routinely performed
by exploration geologists and geophysicists. The common
routine, or workflow, includes an initial assessment of
the large-scale structural and stratigraphic styles,
followed by detailed studies in the smaller-scale areas
that show features of potential economic interest. The
following sections present the main steps of this
routine, in workflow order.
Reconnaissance Studies
The reconnaissance analysis of a new seismic
volume (e.g., Fig. 2.41) starts with an initial scrolling
through the data (side to side, front to back, top to
bottom) in order to assess the overall structural and
stratigraphic styles (Hart, 2000). In this stage, as well
as in all subsequent stages of data analysis, the inter-
preter must be familiar with a broad range of deposi-
tional and structural patterns in order to determine
what working hypotheses are geologically reasonable
for the new data set (Fig. 2.44). Following the recon-
naissance scrolling, the seismic volume is ‘sliced’ in
the areas that show the highest potential, where struc-
tural or stratigraphic traps may be present. The occur-
rence of such traps is often marked by seismic
‘anomalies’ (e.g., Fig. 2.45), which can be further high-
lighted and studied by applying a variety of tech-
niques of data analysis. Slicing through the seismic
volume is one of the most common techniques, and
different slicing styles may be performed during the
various phases of data handling (Fig. 2.46). The easiest
slices that can be obtained in the early stages of data
analysis are the time slices (horizontal or inclined
planar slices through the volume; Fig. 2.46), which can
be acquired before seismic reflections are mapped
within the volume. The disadvantage of time slices
is that they are usually time transgressive, as it is
unlikely that a paleodepositional surface (commonly
associated with some relief, and potentially affected by
subsequent tectonism or differential compaction)
corresponds to a perfect geometrical plane inside the
seismic volume. For this reason, time slices are seldom
true representations of paleo-landscapes or paleo-
seafloors, unless the slice is obtained from very recent
sediments at shallow depths. Once seismic reflections
are interpreted and mapped throughout the volume,
horizon slices can be obtained by flattening the seismic
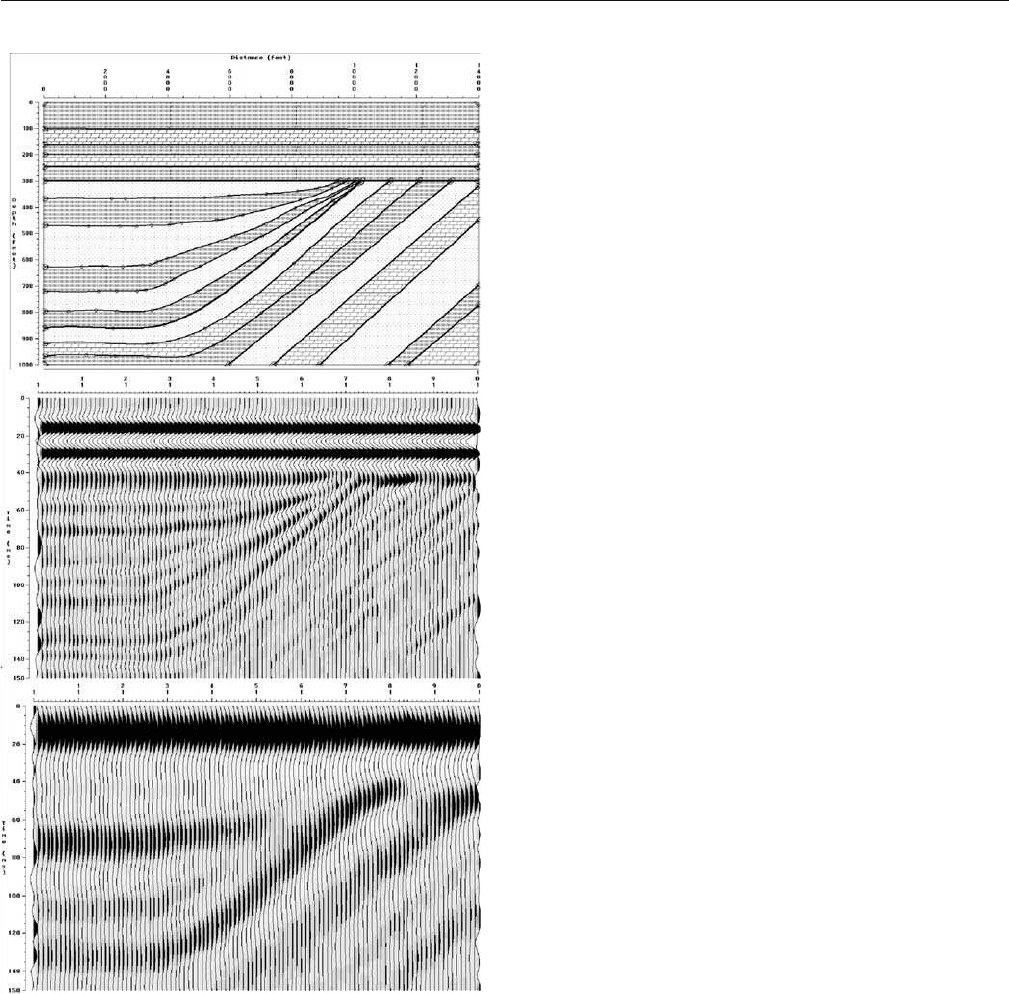
FIGURE 2.42. The effect of frequency on resolution and the
observed stratigraphic geometry (from Hart, 2000, reprinted by
permission of the Society for Sedimentary Geology). The real geom-
etry is visible in the seismic model constructed with a 75 Hz wavelet
(middle), but misleading in the model based on a 20 Hz frequency
(bottom), where an onlap relationship is apparent.
52 2. METHODS OF SEQUENCE STRATIGRAPHIC ANALYSIS
horizon of interest (interpreted to correspond to a
specific paleodepositional surface) and slicing the
volume along it (Fig. 2.46). Such horizon slices may
reveal astonishing geomorphologic details of past
landscapes, seascapes, and depositional environ-
ments, and provide key evidence for the interpretation
of paleodepositional settings and the calibration of
well-log data. The role of horizon slices in the geolog-
ical modeling of seismic volumes became more
evident in recent years, as the seismic resolution
improved in response to significant technological
advances, to the extent that a new discipline is now
emerging as ‘seismic geomorphology’ (e.g., Posamentier,
2000, 2004a; Posamentier and Kolla, 2003).
Still in the reconnaissance stage, the seismic anom-
alies emphasized by volume slicing can be further
studied with additional techniques, such as voxel
picking and opacity rendering, which can enhance
geomorphologic interpretations. A voxel is a ‘volume
element,’ similar with the concept of pixel (‘picture
element’) in remote sensing, but with a third dimen-
sion (‘z’) that corresponds to time or depth. The other
two dimensions (measured along horizontal axes ‘x’
and ‘y’) of a voxel are defined by the bin size, which is
the area represented by a single seismic trace. The
vertical (‘z’) dimension is defined by the digital
sampling rate of the seismic data, which is typically
2 or 4 milliseconds two-way travel time. Defined as
such, each voxel is associated with a certain seismic
amplitude value. The method of voxel picking involves
auto-picking of connected voxels of similar seismic
character, which can illuminate discrete depositional
elements in three dimensions. Similarly, opacity render-
ing, which makes opaque only those voxels that lie
within a certain range of seismic values, can also bring
out features of stratigraphic interest (Posamentier,
2004b; B. Hart, pers. comm., 2004; Fig. 2.45).
Interval Attribute Maps
Once the stratigraphic objectives have been identi-
fied in the initial reconnaissance stages, the intervals
bracketing sections of geologic interest can be evalu-
ated in more detail by constructing interval attribute
maps for those particular seismic ‘windows’ (Figs. 2.47
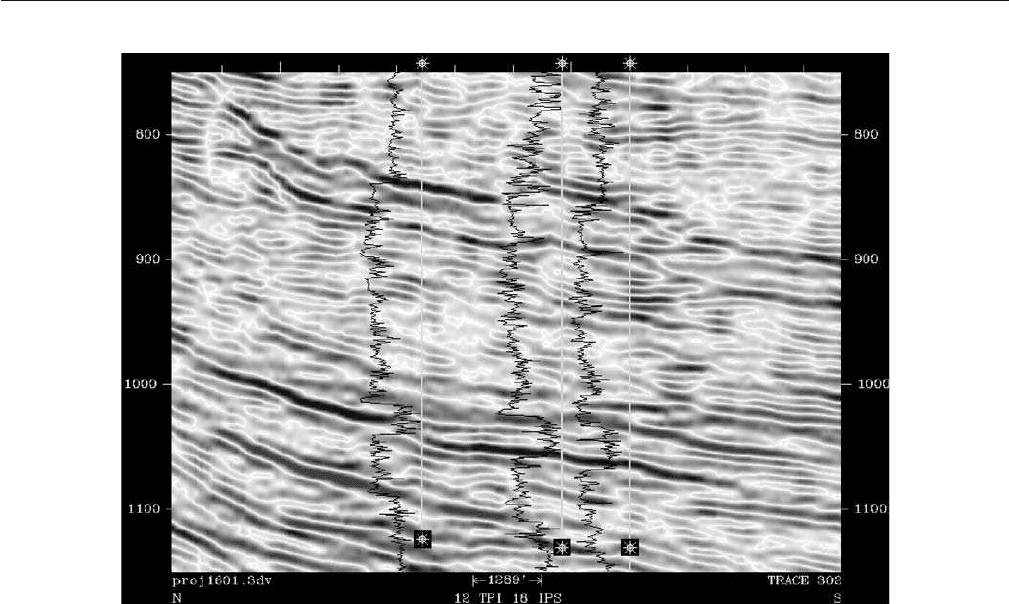
FIGURE 2.43 Example of a seismic line with well-log overlay (from Hart, 2000, reprinted by permission of
the Society for Sedimentary Geology). The transect shows the basinward progradation (to the right) of a
Permian mixed siliciclastic/carbonate continental slope in the Delaware Basin. The true location of the
gamma ray curves is indicated by the white vertical lines. Note the correspondence between lithology
contrasts (low GR—clean carbonates; higher GR—dolomitic sandstones and siltstones) and the location
of prominent reflections. This type of display, only possible to view once time/depth relationships have been
established, can be used to calibrate both the seismic and the well-log data.
SEISMIC DATA 53
F
B
C
D
E
A
Base of slope
Frontal spla
y
Debris flow lobes
Debris flow lobes
Debris flow
channel
Leveed
channel
1 km
1.5 km
2 km
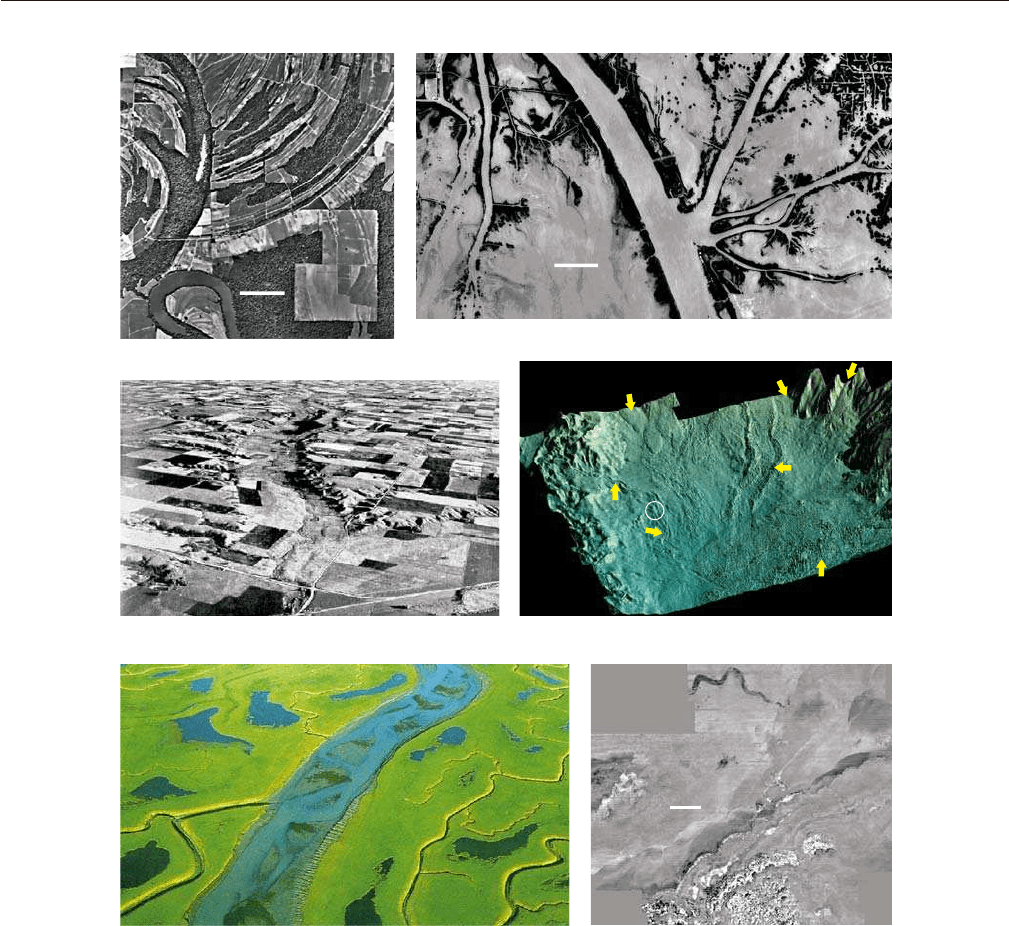
FIGURE 2.44 Analogs of modern and near modern depositional systems (images courtesy of H.W.
Posamentier). A—aerial photograph of the Mississippi River, Louisiana, showing scroll bars associated with
point bar development. B—aerial photograph of distributary channel and associated crevasse splays and
crevasse channels in the Main Pass area of the Mississippi delta, Louisiana. C—oblique aerial photograph of
a modern incised-valley system, Colorado; note the lateral tributary channels associated with drainage off the
associated interfluve areas (for scale, note the roads and farm houses). D—seismically derived image of the
modern seafloor in the ultra-deep waters of the DeSoto canyon area of the eastern Gulf of Mexico. Shown here
are the base of slope (slope angle is approximately 1.8°) and the adjacent basin floor (slope angle is approxi-
mately 0.3º). Features such as debris flow channels and lobes, turbidite leveed channels and turbidite frontal
splays are shown (for scale, the encircled channel is 300 m wide). E—oblique aerial photograph of an aban-
doning distributary channel, Mississippi delta, Louisiana. Note the thalweg and alternate bars within the
channel (for scale, the main channel in the photograph is 1 km wide). The smaller channels shown constitute
tidal creeks. F—seismic time slice through the Quaternary deposits of offshore eastern Java, Indonesia. The
shelf edge is defined by slump scars; a small incised valley feeding a shelf edge delta is present on the outer
shelf and presumably constitutes a forced regressive depositional system.
54 2. METHODS OF SEQUENCE STRATIGRAPHIC ANALYSIS
Seismic anomaly
Opacity rendering
Original cube
A
C
B
1 km
100 ms
A
B
C
5 km
5 km
5 km
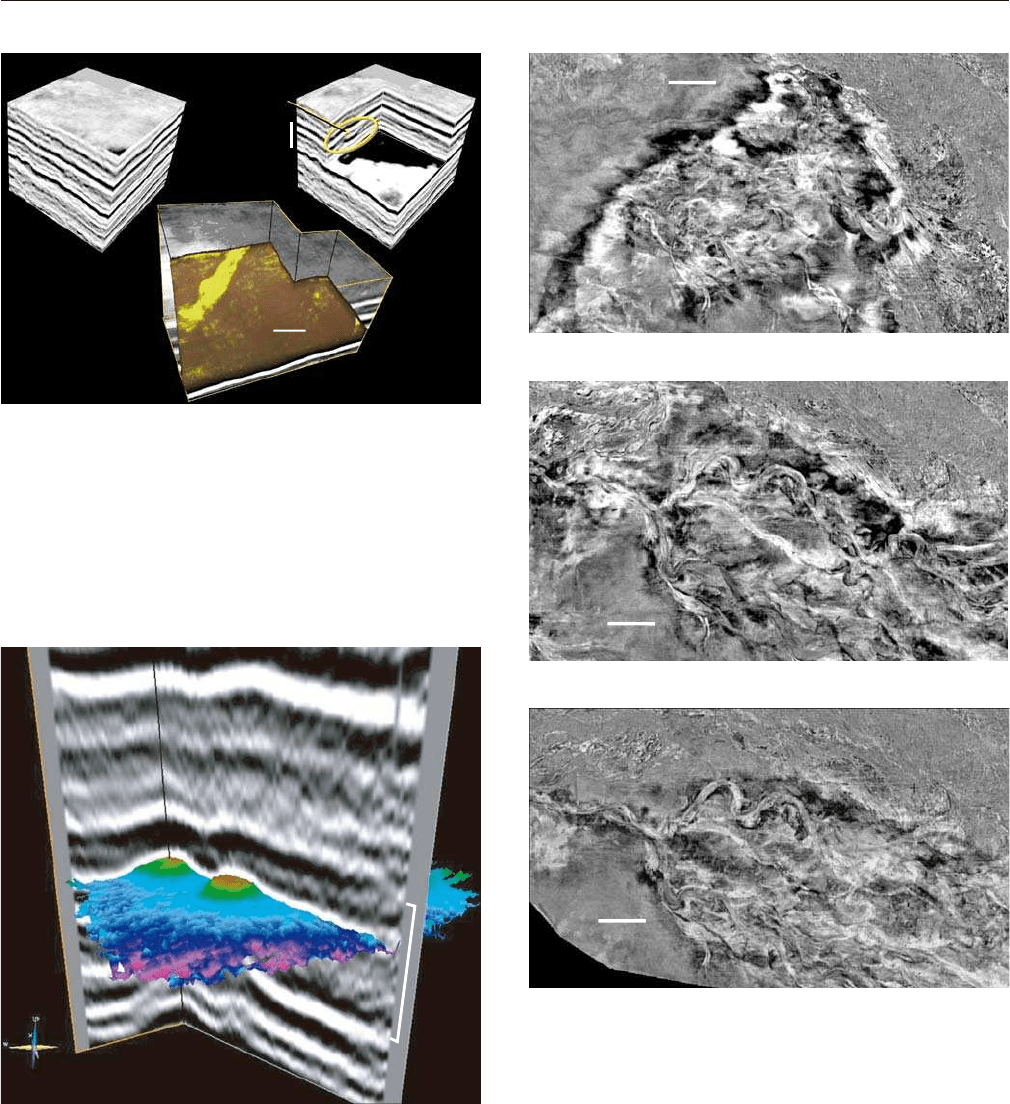
FIGURE 2.45 Reconnaissance interpretation of a seismic volume
(Western Canada Sedimentary Basin; images courtesy of H.W.
Posamentier). A—the original 3D seismic cube ––– the image shows
two section views and a plan view in the amplitude domain. B—
chair slice through the 3D seismic cube. A seismic amplitude anom-
aly is highlighted. C—opacity rendered cube where only high
amplitude voxels are rendered opaque; all other voxels are rendered
transparent. This allows for visualization of a linear amplitude
anomaly, interpreted as a channel.
FIGURE 2.46 Reconnaissance interpretation of a 3D seismic
volume using different slicing techniques (images courtesy of
H.W. Posamentier). A—time slice: amplitude extraction from a
planar horizontal slice. Shown here is part of a densely channeled
deep-water turbidite system, eastern Gulf of Mexico. B—dipping
planar slice: amplitude extraction from a planar surface dipping
at approximately 2° to the east-southeast. C—horizon slice: ampli-
tude extraction from a surface oriented parallel to a throughgoing
mappable seismic reflection close to the section of interest. This
type of slice yields the best image of the complete depositional
system.
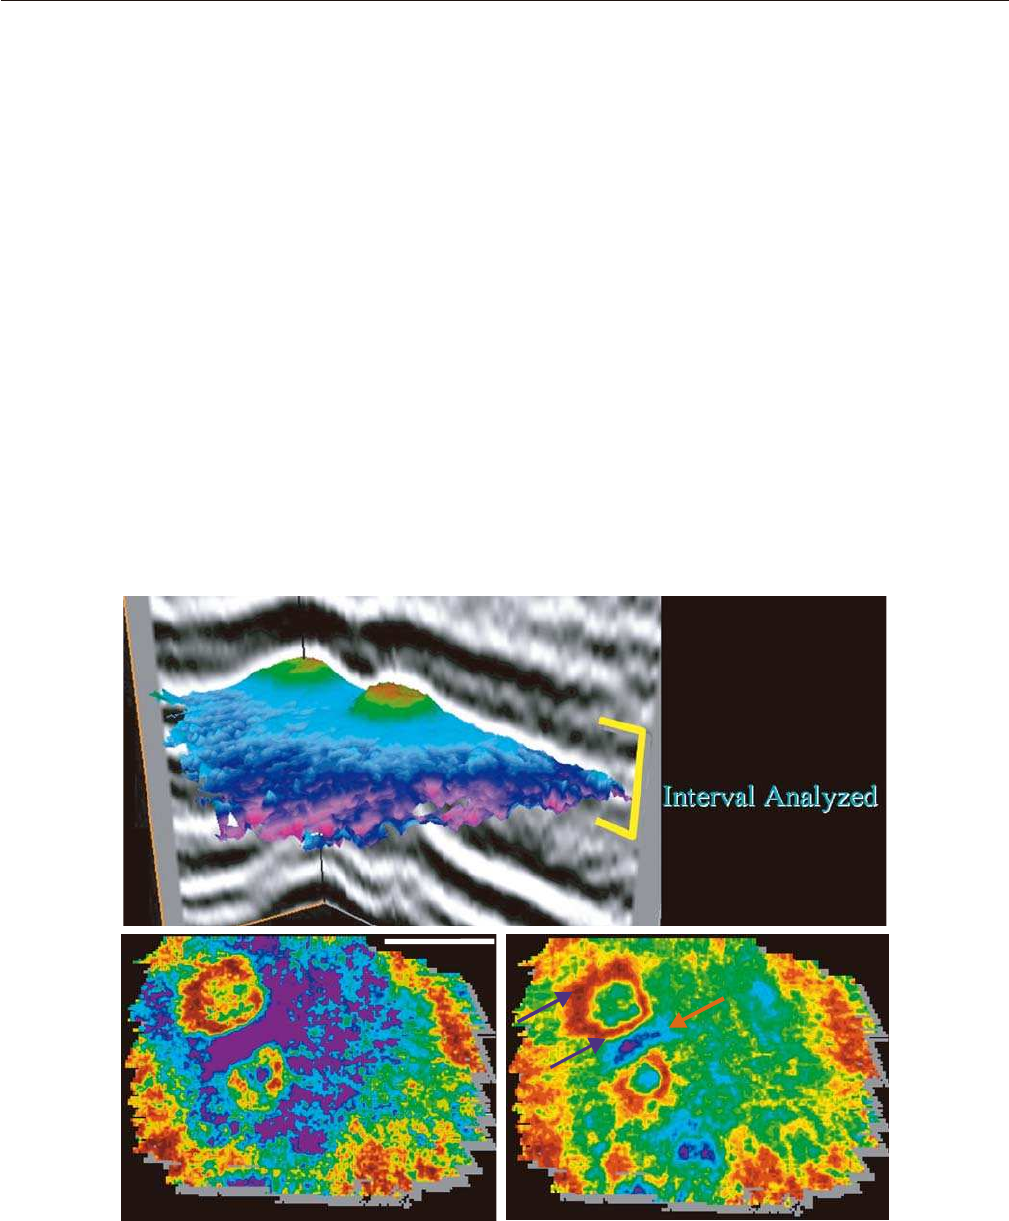
100 ms
(250 m)
FIGURE 2.47 Two Devonian pinnacle reefs in the Western
Canadian Sedimentary Basin, shown in section and three-dimen-
sional view (image courtesy of H.W. Posamentier). Colors on the
map view indicate time structure with reds/greens representing highs
and purple representing lows. For scale, each reef is about 720 m
wide. The two reefs are separated by a 200 m wide tidal channel.
SEISMIC DATA 55
and 2.48). Most commonly, different types of amplitude
extraction maps, seismic facies maps and seismic trace
coherence maps are constructed, each with the potential
of highlighting different features of the depositional
systems under analysis (Figs. 2.48–2.52).
The amplitude extraction maps may display various
amplitude attributes calculated over the selected inter-
val (e.g., averages, positive polarity, negative polarity,
cumulative amplitudes, amplitude peaks, square
roots, etc.), and commonly reflect contrasts in acoustic
impedance that may be interpreted in terms of lateral
facies changes. Hence, such maps often enable the
interpreter to visualize geomorphologic features that
may be diagnostic for specific depositional systems,
or even individual depositional elements within
depositional systems (e.g., a fluvial channel fill in
Fig. 2.49, or reef structures in Fig. 2.48).
The seismic facies maps also require the selection of
an interval (e.g., 34 ms in Fig. 2.51), within which the
shape of the seismic traces is analyzed by computer
algorithms and classified into a number of waveforms.
The color codes used to differentiate between the
different waveform classes enable the construction of
maps that again can be interpreted in terms of facies
and depositional elements (Figs. 2.50 and 2.51). This
means that, as in the case with the lateral changes in
amplitude attributes along the selected window, the
change in seismic waveforms is also influenced by
lateral shifts of facies, and hence each trace shape may
be associated with a specific lithology-fluid ‘package’.
Of course, such a relationship needs to be calibrated
with borehole data, although the overall geomorphol-
ogy of depositional elements on the seismic facies maps
may often allow one to infer with a high degree of confi-
dence what lithofacies are expected in the various areas
of a depositional system. For example, classes 9 and 10
in Fig. 2.50 (encircled area) are thought to indicate the
location of the best reservoir sands within the channel
fill. Once waveforms are interpreted in lithofacies terms,
the visualization of particular depositional elements
may be enhanced by highlighting only selected classes
of trace shapes (Fig. 2.51).
(c. 50 ms/125 m)
1 km
FIGURE 2.48 Interval attribute maps (maximum amplitude values to the left, and positive polarity total
amplitude to the right) for the two reefs in Fig. 2.47 (images courtesy of H.W. Posamentier). The interval
analyzed is approximately a 50 ms window. Note the amplitude asymmetry around the reef structures (blue
arrows), possibly reflecting different patterns of current circulation around the reefs, with asymmetry
suggesting a landward and a leeward side (prevailing wind direction is from the upper right). The amplitude
anomaly between the reef structures (red arrow) indicates a different lithology, possibly associated with
enhanced tidal scouring between the reefs.
56 2. METHODS OF SEQUENCE STRATIGRAPHIC ANALYSIS
The correlation, or lack thereof, of seismic traces
within a chosen volume may be further emphasized by
constructing coherence maps, which provide additional
means for the study of geomorphological features
(Fig. 2.52). Coherence is a volume attribute that empha-
sizes the correlation of seismic traces—light colors are
assigned where seismic traces correlate, and dark
colors indicate a lack of correlation. Coherence high-
lights seismic edges, which may correspond to struc-
tural or depositional elements.
Horizon Attribute Maps
Horizon attribute maps enhance the visualization
of geomorphologic and depositional elements of
specific paleodepositional surfaces (past landscapes or
seascapes), by picking the geological horizon of inter-
est within the seismic window studied in the previous
step. If the interpretation of seismic reflections is
correct, these horizon slices should be very close to
time lines, providing a snapshot of past depositional
environments. Horizon maps are constructed by
extracting various seismic attributes along that partic-
ular reflection, such as dip azimuth, dip magnitude,
roughness, or curvature (Fig. 2.53). Amplitude may
also be extracted from a surface oriented parallel to a
throughgoing mappable seismic reflection, as exempli-
fied in Fig. 2.46C. Such horizon slices yield the best
image of the complete depositional system.
Time structure maps (‘depth’ in time below a
surface datum) may also be obtained for a geological
horizon mapped in three dimensions, and add impor-
tant information regarding the subsidence history and
the structural style of the studied area (Fig. 2.54).
Interval or horizon attributes may be combined to
enhance visualization effects, such as superimposing
dip magnitude attributes on a time structure map
(Fig. 2.55), or co-rendering coherence with amplitude
data (Fig. 2.56).
3D Perspective Visualization
Three-dimensional perspective views add another
degree of refinement to the information already avail-
able from the interval and horizon attribute maps. 3D
perspective views illustrate surfaces extracted from 3D
seismic data and depicted in x–y–z space. Interpreted
horizons are then illuminated from a preferred direction
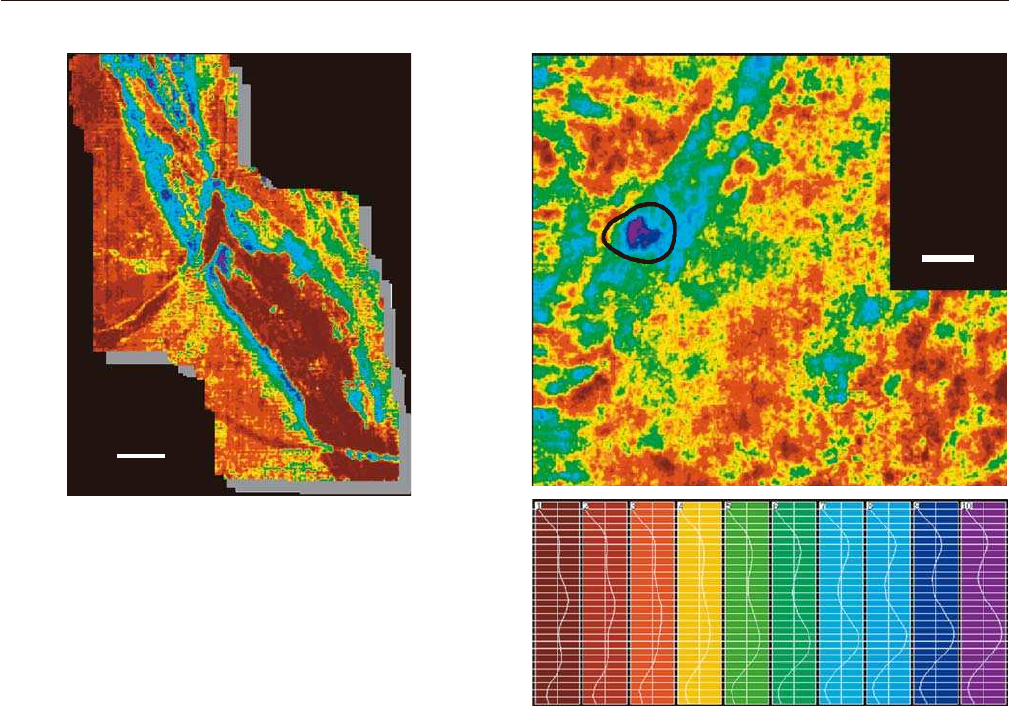
1 km
FIGURE 2.49 Interval attribute of a Cretaceous distributary
channel (Western Canada Sedimentary Basin; image courtesy of
H.W. Posamentier). The attribute illustrates the amplitude strength
within a 40 ms window. The lineaments within the 1.5 km wide
channel represent alternate bars. Note the two, smaller, channels
crosscutting the principal distributary channel. The crosscutting
relationship suggests that the two small channels are younger than
the larger channel.
1 km
FIGURE 2.50 Seismic facies map based on a ten-fold classifica-
tion of seismic traces (image courtesy of H.W. Posamentier). This
example shows a channelized system in the Western Canada
Sedimentary Basin. The black outline delineates a small structural
high. Note that the deepest purple seismic class (i.e., Class 10) is
confined to this outline, suggesting the possible presence of an accu-
mulation of hydrocarbons within the channel at this location.
Overall, the channel fill facies is dominated by Classes 7–10,
whereas the interfluve area is dominated by Classes 1–6.
SEISMIC DATA 57
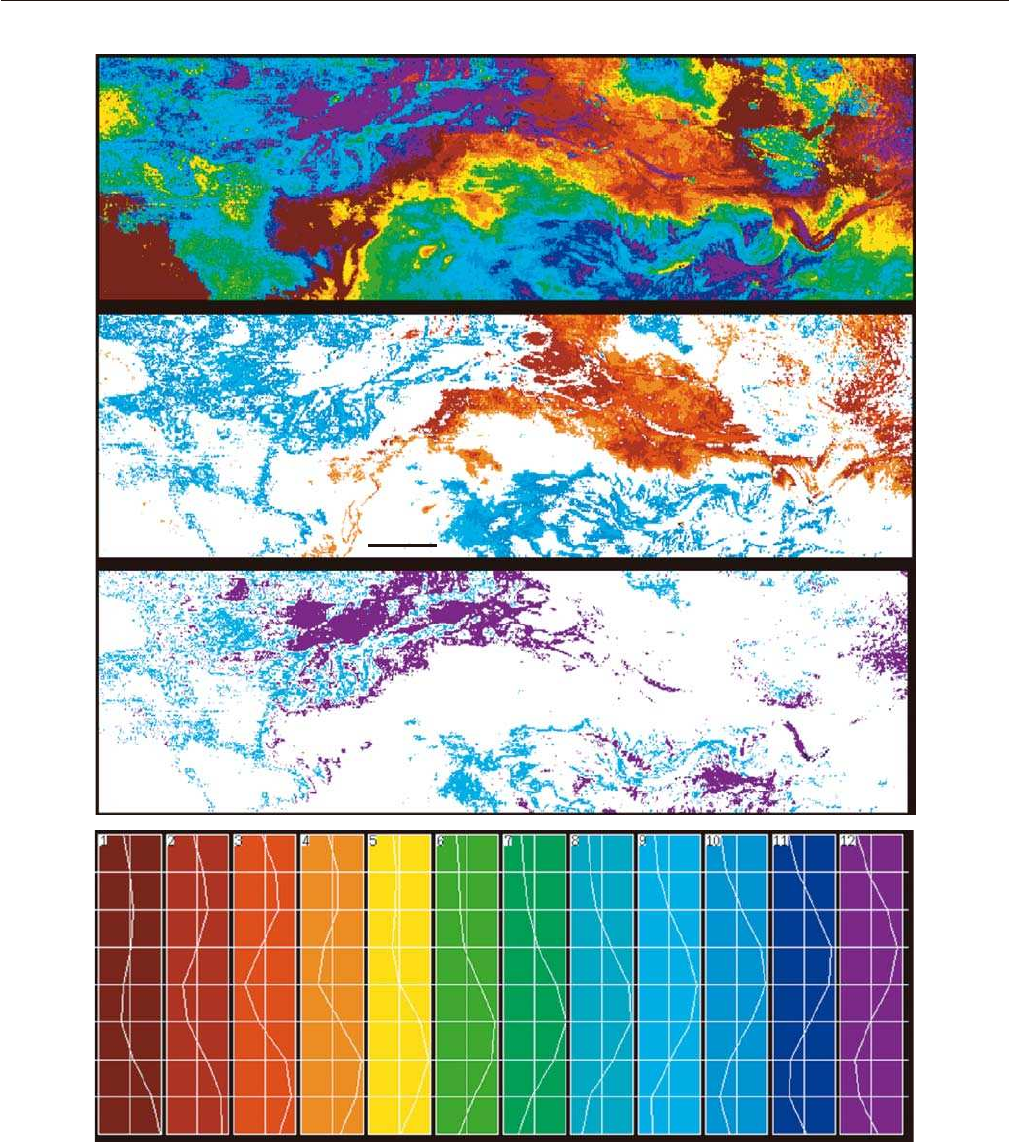
3 km
A
B
C
FIGURE 2.51 Seismic facies map of a deep-water mass transport complex, eastern Gulf of Mexico basin
floor (images courtesy of H.W. Posamentier). The map is time transgressive, showing debris flow deposits
(upper-left side of the image; proximal) overlying a channelized turbidity system (lower-right side of the
image; distal). The analysis is based on a 34 ms interval, with twelve seismic classes defined. A—all classes
are highlighted; a pattern of large-scale convolute deformation can be observed; B—only classes 2, 3, 4, and
9 are highlighted; this image reveals the more sheet-like portion of the mass transport complex in the more
distal area; C—only classes 9 and 12 are highlighted; this image reveals the more convolute part of the mass
transport complex, in the more proximal part of the system.
58 2. METHODS OF SEQUENCE STRATIGRAPHIC ANALYSIS
designed to highlight the relief and the depositional
element morphology. Figures 2.57, 2.58, and 2.59 illus-
trate examples of such three-dimensional perspective
images, which provide outstanding reconstructions of
landscapes sculptured by fluvial systems (Fig. 2.57),
seascapes of carbonate platforms (Fig. 2.58), or basin
floors in deep-water settings dominated by gravity
flows (Fig. 2.59). Such seismic data are of tremendous
help in the reconstruction of paleodepositional envi-
ronments and the calibration of borehole data. The
examination of geological features in a three-dimen-
sional perspective view may also be enhanced by
changing the angle of view, or by changing the angle
of incidence of the light source that illuminates a
particular image (Fig. 2.60).
AGE DETERMINATION TECHNIQUES
Age determinations refer to the evaluation of
geological age by faunal or stratigraphic means, or by
physical methods involving the relative abundance
of radioactive parent/daughter isotopes (Bates and
A
B
C
D
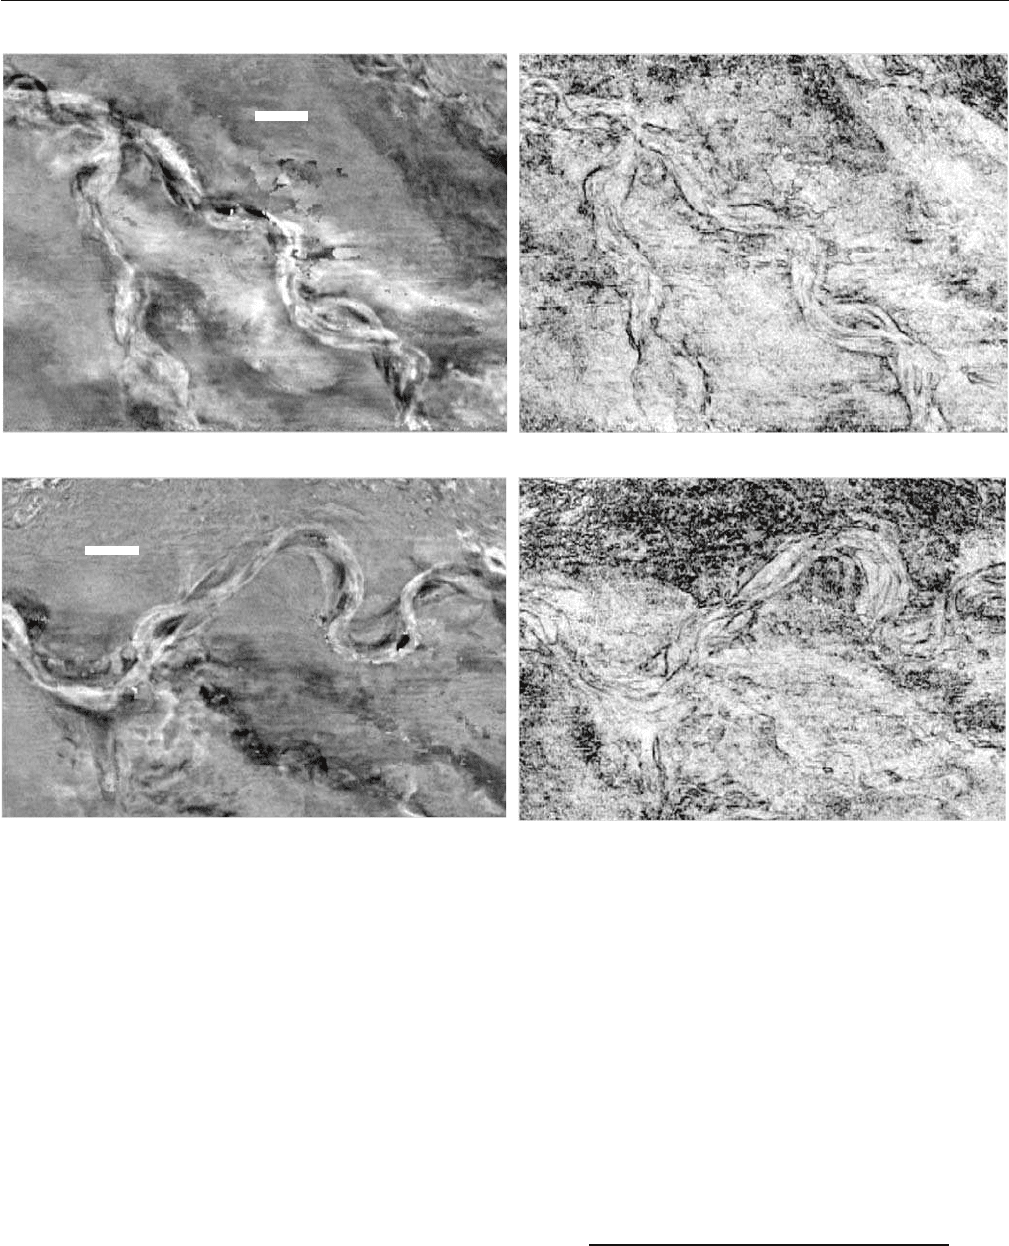
1 km
1 km
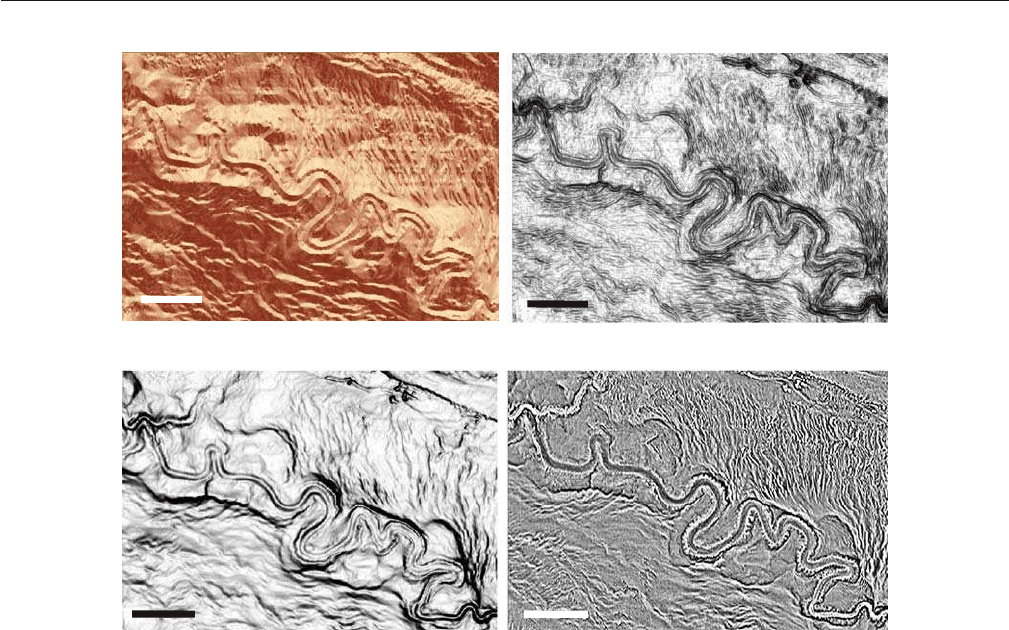
FIGURE 2.52 Interval attributes that characterize a deep-water Plio-Pleistocene channel system in the east-
ern Gulf of Mexico (images courtesy of H.W. Posamentier). A and B: Amplitude extraction from two horizon
slices — these images capture successive positions of the channel thalweg and illustrates episodes of channel
avulsion. The multiple thalweg images suggest meander loop migration towards the right and concomitant
flow in that direction. C and D: Coherence slices of the same channel system shown in A and B. Coherence
is a volume attribute that emphasizes the correlation of seismic traces—light colors are assigned where
seismic traces correlate, and dark colors indicate a lack of correlation. Coherence highlights seismic edges
(i.e., edges of depositional elements), and in this image enhances the channel margins also observed in the
amplitude domain in A and B.
AGE DETERMINATION TECHNIQUES 59
Jackson, 1987). Time control may generally be achieved
by means of biostratigraphy, magnetostratigraphy,
isotope geochemistry, or by the mapping of lithologi-
cal time-markers. Age data are always desirable to
have, and are particularly useful to constrain correla-
tions at larger scales.
The resolution of the various dating techniques varies
with the method, as well as with the age of the deposits
under investigation. For example, biostratigraphic
determinations may provide resolutions of 0.5 Ma
(Cretaceous ammonite zonation in the Western
Canada Sedimentary Basin; Obradovich, 1993), 1 Ma
(upper Cretaceous nonmarine palynology in the
Western Canada Sedimentary Basin; A.R. Sweet, pers.
comm., 2005), or 2 Ma (Permo-Triassic vertebrate fossils
in the Karoo Basin; Rubidge, 1995). Biostratigraphy
used in conjunction with magnetostratigraphy leads to
even better results, increasing the resolution to about
0.4–0.5 Ma (the span of polarity chrons) for selected
Cretaceous and Tertiary intervals. Geochronology
produces results with an error margin of less than
0.5 Ma for the Phanerozoic, and more than 1 Ma for the
Precambrian. In addition to these methods, lithological
time markers, such as ash layers or widespread pale-
osol horizons, add to the available time control by
providing excellent reference time-lines (Fig. 2.61).
The resolution of age determinations generally
decreases with older strata due to a number of factors
including facies preservation, postdepositional tecton-
ics, diagenetic transformations, metamorphism, and
five km
five km
five km
five km
A
D
B
C
FIGURE 2.53 Horizon attributes that characterize the deep-water mid to late Pleistocene ‘Joshua’ channel
in the northeastern Gulf of Mexico (modified from Posamentier, 2003; images courtesy of H.W. Posamentier).
A—dip azimuth map: this map depicts the orientation of the surface such that north facing surfaces are
assigned light colors, south facing are assigned dark colors, with intermediate orientations assigned colors
between light and dark. This type of map creates a pseudo-3D image. Note the apparent knife-edge top of the
small raised channel. Note also, the small sediment waves flanking the channel belt. B—surface roughness
map: this map captures the roughness of a surface; rough areas are assigned dark colors, whereas smooth
areas are assigned light colors. C—dip magnitude map: this map captures slope angles across the surface.
Steep slope angles are indicated in black, whereas gentle slopes are depicted in white. In this display the
raised channel is not imaged as a knife-edged feature. Rather, it is characterized by a flat to rounded feature,
convex-upward. D — Curvature map: this map illustrates the curvature of the horizon, and outlines deposi-
tional elements by assigning dark colors for low-curvature (flat) areas and light colors for high-curvature
edges of geomorphological features. Detailed morphology not as readily observed on the other attribute
maps include small slump scars on the inner levee flanks adjacent to the raised channel, as well as sediment
waves observed in the overbank areas.