Charlton M., Humberston J.W. Positron Physics
Подождите немного. Документ загружается.

5.1 Excitation 219
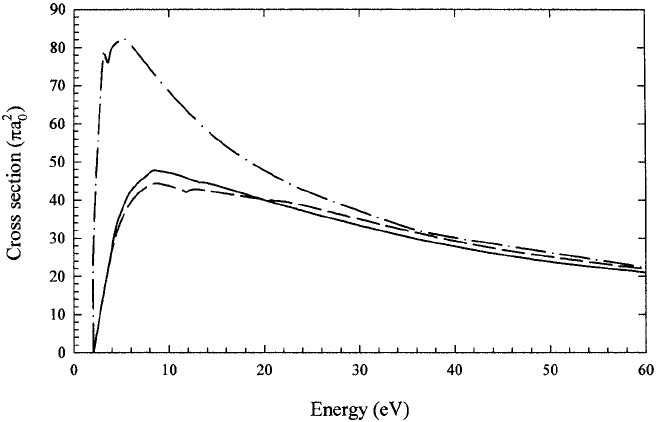
Fig. 5.2. Cross sections for
the 2S–2P excitation of lithium obtained
using the
coupled-state approximation (McAlinden, Kernoghan and Walters, 1997): ——,
29 target states plus three positronium states; – – –, five target states plus three
positronium states; — · —, five target states only.
hundred eV, the highest energies considered. All the theoretical results
also predict a cross section for 2
1
P excitation which is several times larger
than that for 2
1
S excitation. Buckley and Walters (1975) used various
forms of the second Born approximation to calculate the 2
1
S excitation
cross section in the energy range up to 1000 eV. Beyond approximately
600 eV their results agree quite well with those of the first Born ap-
proximation. Saxena, Gupta and Mathur (1984) devised an alternative
method of dealing with the failure of the first Born approximation to
yield the correct differential excitation cross section at large scattering
angles. This method involved using a two-potential modification of the
first Born approximation and did indeed give much improved results at
large scattering angles.
Various forms of distorted-wave approximation have been used to in-
vestigate the excitation cross sections in helium. Parcell, McEachran and
Stauffer (1983, 1987) used this approximation to investigate the 2
1
S and
2
1
P excitation of helium over the energy range from near the threshold
up to 150 eV. Their results for the 2
1
S excitation were found to be in
rather poor agreement with the corresponding experimental results of
Sueoka (1982), which prompted Parcell, McEachran and Stauffer (1987)
to question whether these measurements were for this transition alone,
220 5 Excitation and ionization
as had been claimed. Other studies involving the use of some form of
the distorted-wave approximation were made by Madison and Winters
(1983), who applied both first and second order methods, and by Ku-
mar, Srivastava and Tripathi (1985) and Srivastava, Kumar and Tripathi
(1986).
Excitation cross sections for helium have also been obtained using
various forms of the coupled-state approximation, both with and without
the inclusion of positronium terms in the expansion of the wave function.
Willis and McDowell (1982) used a five-term expansion but omitted all
positronium states, whereas Hewitt, Noble and Bransden (1992a) in-
cluded both helium and positronium states but used a simple equivalent
one-electron model for the helium atom. The latter
authors found that the
effect of introducing the positronium states was to lower the cross sections
for positron excitation into the 2
1
S and 2
1
P states, particularly for the
latter state in the energy region below which positronium formation is
most significant. Despite the simplicity of the helium model used, the
sum of the two excitation cross sections obtained by Hewitt, Noble and
Bransden is in reasonable accord with the experimen
tal results of Mori
and Sueoka (1994) at energies below 36 eV but becomes 50% larger than
the experimental results at higher energies, albeit with a similar energy
dependence. The most accurate coupled-state results for the excitation
of helium to the 2
1
P state are probably those obtained by Campbell
et al. (1998a) in the course of comprehensive investigations of low and
intermediate energy positron–helium scattering. Using an expansion of
the wave function comprising the first three eigenstates of positronium
and 24 states of the helium atom, these authors found that the 2
1
P
excitation cross section initially rose quite steeply and then retained a
fairly constant value of approximately 0.2πa
2
0
up to 150 eV, the highest
energy considered. These results are in reasonably good agreement with
experiment throughout the energy range. The experimental results are
believed to relate to the sum of the 2
1
S and the 2
1
P excitation cross
sections, but the former cross section is expected to be much smaller
than the latter. Unlike in positron–alkali atom scattering, where resonant
excitation provides the dominant contribution to the total scattering cross
section in the intermediate energy range, this cross section for helium only
contributes approximately 20% of the total, the dominant contribution
now coming from ionization.
Among other methods employed to investigate positron impact excita-
tion of helium, mention should be made of the random-phase approx-
imation used by Ficocelli Varracchio (1990), the results of which are
in best overall agreement with the data of Mori and Sueoka (1994).
This approximation was also used by Ficocelli Varracchio and Parcell
(1992) to determine the 3
1
P excitation cross section, which was found to
5.1 Excitation 221
be intermediate in value between the 2
1
S and the 2
1
P excitation cross
sections and to have a similar energy dependence.
The excitation of neon in the energy range up to 40 eV was investi-
gated by Parcell, McEachran and Stauffer (1990) using a similar form
of distorted-wave approximation to that used by these same authors for
helium. Their results for the resonant excitation cross section are in rea-
sonably good agreement with the measurements of Coleman et al. (1982),
though they are significantly lower than those of Mori and Sueoka (1994).
However, the latter may contain contributions from several excited states
of the atom.
2 Experiment
There are few reported experimental studies
of reaction (5.1), and most
have used a time-of-flight (TOF) energy-loss technique rather than de-
tecting the de-excitation photon which may be emitted after the collision.
The only exception is the work of Laricchia, Charlton and Griffith (1988)
on simultaneous positronium formation and excitation of the remnant
ion in positron scattering by CO
2
and N
2
O, as reported in section 4.5.
Many important atomic transitions result in the emission of photons in
the ultraviolet region of the electromagnetic spectrum; these, though are
difficult to detect. Even in the cases where strong optical transitions are
expected (e.g. the so-called resonance lines of the alkali metals), there has
been no reported work.
The experimental arrangement of Coleman and Hutton (1980) and
Coleman et al. (1982) was a modified version of that described in sec-
tion 3.4 and used by Coleman and McNutt (1979) to make the first mea-
surements of differential positron–argon elastic scattering cross sections.
A positron beam of the desired energy, produced using a tungsten mesh
moderator, was guided by an axial magnetic field. Detection at the end
of the flight path was accomplished using a channeltron, and the TOF
of the positrons was determined using the technique of Coleman, Griffith
and Heyland (1973) (see e.g. section 2.3). A large pressure gradient was
maintained between a short gas cell, which was located at the beginning
of the flight path, and the remainder of the chamber, so that over 99% of
the scattering took place in the cell.
Those positrons which had undergone inelastic collisions, by virtue of
either process (5.1) or process (5.2), would have times of arrival at the
channeltron that were delayed, the delay being determined by both ∆E
and the angle of scattering θ. The ability to resolve individual transitions,
and to separate excitation events from those due to ionization and large-
angle elastic scattering, would obviously depend upon these parameters
and upon experimental considerations such as the timing resolution, the
222 5 Excitation and ionization
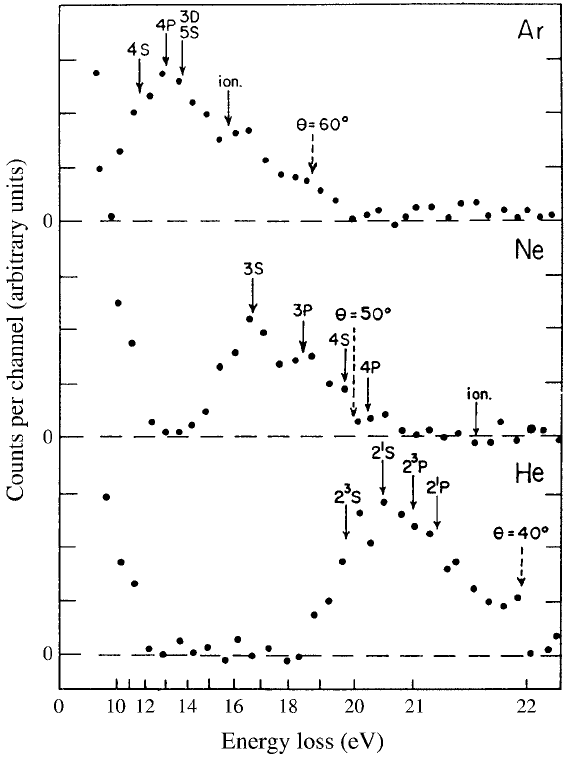
Fig. 5.3. Energy-loss spectra for inelastic positron scattering from helium, neon
and argon gases at 24 eV impact energy from Coleman et al. (1982). The arrows
indicate relevant excitation and ionization thresholds.
signal-to-background ratio and the length of the flight path. The work
presented by Coleman and Hutton (1980) and Coleman et al. (1982) used
this technique, as did later studies by Sueoka and coworkers, which were
described in detail by Mori and Sueoka (1994).
Figure 5.3 shows energy-loss spectra derived by Coleman et al. (1982)
from their measured TOF spectra and the geometry of the apparatus,
under the assumption that the scattering took place at θ =0
◦
and in the
centre of the gas cell. The spectra, each of which contains a prominent
5.1 Excitation 223
secondary peak, are for the same incident energy, 24 eV. The energies
of transitions to various excited states are also marked on the spectra
along with, for neon and argon, those at which ionization could occur.
By assuming that the positrons in the secondary peaks had all lost the
same amount of energy, i.e. ∆E is a constant, so that any increased
TOF is due to angular deflection, the maximum scattering angles were
estimated to be between 30
◦
and 50
◦
, the mean value of θ being much
lower. Coleman et al. (1982) performed a systematic check which ruled
out the possibility that the secondary peaks were caused by positrons
which had back-scattered in the gas cell and then been reflected by the
moderator potential.
However, the shapes and positions of the peaks suggest that they are
caused by positrons which have undergone energy loss in an inelastic
collision and have suffered deflection into a narrow range of small forward
angles. Coleman et al. (1982) noted that even at energies up to ∼5eV
above E
i
the energy-loss peak appears to be solely due to positrons which
have undergone a collision of the type (5.1). The energy-loss values, which
correspond to the peak of each spectrum, were found to be independent
of impact energy and to be given by 20.6 ± 0.2 eV (He), 16.6 ± 0.3eV
(Ne) and 12.5 ± 0.3 eV (Ar). For helium, this suggests that the 2
1
S level
is responsible. However, it should be noted that it is difficult to separate
higher singlet levels from the 2
1
S level since the larger apparent energy
loss associated with an enhanced TOF may be in fact the result of a
positron being scattered through an angle θ>0
◦
.
In neon the observed peak at ∆E = 16.6 eV seems to be dominant,
though some of the spectra obtained by Coleman et al. (1982) contained
extra structure; this consisted of a second peak appearing at a TOF
corresponding to ∆E = 18.5 eV, which is close to that expected for 3P
excitation. For argon, the measured ∆E of 12.5 eV is somewhat above
the threshold for excitation at 11.6 eV (4S); however, this could still be
consistent with significant contributions from this level, accompanied by
some angular deflection, and from the 4P level (∆E = 13.1 eV). It is clear
that more detailed work, with finer energy resolution, is necessary before
contributions from individual states can be resolved.
Total cross sections for inelastic scattering, written here as σ
inel
since
they may contain contributions from several excitation channels and, at
certain energies, ionization, were deduced by summing all the events in
the secondary peak, N
inel
. Assuming no multiple scattering in the target,
σ
inel
is related to the total scattering cross section σ
T
by
σ
inel
= N
inel
σ
T
/N
scatt
, (5.5)
where N
scatt
, the total number of scattered positrons, was determined,
as described by Coleman et al. (1982), by comparing beam intensities
224 5 Excitation and ionization
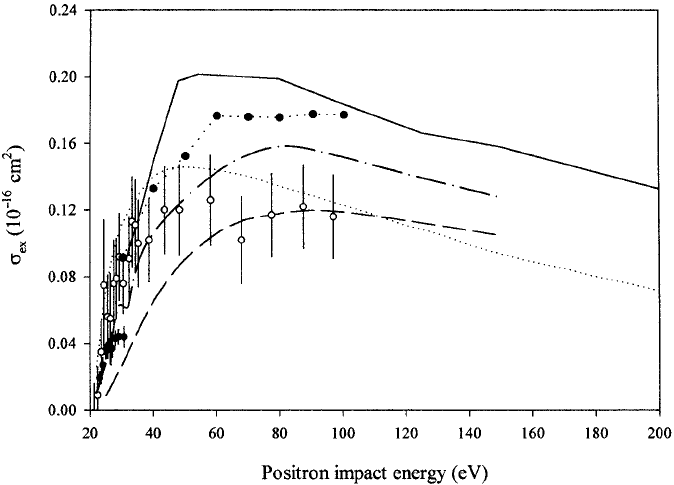
Fig. 5.4. Excitation cross sections for positron–helium scattering. Experiment:
•, Coleman et al. (1982); ◦, Mori and Suoeka (1994). Theory: ——, Hewitt,
Noble and Bransden (1992a); ·····, Ficocelli Varracchio and Parcell (1992);
– – –, Parcell et al. (1987); — · —, Campbell et al. (1998a); ··•··, semi-empirical
data for excitation of singlet states only by electron impact, de Heer and Jansen
(1977).
recorded with and without gas present in the scattering chamber. An
equivalent expression was also given by Mori and Sueoka (1994).
Excitation cross sections obtained by Coleman et al. (1982) for energies
up to 10 eV above threshold are shown in Figure 5.4 for helium gas.
In this range of kinetic energies the excitation signal was found to be
distinguishable from that due to ionization, so that σ
inel
≈ σ
ex
. Coleman
et al. (1982) applied small corrections to these data for multiple scattering
effects. The errors shown are both statistical and systematic in nature,
the latter arising at higher energies from the difficulties of separating the
tail of the primary (unscattered) peak from the inelastic events.
Also shown in Figure 5.4 are the data of Mori and Sueoka (1994),
which supersede those reported earlier by the same group. Their TOF
spectrometer was approximately four times the length of that employed
by Coleman et al. (1982); this helped extend the impact energy range to
around 100 eV. At such energies it is necessary to consider the transport
properties of the beam as parameterized by a ‘transmission factor’ which
5.1 Excitation 225
reflects the ability of the magnetic field to confine scattered positrons so
that they are detected and which is a strong function of their kinetic
energy and scattering angle. As an example, the positron transmission
factor at an energy of 100 eV is about 0.3 for θ =15
◦
but falls to practically
zero by 30
◦
. Clearly the cross sections measured by this technique depend,
to some extent, upon the details of the relevant differential cross section.
In addition, the method used by Mori and Sueoka (1994) to separate
events due to excitation and ionization does not seem to be unambiguous,
and since the cross section for the latter is up to four times that for
excitation, at some energies, there are potentially large systematic errors.
Given the experimental limitations regarding the angular range and the
lack of timing and energy resolution, it might appear that little meaningful
comparison with theory could be achieved. The situation is shown in
Figure 5.4, where the results of several calculations are given. The values
of Ficocelli Varracchio and Parcell (1992) and Campbell et al. (1998a)
are in best overall accord with experiment, and these are dominated by
excitation to the 2
1
P level, contrary to the findings of Coleman et al.
(1982) described above. Comparison was also made with cross sections
for electron impact using data taken from the semi-empirical work of de
Heer and Jansen (1977). The positron data are lower than those for
electrons, at least for energies above 30–40 eV.
Cross sections for neon and argon have also been presented by Coleman
et al. (1982) and Mori and Sueoka (1994), though here there are no
theoretical data for comparison. The positron and electron cross sections
(the latter from the work of de Heer, Jansen and van der Kaay, 1979) are
of very similar magnitude, despite the fact that triplet states cannot be
excited by positron impact.
In addition to the work on atoms, the study of Katayama, Sueoka
and Mori (1987) produced cross sections attributable to excitation of the
O
2
molecule by positron impact. The TOF apparatus and the method
of analysis were similar to those described above. However, for O
2
a
secondary peak was found which, when allowances were made for the
energy width of the beam and for positrons which had been scattered
through large angles, was concentrated in an energy-loss interval ∆E ∼ 7–
10 eV. From work on electron and photon impact, this is known to be due
to excitation of the Schumann–Runge continuum, an important optically
allowed feature in the spectrum of O
2
. As such, and following Katayama
et al. (1987), we denote the derived cross sections as σ
SR
.
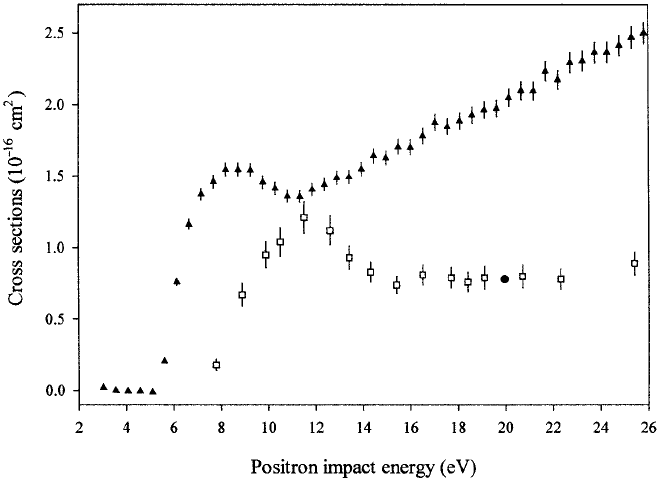
Figure 5.5 shows σ
SR
along with the electron impact result of Wakiya
(1978) obtained by integrating his differential cross sections for forward-
scattered electrons only. An interesting feature of the positron data is
the presence of a distinct peak just above the threshold, which rises to a
maximum at around 12 eV. Katayama et al. (1987) speculated that this is
226 5 Excitation and ionization
Fig. 5.5. Inelastic scattering cross
sections for positron–O
2
collisions. Key:
,
σ
SR
for positron impact, Katayama et al. (1987); •, σ
SR
for electron impact, a
single point, Wakiya (1978); , total ion production cross sections (see text),
Laricchia, Maxom and Charlton (1993).
a resonance-type contribution to σ
SR
which is absent in the electron case.
Note that the cross sections σ
SR
for the two projectiles are similar above
approximately 16 eV, a fact which prompted Katayama et al. (1987) to
postulate further that there are ‘direct’ and ‘resonant’ (positrons-only)
contributions to the cross section.
Katayama et al. (1987) offered a possible explanation of the ‘resonance’
by postulating that the positron can become temporarily attached to the
molecule, forming a PsO
+
2
complex. However, another possible explana-
tion was forthcoming from the work of Laricchia, Moxom and Charlton
(1993), who studied the total ion production cross section, i.e. the sum
of the ionization and positronium formation cross sections. Their data
are also included in Figure 5.5, and their technique has been described
in detail by Moxom et al. (1994). Between the energies E
Ps
and E
i
the
total ion yield is due solely to positronium formation and, as shown in
Figure 5.5, a distinct peak was found in σ
Ps
a few eV above threshold.
The total ion formation cross section rises again at impact energies above
E
i
in such a way that the observed trough appears to coincide with
the peak in σ
SR
, which also rises rapidly from threshold but falls once
5.2 Ionization – theoretical considerations 227
the ionization channel opens. This led Laricchia, Moxom and Charlton
(1993) to postulate that the structure in these cross sections is due to
a channel-coupling effect; however, it is still possible, as envisaged by
Katayama et al. (1987), that these structures arise from the formation of
a temporary complex involving the positron.
5.2 Ionization – theoretical considerations
In single ionization of a target by positron impact the total energy of the
system in excess of the ionization threshold is shared between the two
emerging particles, provided that the recoil energy of the residual ion is
ignored. If E
1
and E
2
are the energies of the positron and electron re-
spectively, and E is the energy of the incident positron, then conservation
of the total energy gives the relationship between these quantities as
E = E
1
+ E
2
− E
i
, (5.6)
where E
i
is the ionization energy of the target system. Thus, for a
given incident positron energy, the energy of the emerging electron is
determined uniquely by that of the scattered positron. The probability
that the positron will emerge from the ionizing collision into the solid angle
dΩ
1
with an energy in the range E
1
to E
1
+ dE
1
and that the electron
will emerge into the solid angle dΩ
2
is given by the triple differential
cross section d
3
σ
i
/dΩ
1
dΩ
2
dE
1
. The total ionization cross section is then
obtained by integrating the differential cross section over all directions of
the two emerging particles and the energy of either one of them.
In electron impact ionization it is not possible to determine which of
the two emerging electrons was the incident projectile and which was
originally bound in the target. The total wave function of the system
should be antisymmetrized with respect to the coordinates of all the
electrons and therefore no clear distinction can be made between the
‘direct’ and ‘exchange’ amplitudes. In positron impact ionization the dis-
tinguishability of the incident positron from the emerging electron avoids
any such difficulties. Positron impact ionization, however, is complicated
by the fact that the open positronium formation channels also result in
the removal of an electron from the target atom or molecule. At incident
positron energies several hundred eV above the ionization energy of the
target system it is easy to distinguish between positronium formation and
ionization: the two emerging particles are likely to have very different
energies and momenta, and the positronium formation cross section is
much smaller than the ionization cross section. However, at energies close
to the ionization threshold of the target no clear distinction can be made
between ionization in the usual sense and positronium formation into
228 5 Excitation and ionization
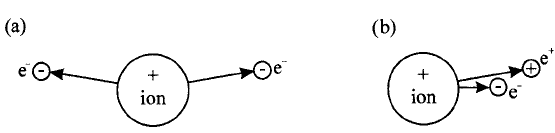
Fig. 5.6. Depiction of near-threshold (a) electron impact ionization and (b)
positron impact ionization.
highly excited or continuum states. In both processes the two emerging
particles experience an attractive final-state interaction giving rise to
highly correlated motion. There must therefore remain some doubt about
the validity of treatments of ionization which claim that a clear distinction
can be made between ‘true’ ionization, in the sense of electron ionization,
and the formation of positronium into very highly excited, or continuum
states.
In the classical treatment of near-threshold electron impact ionization
developed by Wannier (1953), the repulsion between the two electrons
causes them to emerge with very similar energies but in opposite directions
along the so-called Wannier ridge. This effect is depicted in Figure 5.6,
where it is contrasted with the case for positron impact described below.
According to this theory the energy dependence of the ionization cross
section for electron impact is predicted to be
σ
i
∝ E
1.127
e
, (5.7)
where E
e
= E−E
i
is the energy of the projectile in excess of the ionization
threshold energy. What cannot be predicted from the theory, however,
is the value of the constant of proportionality or the energy range over
which this equation is valid.
Klar (1981) derived a threshold law for positron impact ionization using
similar classical ideas to those of Wannier. The potential energy function
for the system consisting of the positron, electron and residual ion has an
unstable saddle structure, and ionization corresponds to trajectories along
the Wannier ridge in the potential energy. The positron then emerges in
a similar direction to that of the electron, the ratio of the distances of the
positron and the electron from the residual ion being approximately 2.15.
Trajectories of the system which leave the ridge correspond either to exci-
tation of the target, when the ratio of the positron distance from the ion
to the electron distance from the ion tends to infinity, or to positronium
formation, when this ratio is approximately 1.0. Klar’s theory predicts
an energy dependence for the ionization cross section of the form
σ
i
∝ E
2.651
e
. (5.8)