Coburn J.W. Algebra and Trigonometry
Подождите немного. Документ загружается.

1000 CHAPTER 10 Analytic Geometry and the Conic Sections 10-82
parametric terms. For the projectile’s location P(x, y) and any time t in seconds, the
x-coordinate (horizontal distance from point of projection) is given by
where v
0
is the initial velocity in feet per second and t is the time in seconds. The
y-coordinate (vertical height) is
EXAMPLE 7
Using Parametric Equations in Projectile Applications
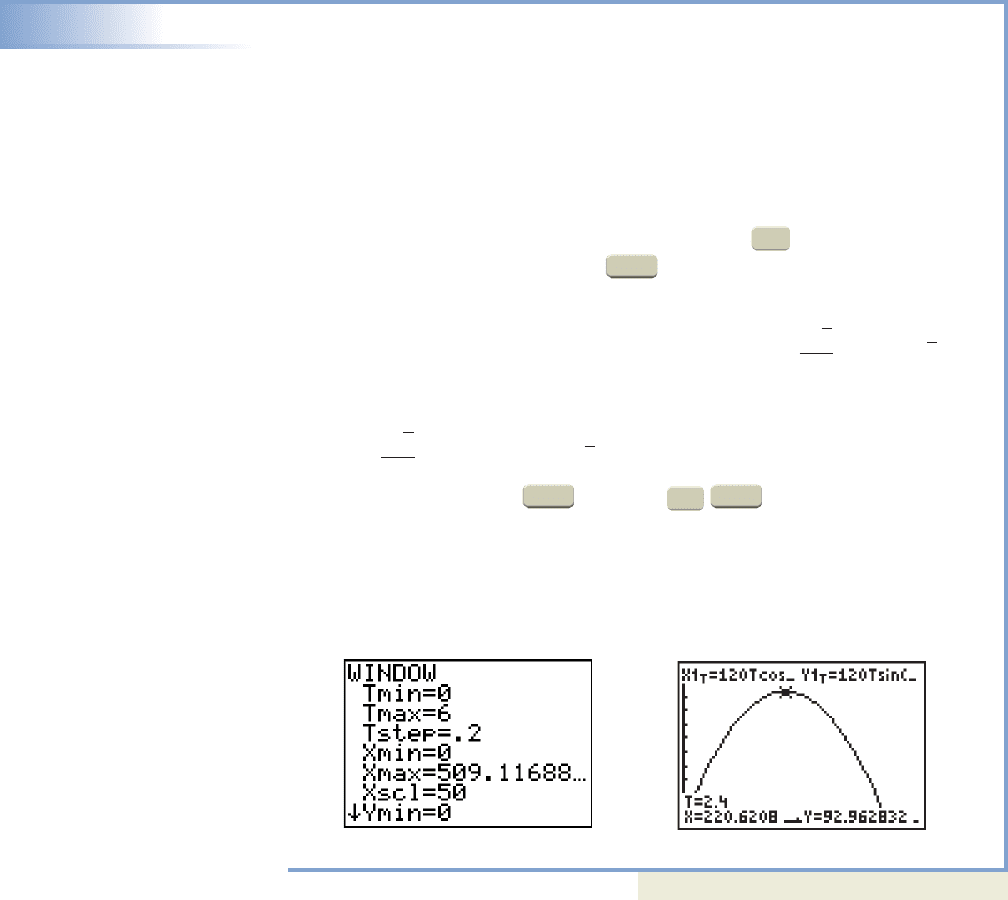
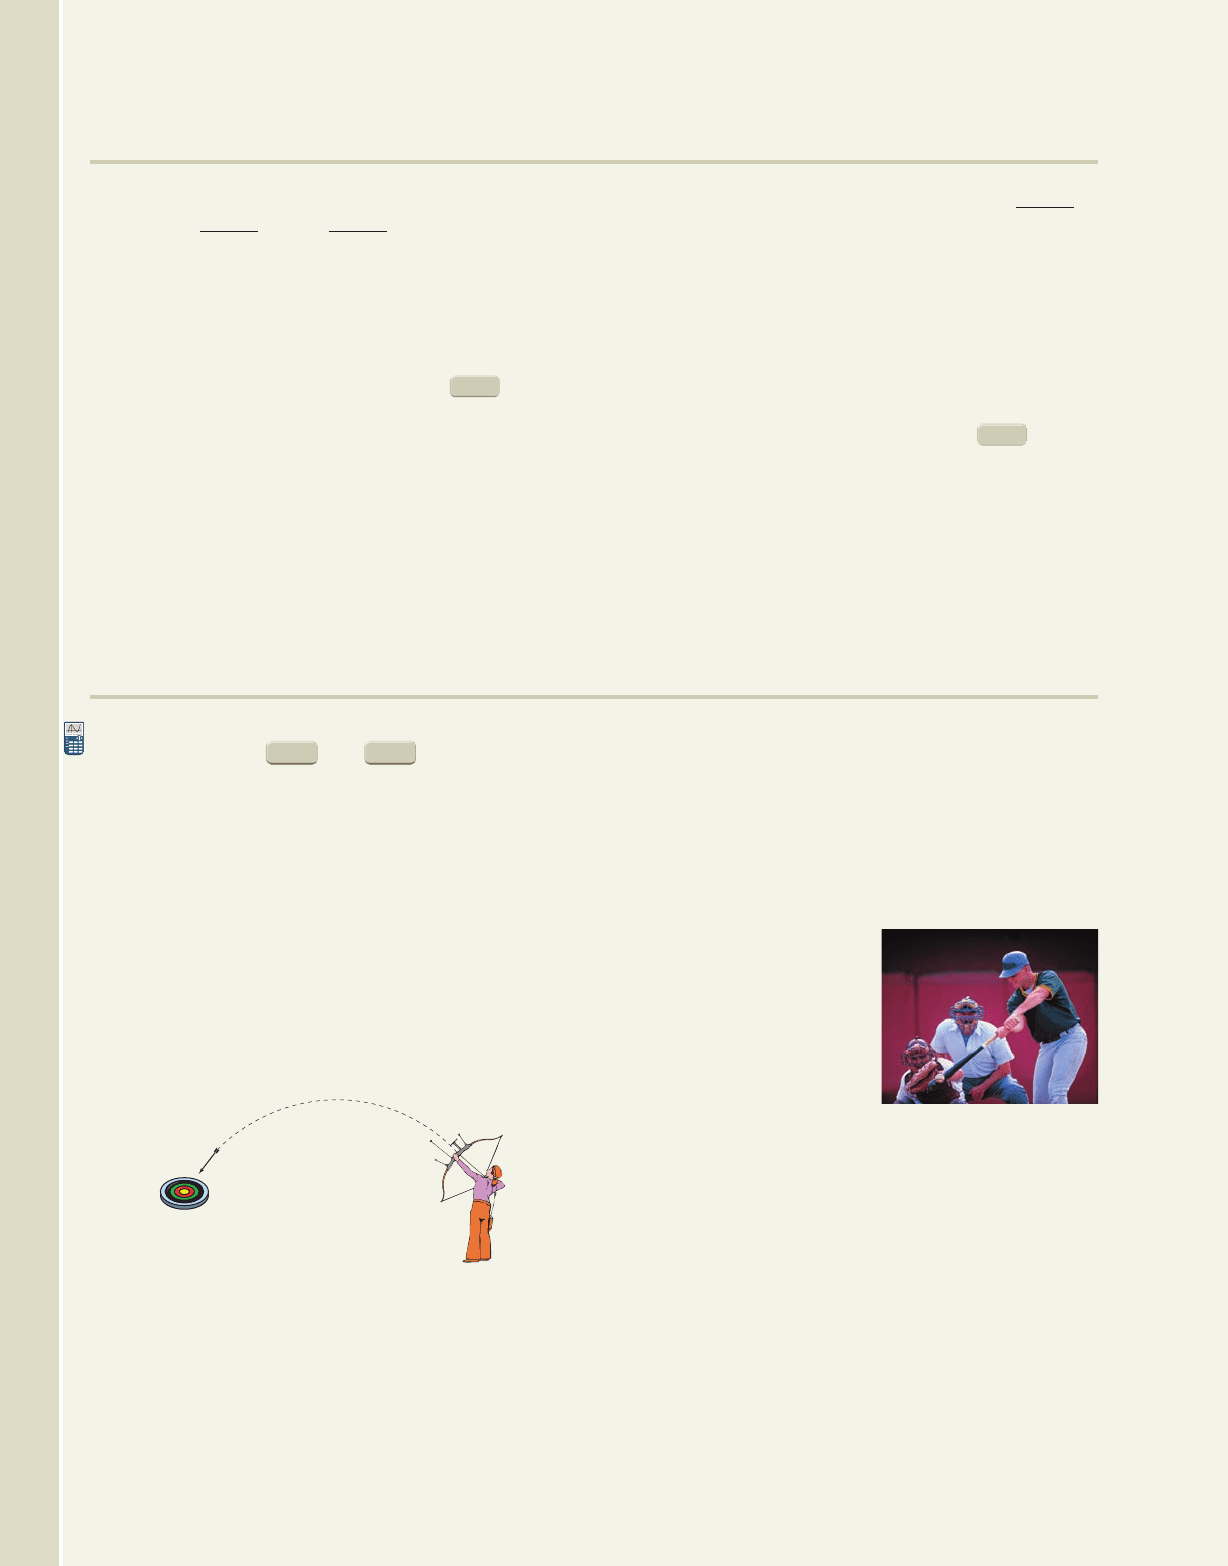
As part of a circus act, Karl the Human Cannonball is shot out of a specially
designed cannon at an angle of with an initial velocity of 120 ft/sec. Use a
graphing calculator to graph the resulting parametric curve. Then use the graph to
determine how high the Ring Master must place a circular ring for Karl to be shot
through at the maximum height of his trajectory, and how far away the net must be
placed to catch Karl.
Solution
The information given leads to the equations and
Enter these equations on the screen of your
calculator, remembering to reset the to degrees (circus clowns may not
know or understand radians). To set the window size, we can use trial and error, or
estimate using (instead of ) and an estimate for t (the time that Karl
will stay aloft). With we get estimates of for
the horizontal distance. To find a range for y, use since the maximum height
of the parabolic path will occur halfway through the flight. This gives an estimate
of for y. The results are shown in Figures
10.72 and 10.73. Using the feature or (TABLE) feature, we find
the center of the net used to catch Karl should be set at a distance of about 450 ft
from the cannon, and the ring should be located 220 ft from the cannon at a height
of about 93 ft.
Now try Exercises 46 through 49
It is well known that planets orbit the Sun in elliptical paths. While we’re able to
model their orbits in both rectangular and polar form, neither of these forms can give
a true picture of the direction they travel. This gives parametric forms a great advan-
tage, in that they can model the shape of the orbit, while also indicating the direction
of travel. We illustrate in Example 8 using a “planet” with a very simple orbit.
GRAPH
2nd
TRACE
120132a
12
2
b 16192 18012 144
t 3
x 120162a
12
2
b 36012t 6
40° 45°
MODE
Y =
y 120t sin 40° 16t
2
.
x 120t cos 40°
40°
y v
0
t sin 16t
2
.
x v
0
t cos ,
0
100
5090
Figure 10.72
Figure 10.73
College Algebra & Trignometry—
cob19529_ch10_0995-1006.qxd 12/6/08 12:52 AM Page 1000 epg HD 049 :Desktop Folder:Satya 05/12/08:
10-83 Section 10.7 Parametric Equations and Graphs 1001
College Algebra & Trignometry—
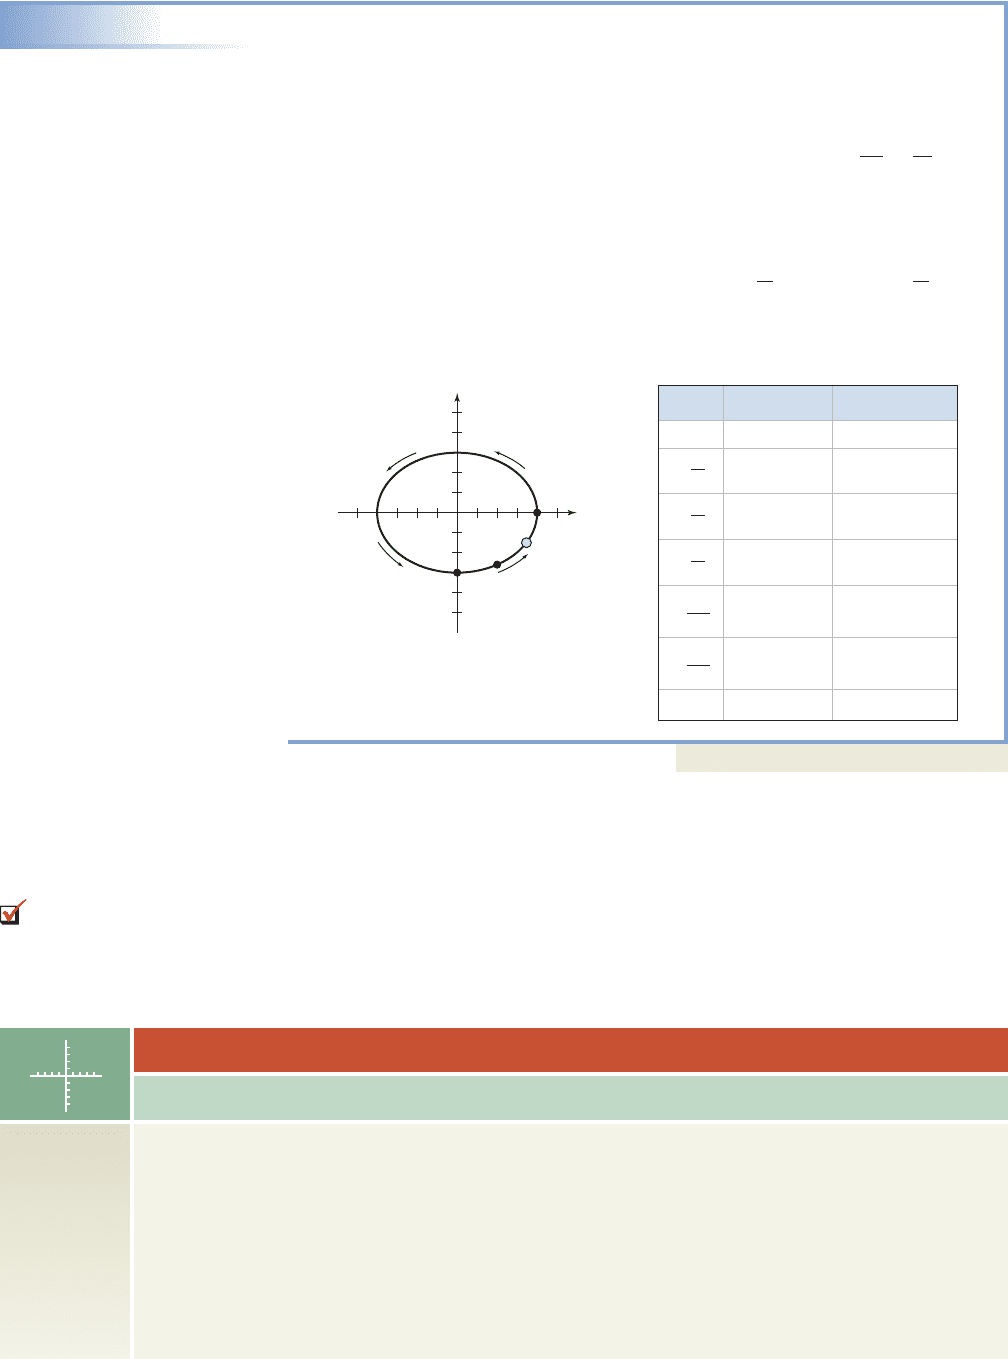
EXAMPLE 8
Modeling Elliptical Orbits Parametrically
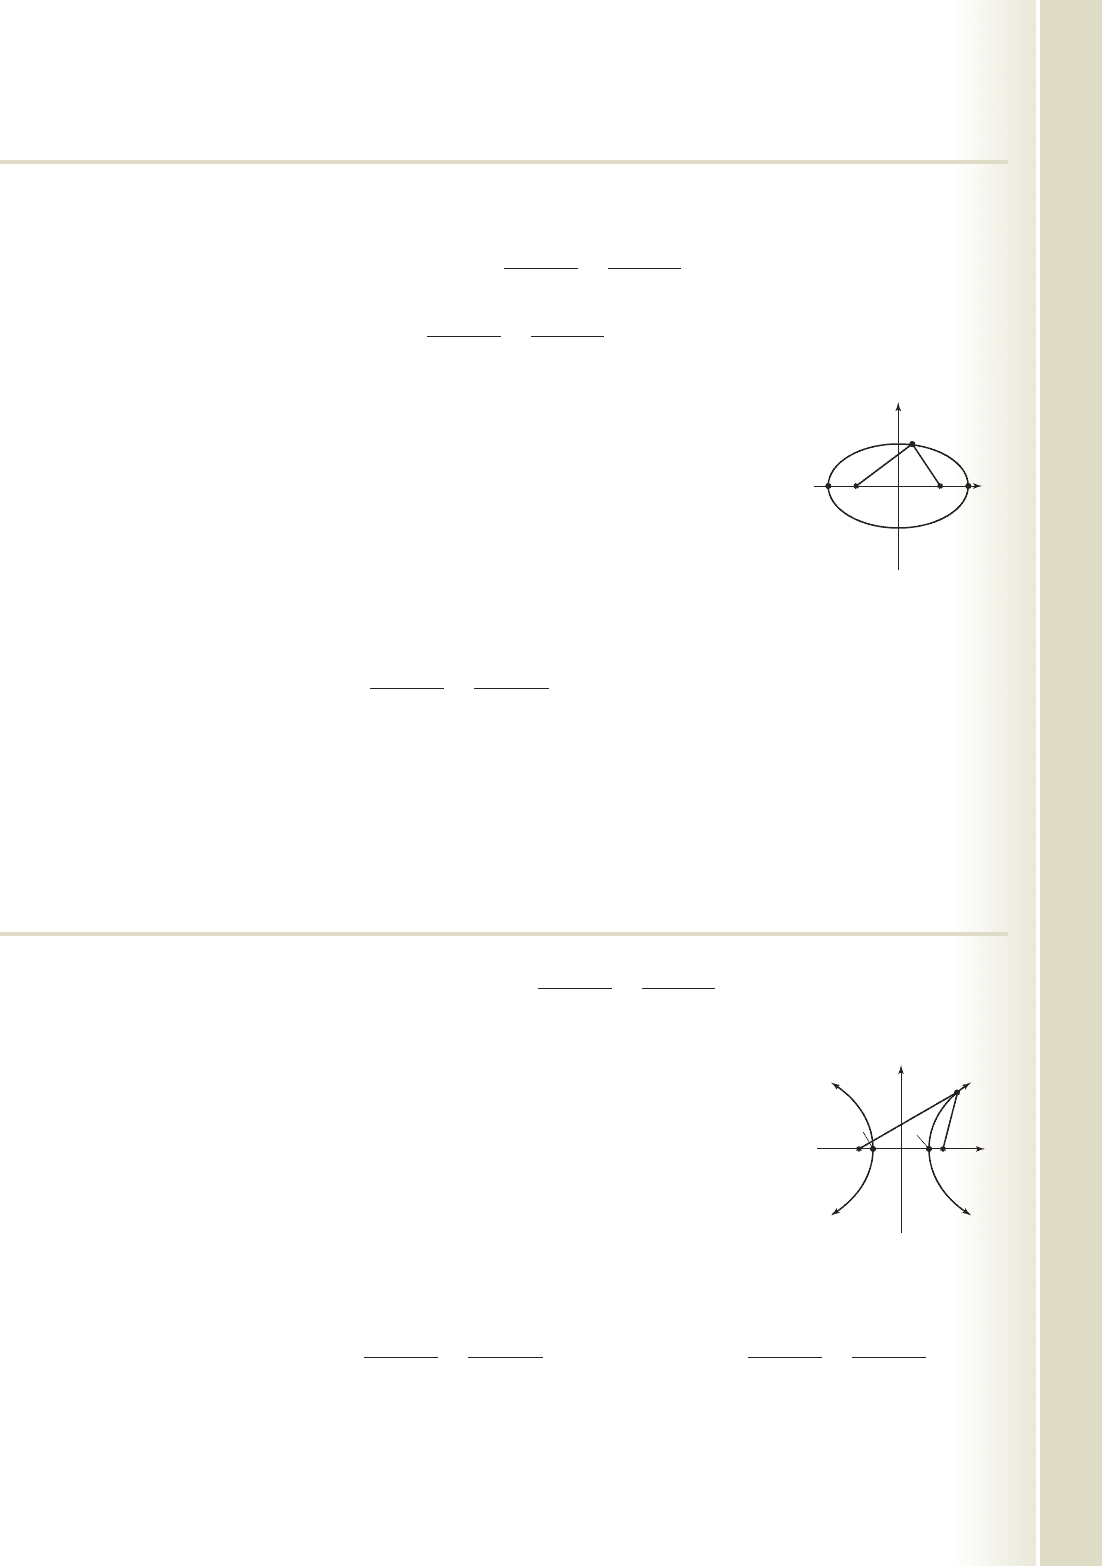
The elliptical orbit of a certain planet is defined parametrically as and
. Graph the orbit and verify that for increasing values of t, the planet
orbits in a counterclockwise direction.
Solution
Eliminating the parameter as in Example 4, we obtain the equation ,
or the equation of an ellipse with center at (0, 0), major axis of length 8, and minor axis
of length 6. The path of the planet is traced out by the ordered pairs (x, y) generated by
the parametric equations, shown in the table for . Starting at P(x, y)
begins at with x and y both increasing until . Then from to
continues to increase as x decreases, indicating a counterclockwise orbit in
this case. The orbit is illustrated in the figure.
Now try Exercises 50 and 51
Finally, you may recall from your previous work with linear systems, that
a dependent system occurs when one of the three equations is a linear combination of
the other two. The result is a system with more variables than equations, with solu-
tions expressed in terms of a parameter, or in parametric form. These solutions can be
explored on a graphing calculator using ordered triples of the form (t, f(t), g(t)), where
and (see Exercises 52 through 55). For more information, see the
Calculator Exploration and Discovery feature on page 1012.
Y
2
g1t2Y
1
f1t2
3 3
t , y
t
2
t
2
10, 32
t 0,t 30, 4
x
2
16
y
2
9
1
y 3 cos t
x 4 sin t
x
(4, 0)
(0, 3)
(2, 2.6)
(3.46, 1.5)
y
t
00 3
2
2.6
3.46 1.5
4
0
3.46
1.5
2
2.6
03
5
6
2
3
2
3
6
y 3 cos tx 4 sin t
D. You’ve just learned how
to solve applications involving
parametric equations
Exploring Parametric Graphs
TECHNOLOGY HIGHLIGHT
Most graphing calculators have features that make it easy (and fun) to explore parametric equations.
For example, the TI-84 Plus can use a circular cursor to trace the path of the plotted points, as they are
generated by the equations. This can be used to illustrate the path of a projectile, the distance of a
runner, or the orbit of a planet. Operations can also be applied to the parameter T to give the effect of
“speed” (the points from one set of equations are plotted faster than the points of a second set). To
help illustrate their use, consider again the simple, elliptical orbit of a planet in Example 8. Physics tells
us the closer a planet is to the Sun, the faster its orbit. In fact, the orbital speed of Mercury is about
twice that of Mars and about 10 times as fast as the dwarf planet Pluto (29.8, 15, and 2.9 mi/sec,
cob19529_ch10_0995-1006.qxd 12/6/08 12:52 AM Page 1001 epg HD 049 :Desktop Folder:Satya 05/12/08:
1002 CHAPTER 10 Analytic Geometry and the Conic Sections 10-84
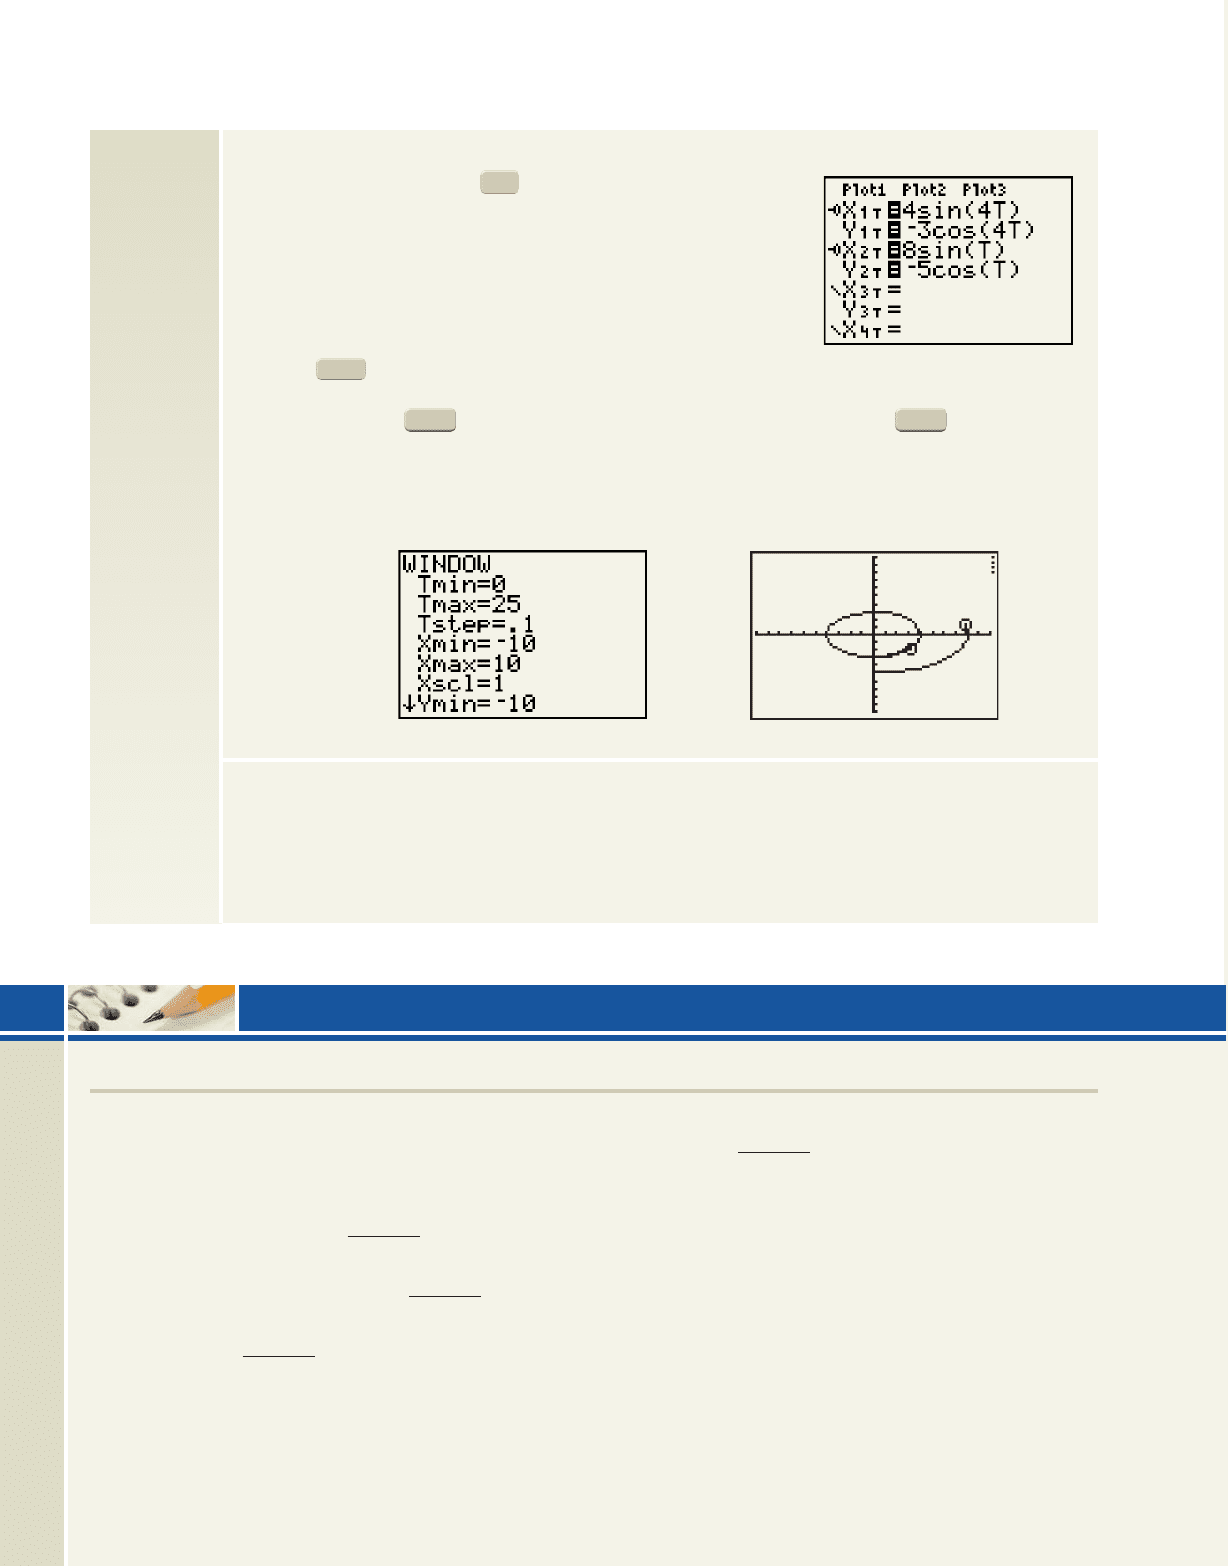
respectively). With this information, we can explore a number of
interesting questions. On the screen, let the orbits of Planet 1
and Planet 2 be modeled parametrically by the equations shown in
Figure 10.74. Since the orbit of Planet 1 is “smaller” (closer to the
Sun), we have T-values growing at a rate that is four times as fast as
for Planet 2. Notice to the far left of X
1T
, there is a symbol that looks
like an old key “ ” By moving the cursor to the far left of the
equation, you can change how the graph will look by repeatedly
pressing . With this symbol in view, the calculator will trace
out the curve with a circular cursor, which in this case represents the planets as they orbit (be sure you
are in simultaneous ). Setting the window as in Figure 10.75 and pressing produces
Figure 10.76, which displays their elliptical paths as they race around the Sun. Notice the inner planet
has already completed one orbit while the outer planet has just completed one-fourth of an orbit.
Exercise 1: Verify that the inner planet completes four orbits for every single orbit of the outer planet.
Exercise 2: Suppose that due to some cosmic interference, the orbit of the faster planet begins to decay
at a rate of T
0.84
(replace T with T
0.84
in both equations for the inner planet). By observation, about how
many orbits did the inner planet make for the first revolution of the outer planet? What is the ratio of orbits
for the next complete orbit of the outer planet?
GRAPH
MODE
ENTER
0.
Y =
Figure 10.75
Figure 10.76
10
10
10
10
CONCEPTS AND VOCABULARY
Fill in each blank with the appropriate word or phrase.
Carefully reread the section if needed.
1. When the coordinates of a point (x, y) are
generated independently using and
, t is called a(n) .
2. The equations and used to generate
the ordered pairs (x, y) are called equations.
3. Parametric equations can both graph a curve and
indicate the traveled by a point on the
curve.
y g1t2x f 1t2
y g1t2
x f 1t2
4. To write parametric equations in rectangular form,
we must the parameter to write a single
equation.
5. Discuss the connection between solutions to
dependent systems and the parametric equations
studied in this section.
6. In your own words, explain and illustrate the
process used to develop the equation of a cycloid.
Illustrate with a specific example.
10.7 EXERCISES
Figure 10.74
College Algebra & Trignometry—
cob19529_ch10_0995-1006.qxd 12/30/08 23:49 Page 1002
10-85 Section 10.7 Parametric Equations and Graphs 1003
College Algebra & Trignometry—
The curves defined by the following parametric
equations are from the cycloid family. (a) Use a graphing
calculator or computer to draw the graph and (b) use the
graph to approximate all x- and y-intercepts, and
maximum and minimum values to one decimal place.
27.
hypocycloid (5-cusp)
28.
hypocycloid (3-cusp)
29. serpentine curve
30. cissoid of Diocles
31.
involute of a circle
32.
evolute of an ellipse
33. curtate cycloid
34. prolate cycloid
35.
nephroid
Use a graphing calculator or computer to draw the
following parametrically defined graphs, called Lissajous
figures (Exercise 37 is a scaled version of the initial
example from this section). Then find the dimensions of
the rectangle necessary to frame the figure and state the
number of times the graph crosses itself.
36. 37.
38. 39.
40. 41.
42. Use a graphing calculator to experiment with
parametric equations of the form and
Try different values of A, B, m, and
n, then discuss their effect on the Lissajous figures.
43. Use a graphing calculator to experiment with
parametric equations of the form and
Try different values of a and b,
then discuss their effect on the resulting graph,
called a serpentine curve. Also see Exercise 29.
y b sin t cos t.
x
a
tan t
y B cos1nt2.
x A sin1mt2
y 10 cos12.5t2y 10 cos13t2
x 10 sin11.5t2x 8 sin14t2
y 7 cos14t2y 10 cos t
x 5 sin17t2x 8 sin14t2
y 8 cos ty 8 cos t
x 6 sin12t2x 6 sin13t2
x 233 cos t cos13t24, y 233 sin t sin13t24,
x t 3 sin t, y 1 3 cos t,
x 3t sin t, y 3 cos t,
4x 116 362cos
3
t, 6y 116 362sin
3
t,
x 21cos t t sin t2, y 21sin t t cos t2,
x 8 sin
2
t, y
8 sin
3
t
cos t
,
x
2
tan t
, y 8 sin t cos t,
x 8 cos t 4 cos12t2, y 8 sin t 4 sin12t2,
x 8 cos t 2 cos14t2, y 8 sin t 2 sin14t2,
DEVELOPING YOUR SKILLS
For Exercises 7 through 18, (a) graph the curves defined
by the parametric equations using the specified interval
and identify the graph (if possible) and (b) eliminate the
parameter (Exercises 7 to 16 only) and write the
corresponding rectangular form.
7.
8.
9.
10.
11.
12.
13.
14.
15.
16.
17.
18.
Write each function in three different parametric forms
by altering the parameter. For Exercises 19–22 use at least
one trigonometric form, restricting the domain as needed.
19. 20.
21. 22.
23. 24.
25. Use a graphing calculator or computer to verify
that the parametric equations from Example 5 all
produce the same graph.
26. Use a graphing calculator or computer to verify
that your parametric equations from Exercise 21 all
produce the same graph.
y sin12x 12y tan
2
1x 22 1
y 21x 52
2
1y 1x 32
2
1
y 0.5x 6y 3x 2
y 3 cos t
x tan
2
t; t
2
, t 30, 4
y 5 sin12t2
x
3
tan t
; t 10, 2
y 6 sin t
x 4 cos12t2; t c
2
,
3
2
d
y 6 cos t
x 4 sin12t2; t 30, 22
y 3 cos t
x 2 sin t; t 30, 22
y 3 sin t
x 4 cos t; t 30, 22
y
t
x
t
3
10
; t 35, 54
y t
2
x
5
t
, t 0; t 33.5, 3.54
y t
2
1
x t
3
3; t 32, 2.54
y 1t 32
2
x 12 t2
2
; t 30, 54
y 2 0.5t
2
x t 3; t 35, 54
y t
2
1
x t 2; t 33, 34
cob19529_ch10_0995-1006.qxd 12/6/08 12:52 AM Page 1003 epg HD 049 :Desktop Folder:Satya 05/12/08:
1004 CHAPTER 10 Analytic Geometry and the Conic Sections 10-86
44. The Folium of Descartes:
The Folium of Descartes is a parametric curve
developed by Descartes in order to test the ability of
Fermat to find its maximum and minimum values.
a. Graph the curve on a graphing calculator with
using a reduced window ( 4), with
and
Locate the coordinates of the tip of the folium
(the loop).
b. This graph actually has a discontinuity (a
break in the graph). At what value of t does
this occur?
c. Experiment with different values of k and
generalize its effect on the basic graph.
Tstep 0.1.Tmin 6, Tmax 6,
ZOOM
k 1
x1t2
3kt
1 t
3
; y1t2
3kt
2
1 t
3
45. The Witch of Agnesi:
The Witch of Agnesi is a parametric curve named by
Maria Agnesi in 1748. Some believe she confused
the Italian word for witch (versiera), with a similar
word that meant free to move. In any case, the name
stuck. The curve can also be stated in trigonometric
form: and
a. Graph the curve with on a calculator or
computer on a reduced window ( 4)
using both of the forms shown with
and Try
to determine the maximum value.
b. Explain why the x-axis is a horizontal
asymptote.
c. Experiment with different values of k and
generalize its effect on the basic graph.
Tstep 0.1.Tmin 6, Tmax 6,
ZOOM
k 1
y 2k sin
2
t.x1t2 2k cot t
x1t2 2kt; y1t2
2k
1 t
2
APPLICATIONS
Model each application using parametric equations,
then solve using the and features of a
graphing calculator.
46. Archery competition: At an archery contest, a
large circular target 5 ft in diameter is laid flat on
the ground with the bull’s-eye exactly 180 yd
(540 ft) away from the archers. Marion draws her
bow and shoots an arrow at an angle of above
horizontal with an initial velocity of 150 ft/sec
(assume the archers are standing in a depression
and the arrow is shot from ground level). (a) What
was the maximum height of the arrow? (b) Does
the arrow hit the target? (c) What is the distance
between Marion’s arrow and the bull’s-eye after
the arrow hits?
47. Football competition:As part of their contribution
to charity, a group of college quarterbacks
participate in a contest. The object is to throw a
football through a hoop whose center is 30 ft high
and 25 yd (75 ft) away, trying to hit a stationary
(circular) target laid on the ground with the center
25°
TRACE
GRAPH
56 yd (168 ft) away. The hoop and target both have
a diameter of 4 ft. On his turn, Lance throws the
football at an angle of with an initial velocity of
75 ft/sec. (a) Does the football make it through the
hoop? (b) Does the ball hit the target? (c) What is
the approximate distance between the football and
the center of the target when the ball hits the
ground?
48. Walk-off home run: It’s
the bottom of the ninth,
two outs, the count is
full, and the bases are
loaded with the opposing
team ahead 5 to 2. The
home team has Heavy
Harley, their best hitter at
the plate; the opposition has Raymond the Rocket
on the mound. Here’s the pitch... it’s hit... a
long fly ball to left-center field! If the ball left the
bat at an angle of with an initial velocity of
112 ft/sec, will it clear the home run fence, 9 ft
high and 320 ft away?
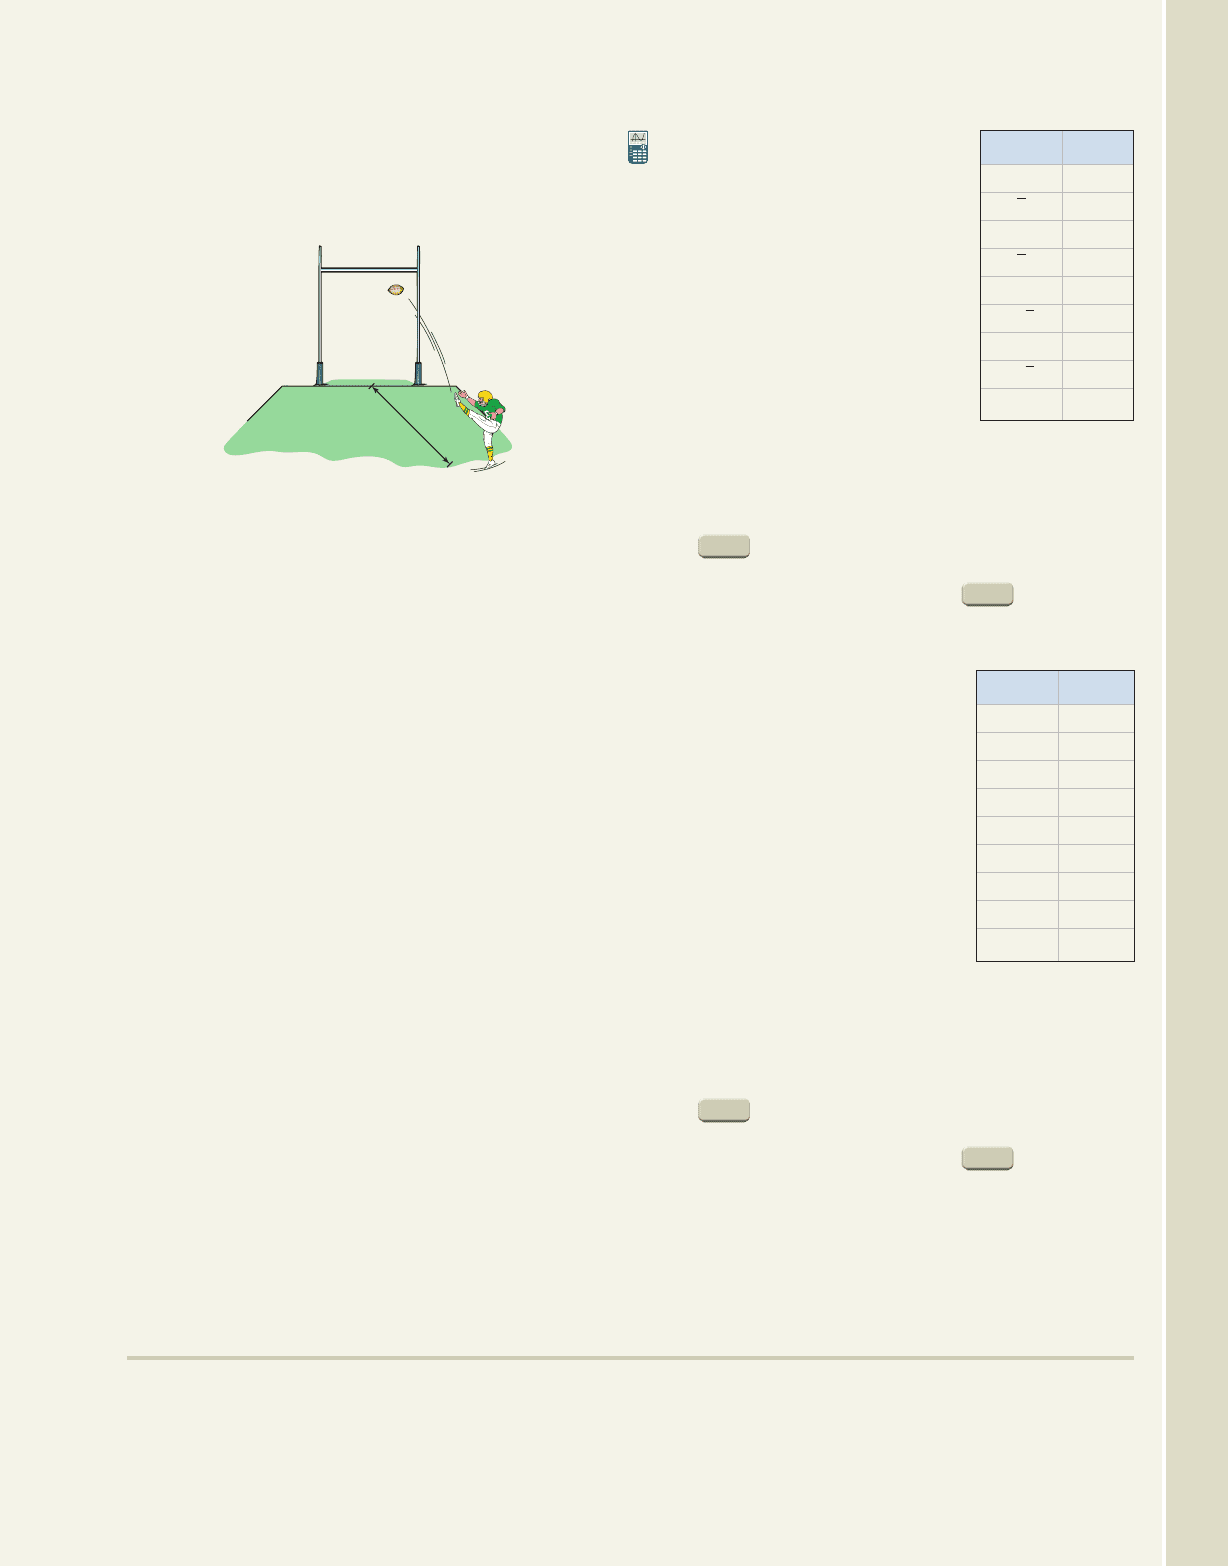
49. Last-second win: It’s fourth-and-long, late in the
fourth quarter of the homecoming football game,
with the home team trailing 29 to 27. The coach
elects to kick a field goal, even though the goal
posts are 50 yd (150 ft) away from the spot of the
kick. If the ball leaves the kicker’s foot at an angle
30°
36°
WORKING WITH FORMULAS
College Algebra & Trignometry—
cob19529_ch10_0995-1006.qxd 12/6/08 12:52 AM Page 1004 epg HD 049 :Desktop Folder:Satya 05/12/08:
10-87 Section 10.7 Parametric Equations and Graphs 1005
College Algebra & Trignometry—
of with an initial velocity of 80 ft/sec, and the
kick is “true,” will the home team win (does the
ball clear the 10-ft high cross bar)?
50. Particle motion: The motion of a particle is
modeled by the parametric equations
Between and is the
particle moving to the right or to the left? Is the
particle moving upward or downward?
51. Electron motion: The motion of an electron as it
orbits the nucleus is modeled by the parametric
equations with t in radians. Between
and is the electron moving to the right
or to the left? Is the electron moving upward or
downward?
Systems applications: Solve the following systems using
elimination. If the system is dependent, write the general
solution in parametric form and use a calculator to generate
several solutions.
52. 53.
54.
55. •
x y 5z 4
2y 3z 1
x 3y z 3
•
5x 3z 1
x 2y 2z 3
2x 6y 9z 10
•
x 5y z 3
5x y 7z 9
2x 3y 4z 6
•
2x y 3z 3
3x 2y z 4
8x 3y z 5
t 3,t 2
e
x 6 cos t
y 2 sin t
t 1,t 0e
x 5t 2t
2
y 3t 2
.
50 yards
(150 feet)
29° 56. Regressions and parameters:
Draw a scatter-plot of the data
given in the table. Note that
connecting the points with a
smooth curve will not result
in a function, so a standard
regression cannot be run on
the data. Now consider the
x-values alone—what do
you notice? Find a sinusoidal
model for the x-values, using
Use the
same inputs to run some form
of regression on the y-values, then use the results to
form the “best-fit” parametric equations for this
data (use L1 for T, L2 for the x-values, and L3 for
the y-values). With your calculator in parametric
, enter the equations as X
1T
and Y
1T
, then
graph these along with the scatterplot (L2, L3) to
see the finished result. Use the feature of
your calculator to comment on the accuracy of the
model.
57. Regressions and parameters:
Draw a scatter-plot of the data
given in the table, and connect
the points with a smooth curve.
The result is a function, but no
standard regression seems to
give an accurate model. The
x-values alone are actually
generated by an exponential
function. Run a regression
on these values using
as inputs
to find the exponential model.
Then use the same inputs to run some form of
regression on the y-values and use the results to
form the “best-fit” parametric equations for this
data (use L1 for T, L2 for the x-values, and L3 for
the y-values). With your calculator in parametric
, enter the equations as X
1T
and Y
1T
, then
graph these along with the scatterplot (L2, L3) to
see the finished result. Use the feature of
your calculator to comment on the accuracy of the
model.
TABLE
MODE
T 0, 1, 2, 3, . . . , 8
TABLE
MODE
T 0, 1, 2, 3, . . . , 8.
xy
00
0.25
22
6.75
016
31.25
54
85.75
0 128
12
2
12
12
12
xy
10
1.2247
1.5
1.8371
2.25
2.7557
3.375
4.1335
5.0625 0
1.75
3
3.75
4
3.75
3
1.75
EXTENDING THE CONCEPT
58. What is the difference between an epicycloid, a
hypercycloid, and a hypocycloid? Do a word study
on the prefixes epi-, hyper-, and hypo-, and see
how their meanings match with the mathematical
figures graphed in Exercises 27 to 35. To what
other shapes or figures are these prefixes applied?
cob19529_ch10_0995-1006.qxd 12/6/08 12:52 AM Page 1005 epg HD 049 :Desktop Folder:Satya 05/12/08:

1006 CHAPTER 10 Analytic Geometry and the Conic Sections 10-88
College Algebra & Trignometry—
MAINTAINING YOUR SKILLS
61. (1.1) The price of a popular video game is reduced
by 20% and is selling for $39.96. By what
percentage must the sale price be increased to
return the item to its original price?
62. (5.2) When the tip of the antenna atop the Eiffel
Tower is viewed at a distance of 265 ft from its
base, the angle of elevation is . Is the Eiffel
Tower taller or shorter than the Chrysler Building
(New York City) at 1046 ft?
76°
63. (3.4) Graph using
information about end behavior, y-intercept,
x-intercept(s), and midinterval points:
64. (6.6) The maximum height a projectile will attain
depends on the angle it is projected and its initial
velocity. This phenomena is modeled by the
function where v is the initial
velocity (in feet/sec) of the projectile and is the
angle of projection. Find the angle of projection if
the projectile attained a maximum height of 151 ft,
and the initial velocity was 120 ft/sec.
H
v
2
sin
2
64
,
f
1x2 x
3
2x
2
5x 6
59. The motion of a particle in a certain medium is
modeled by the parametric equations
Initially, use only the (TABLE)
feature of your calculator (not the graph) to name
the intervals for which the particle is moving (a) to
the left and upward and (b) to the left and
downward. Answer to the nearest tenth (set
). Is it possible for this particle to
collide with another particle in this medium whose
¢Tbl 0.1
GRAPH
2nd
e
x 6 sin14t2
y 8 cos t
.
movement is modeled by ? Discuss
why or why not.
60. Write the function in
parametric form using the substitution
and the appropriate double-angle
identity. Is the result equivalent to the original
function? Why or why not?
x 2 cos t 3
y
1
2
1x 32
2
1
e
x 3 cos t 7
y 2 sin t 2
SUMMARY AND CONCEPT REVIEW
SECTION 10.1 A Brief Introduction to Analytical Geometry
KEY CONCEPTS
•
The midpoint and distance formulas play an important role in the study of analytical geometry:
midpoint: distance:
•
The perpendicular distance from a point to a line is the length of a line segment perpendicular to a given line with
the given point and the point of intersection as endpoints.
•
Using these tools, we can verify or construct relationships between points, lines, and curves in the plane; verify
properties of geometric figures; prove theorems from Euclidean geometry; and construct relationships that define
the conic sections.
EXERCISES
1. Verify the closed figure with vertices ( ), ( , 4), (3, 6), and (5, ) is a square.
2. Find the equation of the circle that circumscribes the square in Exercise 1.
3. A theorem from Euclidean geometry states: If any two points are equidistant from the endpoints of a line
segment, they are on the perpendicular bisector of the segment. Determine if the line through ( , 6) and (6, )
is a perpendicular bisector of the segment through ( ) and (5, 4).
4. Four points are given below. Verify that the distance from each point to the line is the same as the
distance from the given point to the fixed point (0, 1): ( , 9), ( , 1), (4, 4), and (8, 16).26
y 1
5, 2
93
253, 4
d 21x
2
x
1
2
2
1y
2
y
1
2
2
1x, y2 a
x
2
x
1
2
,
y
2
y
1
2
b
cob19529_ch10_0995-1006.qxd 12/6/08 4:25 AM Page 1006 epg HD 049 :Desktop Folder:Satya 05/12/08:
10-89 Summary and Concept Review 1007
SECTION 10.2 The Circle and the Ellipse
KEY CONCEPTS
•
The equation of a circle centered at (h, k) with radius r is .
•
Dividing both sides by r
2
, we obtain the standard form , showing the horizontal and
vertical distance from center to graph is r.
•
The equation of an ellipse in standard form is . The center of the ellipse is (h, k), with
horizontal distance a and vertical distance b from center to graph.
•
Given two fixed points f
1
and f
2
in a plane (called the foci), an ellipse is the set of all
points (x, y) such that the distance from the first focus to (x, y), plus the distance from
the second focus to (x, y), remains constant.
•
For an ellipse, the distance a from center to vertex is greater than the distance c from
center to one focus.
•
To find the foci of an ellipse: (since ).
EXERCISES
Sketch the graph of each equation in Exercises 5 through 9.
5. 6. 7.
8. 9.
10. Find the equation of the ellipse with minor axis of length 6 and foci at (4, 0) and (4, 0).
11. Find the equation of the ellipse with vertices at (a) (13, 0) and (13, 0), foci at (12, 0) and (12, 0); (b) foci at
(0, 16) and (0, 16), major axis: 40 units.
12. Write the equation in standard form and sketch the graph, noting all of the characteristic features of the ellipse.
SECTION 10.3 The Hyperbola
KEY CONCEPTS
•
The equation of a horizontal hyperbola in standard form is . The center of the hyperbola
is (h, k) with horizontal distance a from center to vertices and vertical distance b from center to the midpoint of
one side of the central rectangle.
•
Given two fixed points f
1
and f
2
in a plane (called the foci), a hyperbola is the set of all
points (x, y) such that the distance from the first focus to point (x, y), less the distance
from the second focus to (x, y), remains constant.
•
For a hyperbola, the distance from center to one of the vertices is less than the distance
from center to one focus.
•
To find the foci of a hyperbola: (since ).
EXERCISES
Sketch the graph of each equation, indicating the center, vertices, and asymptotes. For Exercise 18, also give the
equation of the hyperbola in standard form.
13. 14. 15.
1x 22
2
9
1y 12
2
4
1
1y 32
2
16
1x 22
2
9
14y
2
25x
2
100
c 7 ac
2
a
2
b
2
1x h2
2
a
2
1y k2
2
b
2
1
4x
2
25y
2
16x 50y 59 0
1x 32
2
16
1y 22
2
9
1x
2
y
2
6x 4y 12 0
9x
2
y
2
18x 27 0x
2
4y
2
36x
2
y
2
16
a 7 ca
2
b
2
c
2
1x h2
2
a
2
1y k2
2
b
2
1
1x h2
2
r
2
1y k2
2
r
2
1
1x h2
2
1y k2
2
r
2
x
y
d
1
d
2
k
(a, 0)
(c, 0) (c, 0)
(a, 0)
d
1
d
2
(x, y)
College Algebra & Trignometry—
(x, y)
d
1
d
2
k
x
y
(a, 0)
(c, 0) (c, 0)
(a, 0)
d
1
d
2
cob19529_ch10_1007-1016.qxd 12/6/08 4:44 AM Page 1007 epg HD 049 :Desktop Folder:Satya 05/12/08:
1008 CHAPTER 10 Analytic Geometry and the Conic Sections 10-90
College Algebra & Trignometry—
16. 17.
18. vertices at ( , 0) and (3, 0), asymptotes of
19. Find the equation of the hyperbola with (a) vertices at ( , 0), foci at ( , 0), and (b) foci at (0, ) with
vertical dimension of central rectangle 8 units.
20. Write the equation in standard form and sketch the graph, noting all of the characteristic features of the hyperbola.
SECTION 10.4 The Analytic Parabola
KEY CONCEPTS
•
Horizontal parabolas have equations of the form .
•
A horizontal parabola will open to the right if and to the left if . The axis of symmetry is ,
with the vertex (h, k) found by evaluating at or by completing the square and
writing the equation in shifted form: .
•
Given a fixed point f (called the focus) and fixed line D in the plane, a parabola is the set
of all points (x, y) such that the distance from f to (x, y) is equal to the distance from (x, y)
to line D.
•
The equation describes a vertical parabola, opening upward if , and
opening downward if .
•
The equation describes a horizontal parabola, opening to the right if , and
opening to the left if .
•
The focal chord of a parabola is a line segment that contains the focus and is parallel the directrix, with its
endpoints on the graph. It has a total length of , meaning the distance from the focus to a point of the graph is
. It is commonly used to assist in drawing a graph of the parabola.
EXERCISES
For Exercises 21 and 22, find the vertex and x- and y-intercepts if they exist. Then sketch the graph using symmetry
and a few points or by completing the square and shifting a parent function.
21. 22.
For Exercises 23 and 24, find the vertex, focus, and directrix for each parabola. Then sketch the graph using this
information and the focal chord. Also graph the directrix.
23. 24.
SECTION 10.5 Polar Coordinates, Equations, and Graphs
KEY CONCEPTS
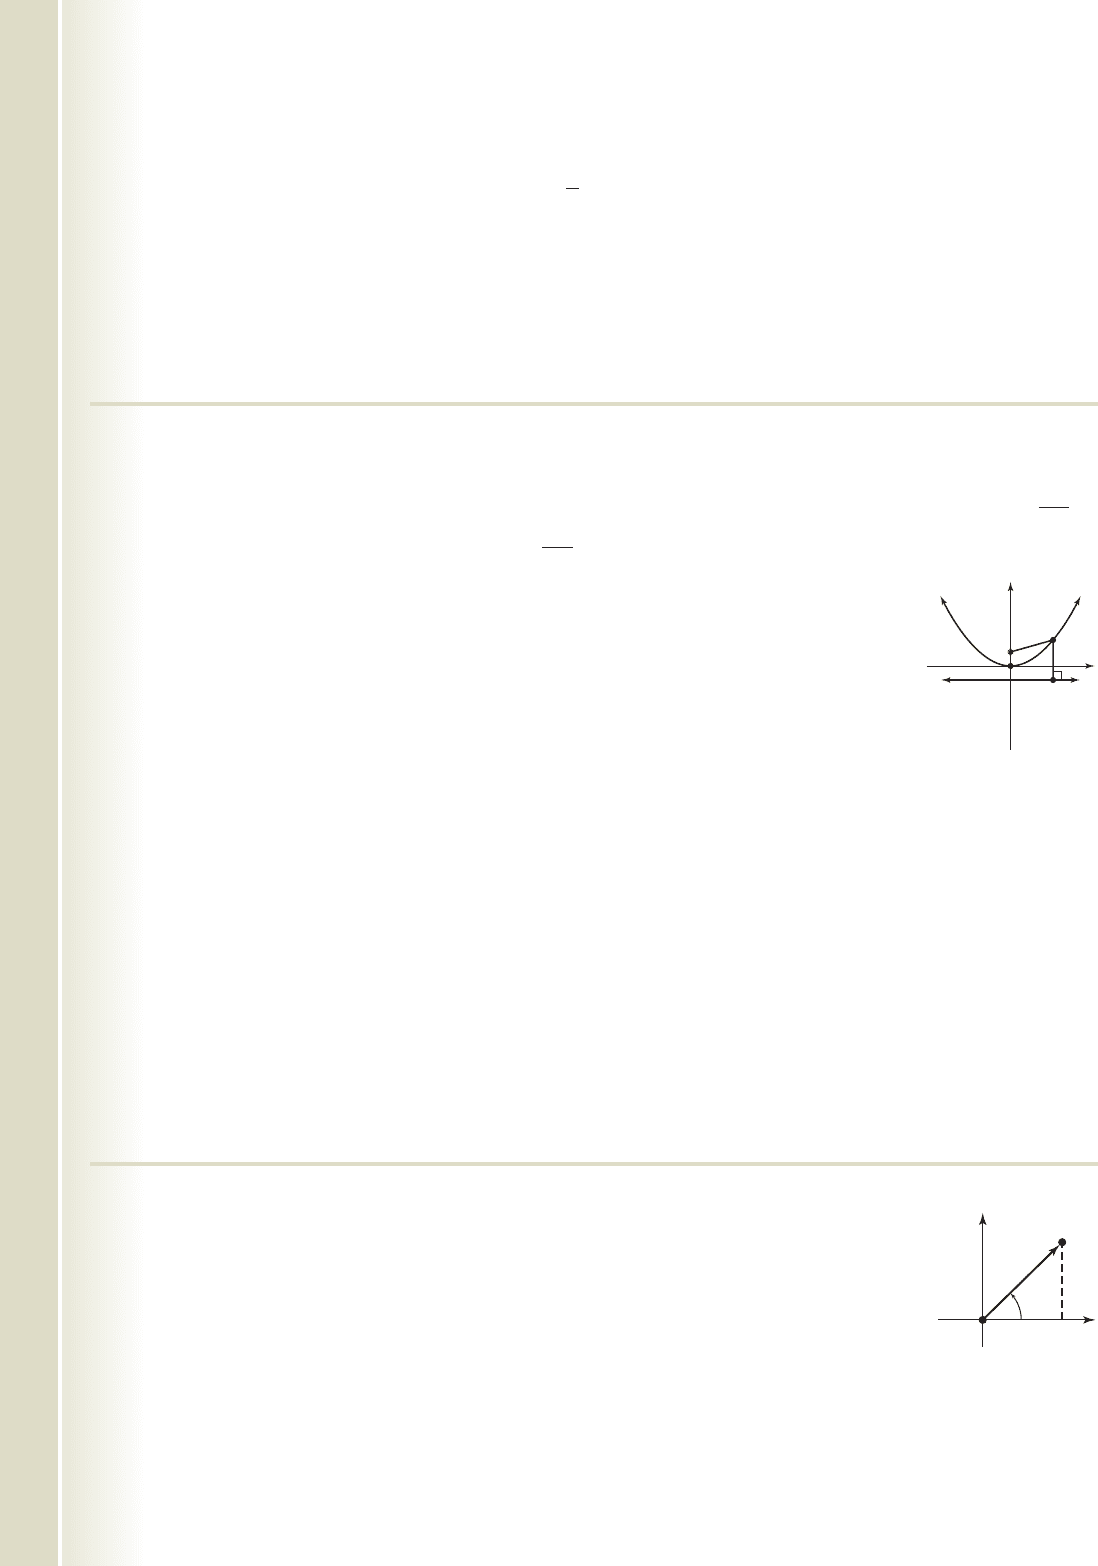
•
In polar coordinates, the location of a point in the plane is denoted where r is the
distance to the point from the origin or pole, and is the angle between a stipulated polar
axis and a ray containing P.
•
In the polar coordinate system, the location of a point is not unique for two reasons:
(1) the angles and are coterminal (n an integer), and (2) r may be negative.
•
The point can be converted to P(x, y) in rectangular coordinates where
and y r sin .
x r cos P1r, 2
2n
1r, 2
1r, 2,
x
2
8x 8y 16 0x
2
20y
x y
2
y 6x y
2
4
2p
4p
p 6 0
p 7 0y
2
4px
p 6 0
p 7 0x
2
4py
x a1y k2
2
h
y
b
2a
y
b
2a
a 6 0a 7 0,
x ay
2
by c; a 0
4x
2
9y
2
40x 36y 28 0
51715
y
4
3
x3
x
2
4y
2
12x 8y 16 09y
2
x
2
18y 72 0
x
y
d
1
d
2
(x, y)
Ve rt e x
d
1
d
2
D
f
Polar axisPole
P(r, )
r 0
r
cob19529_ch10_1007-1016.qxd 12/6/08 4:44 AM Page 1008 epg HD 049 :Desktop Folder:Satya 05/12/08:

10-91 Summary and Concept Review 1009
College Algebra & Trignometry—
•
The point P(x, y) in rectangular coordinates can be converted to in polar coordinates, where
and
• To sketch a polar graph, we view the length r as being along the second hand of a clock, ticking in a
counterclockwise direction. Each “tick” is rad or For each tick we locate a point on the radius and plot it
on the face of the clock before going on.
• For graphing, we also apply an “r-value” analysis, which looks where r is increasing, decreasing, zero,
maximized, and/or minimized.
• If the polar equation is given in terms of sines, the graph will be symmetric to
• If the polar equation is given in terms of cosines, the graph will be symmetric to the polar axis.
• The graphs of several common polar equations are given in Appendix V.
EXERCISES
Sketch using an r-value analysis (include a table), symmetry, and any convenient points.
25. 26. 27. 28.
SECTION 10.6 More on the Conic Sections: Rotation of Axes and Polar Form
KEY CONCEPTS
• Using a rotation, the conic equation in the xy-plane can be transformed
into in the XY-plane, in which the mixed xy-term is absent.
• The required angle of rotation is found using
• The change in coordinates from the xy-plane to the XY-plane is accomplished using the rotation formulas:
• In the process of this conversion, certain quantities, called invariants, remain unchanged and can be used to
check that the conversion was correctly performed. These invariants are (1) (2) and
(3)
• The invariants are called discriminants and can be used to classify the type of graph the
equation will give, except in degenerate cases:
• If the equation is that of a parabola.
• If the equation is that of a circle or an ellipse.
• If the equation is that of a hyperbola.
• All conics (not only the parabola) can be stated in terms of a focus/directrix definition. This is done using the
concept of eccentricity, symbolized by the letter e.
• If F is a fixed point and l a fixed line in the plane with the point D on l, the set of all points P such that
(e a constant) is the graph of a conic section. If the graph is a parabola. If the graph is an
ellipse. If the graph is a hyperbola.
•
Given a conic section with eccentricity e, one focus at the pole of the -plane, and directrix l located d units
from this focus, then the polar equations and represent one of the conic sections
as determined by the value of e.
EXERCISES
For the given conics in the xy-plane, use a rotation of axes to find the corresponding equation in the XY-plane, then
sketch its graph.
29. 30. x
2
613xy 7y
2
160 02x
2
4xy 2y
2
812y 24 0
r
de
1 e sin
r
de
1 e cos
r
e 7 1,
0 6 e 6 1,e 1,
FP
DP
e
B
2
4AC 7 0,
B
2
4AC 6 0,
B
2
4AC 0,
B
2
4AC b
2
4ac
B
2
4AC b
2
4ac.
A C a c,F f,
x X cos Y sin
y X sin Y cos
tan122
B
A C
; 0 6 2 6 180°.
aX
2
cY
2
dX eY f 0
Ax
2
Bxy Cy
2
Dx Ey F 0
r 8 sin122r 2 4 cos r 4 4 cos r 5 sin
2
.
15°.
12
r
tan
1
a
y
x
b.
r 2x
2
y
2
P1r, 2
cob19529_ch10_1007-1016.qxd 12/6/08 4:44 AM Page 1009 epg HD 049 :Desktop Folder:Satya 05/12/08: