Coburn J.W. Algebra and Trigonometry
Подождите немного. Документ загружается.

690 CHAPTER 6 Trigonometric Identities, Inverses, and Equations 6-76
53. Exercise routine:As part of his yearly physical,
Manu Tuiosamoa’s heart rate is closely monitored
during a 12-min, cardiovascular exercise routine.
His heart rate in beats per minute (bpm) is modeled
by the function
where x represents the duration of the workout in
minutes. (a) What was his resting heart rate?
(b) What was his heart rate 5 min into the workout?
(c) At what times during the workout was his heart
rate over 170 bpm?
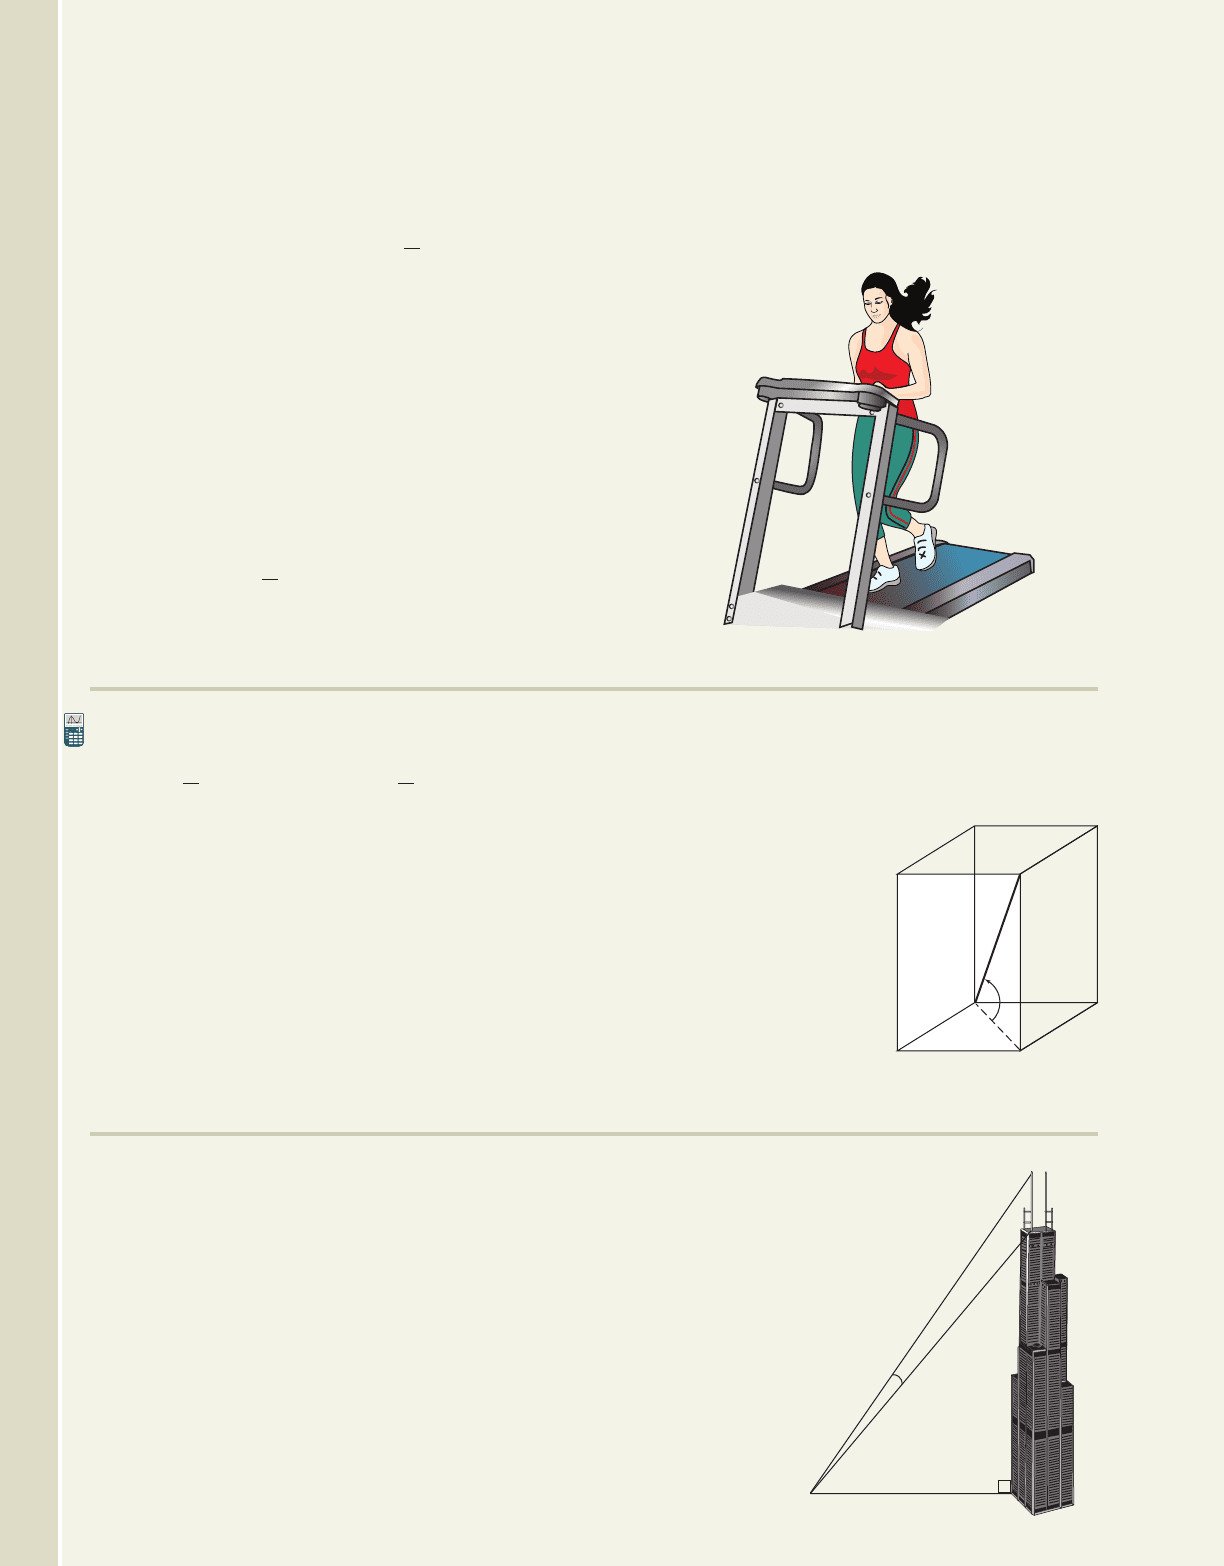
54. Exercise routine:As part of her workout routine,
Sara Lee programs her treadmill to begin at a slight
initial grade (angle of incline), gradually increase
to a maximum grade, then gradually decrease back
to the original grade. For the duration of her
workout, the grade is modeled by the function
where G(x) is the
percent grade x minutes after the workout has
G1x2 3 cosa
5
x b 4,
B1x2 58 cosa
6
x b 126
begun. (a) What is the initial grade for her
workout? (b) What is the grade at min?
(c) At how long has she been
working out? (d) What is the duration of the
treadmill workout?
G1x2 4.9%,
x 4
EXTENDING THE CONCEPT
55. As we saw in Chapter 6, cosine is the cofunction of
sine and each can be expressed in terms of the other:
and .
This implies that either function can be used to
model the phenomenon described in this section by
adjusting the phase shift. By experimentation,
(a) find a model using cosine that will produce
results identical to the sine function in Exercise 50
and (b) find a model using sine that will produce
results identical to the cosine function in
Exercise 51.
sina
2
b cos cosa
2
b sin
56. Use multiple identities to find all real solutions for
the equation given:
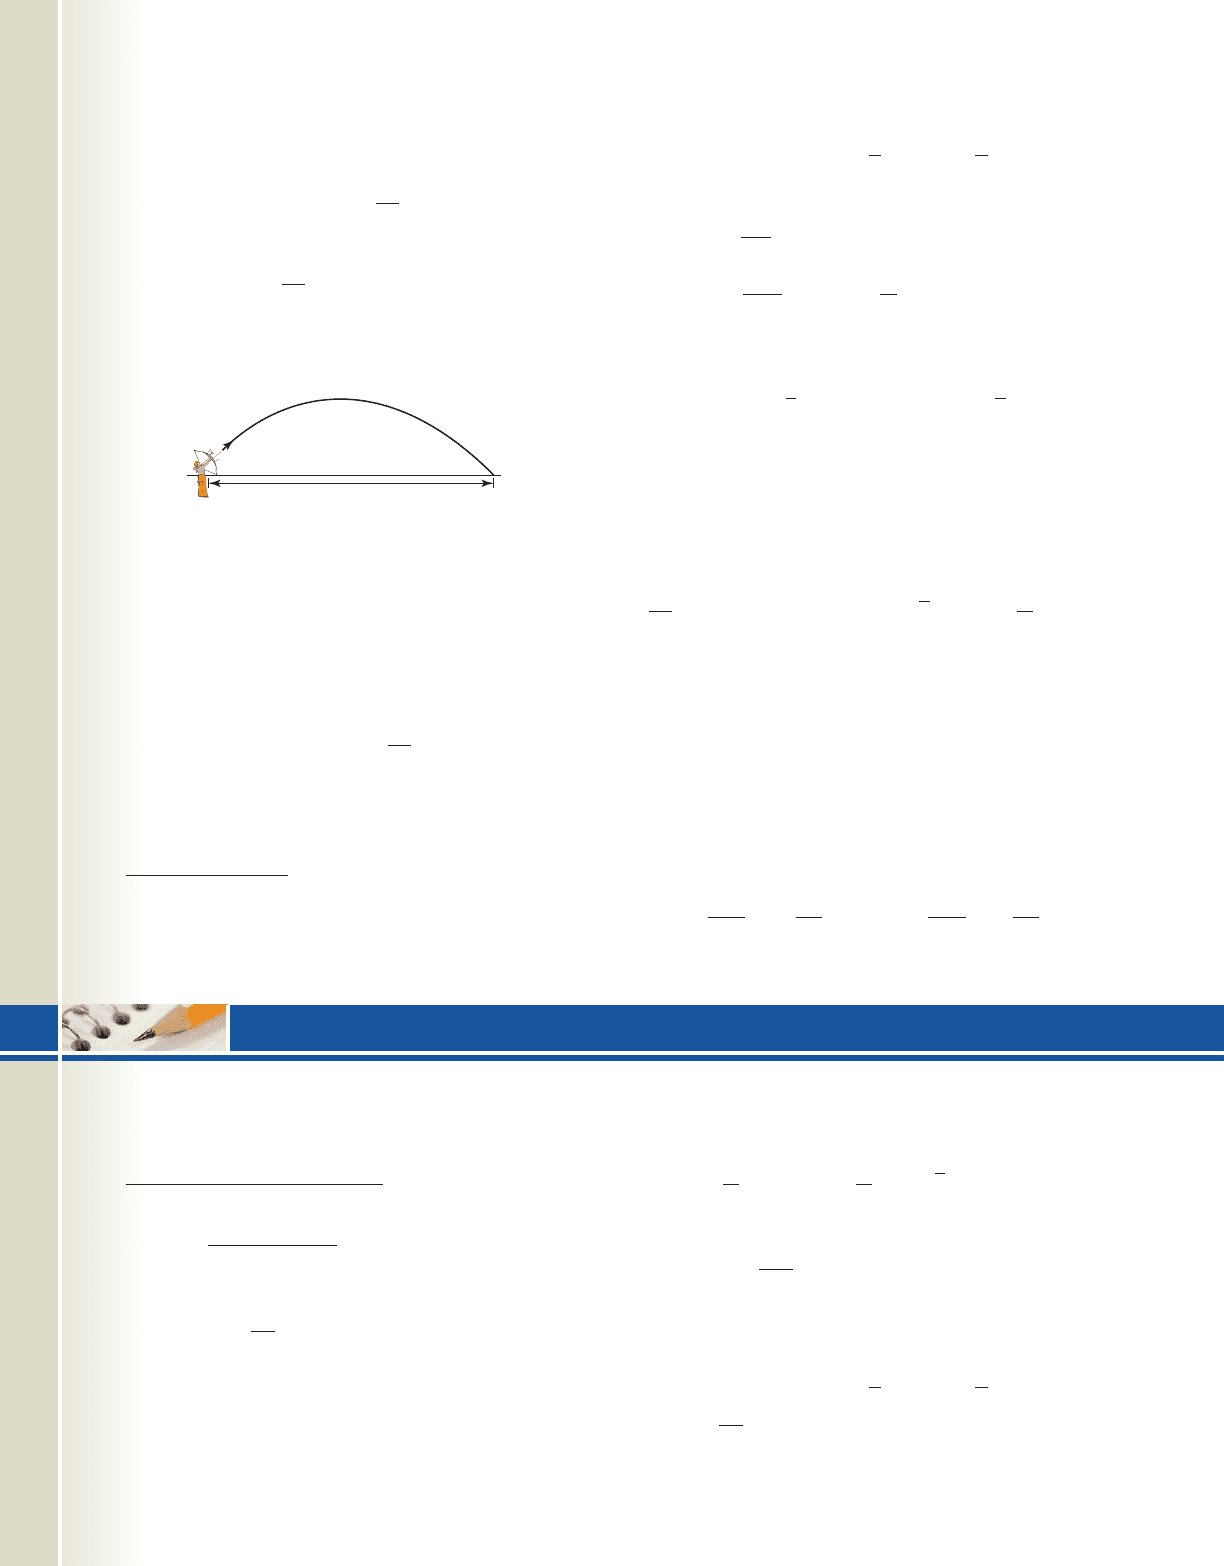
57. A rectangular
parallelepiped with
square ends has 12 edges
and six surfaces. If the
sum of all edges is 176
cm and the total surface
area is 1288 cm
2
, find
(a) the length of the
diagonal of the
parallelepiped (shown in
bold) and (b) the angle
the diagonal makes with
the base (two answers are possible).
cos12x2sin x 0.
sin15x2 sin12x2cos x
MAINTAINING YOUR SKILLS
58. (5.7) Find for all six trig functions, given
is on the terminal side.
59. (3.4) Sketch the graph of f by locating its zeroes
and using end behavior:
60. (4.3) Use a calculator and the change-of-base
formula to find the value of log
5
279.
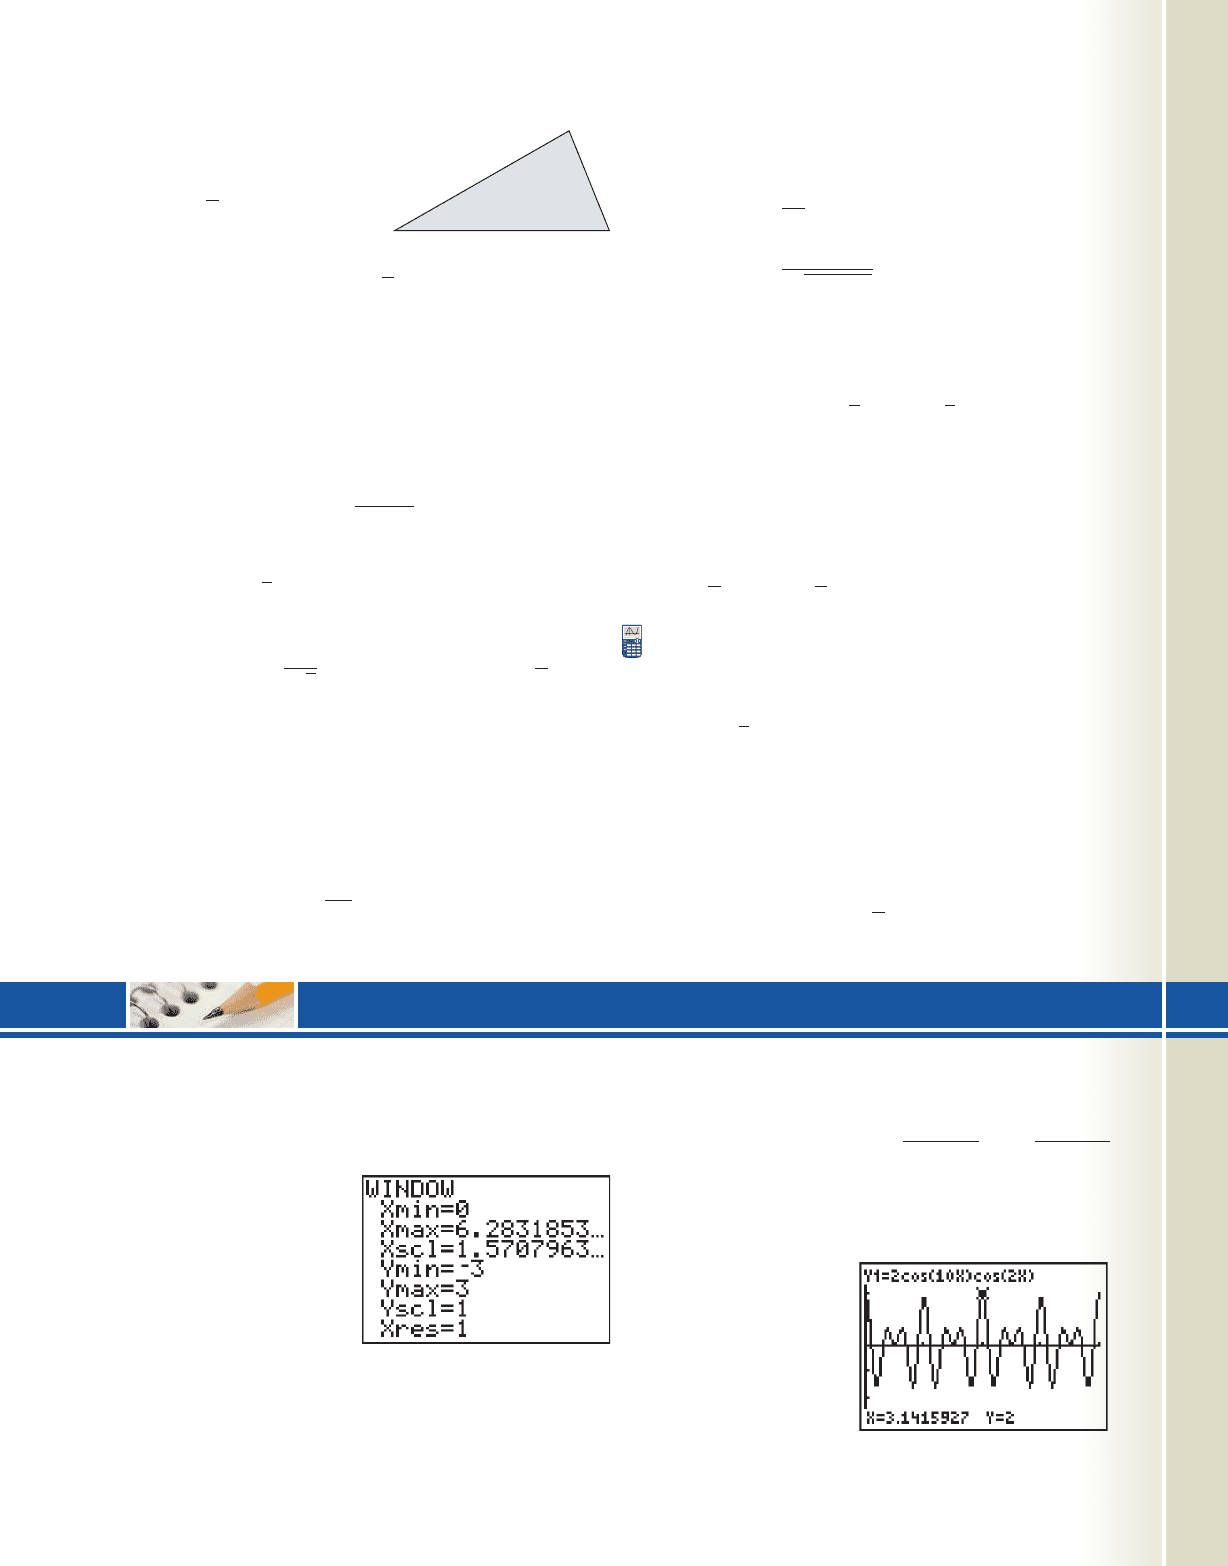
61. (5.6) The Sears Tower in Chicago, Illinois,
remains one of the tallest structures in the world.
The top of the roof reaches 1450 ft above the street
below and the antenna extends an additional 280 ft
f 1x2 x
4
3x
3
4x.
P151, 682
f 12
into the air. Find
the viewing angle for
the antenna from a
distance of 1000 ft (the
angle formed from the
base of the antenna to
its top).
College Algebra & Trignometry—
Exercise 57
Exercise 61
280 ft
1450 ft
1000 ft
cob19529_ch06_615-700.qxd 11/11/08 7:51 PM Page 690 epg HD 049:Desktop Folder:11/11/08:z_PDF:

SECTION 6.1 Fundamental Identities and Families of Identities
KEY CONCEPTS
•
The fundamental identities include the reciprocal, ratio, and Pythagorean identities.
•
A given identity can algebraically be rewritten to obtain other identities in an identity “family.”
•
Standard algebraic skills like distribution, factoring, combining terms, and special products play an important role
in working with identities.
•
The pattern gives an efficient method for combining rational terms.
•
Using fundamental identities, a given trig function can be expressed in terms of any other trig function.
•
Once the value of a given trig function is known, the value of the other five can be uniquely determined using
fundamental identities, if the quadrant of the terminal side is known.
•
To show an equation is not an identity, find any one value where the expressions are defined but the equation is
false, or graph both functions on a calculator to see if the graphs are identical.
EXERCISES
Verify using the method specified and fundamental identities.
1. multiplication 2. factoring
3. special products 4. combine terms using
Find the value of all six trigonometric functions using the information given.
5. in QIII 6. in QIV
SECTION 6.2 Constructing and Verifying Identities
KEY CONCEPTS
•
The steps used to verify an identity must be reversible.
•
If two expressions are equal, one may be substituted for the other and the result will be equivalent.
•
To verify an identity we mold, change, substitute, and rewrite one side until we “match” the other side.
•
Verifying identities often involves a combination of algebraic skills with the fundamental trig identities.
A collection and summary of the Guidelines for Verifying Identities can be found on page 625.
EXERCISES
Rewrite each expression to create a new identity, then verify the identity by reversing the steps.
7. 8.
Verify that each equation is an identity.
9. 10.
cot x
sec x
csc x
tan x
cot x1cos x csc x2
csc
2
x11 cos
2
x2
tan
2
x
cot
2
x
cos x sin x cos x
cos
2
x
csc x cot x
sec
25
23
; cos
12
37
;
sec
2
x
csc x
sin x
tan
2
x
csc x
A
B
C
D
AD BC
BD
1sec x tan x21sec x tan x2
csc x
sin x
tan
2
x csc x csc x
sec
2
x
csc x
sin x1csc x sin x2 cos
2
x
A
B
C
D
AD BC
BD
6-77 Summary and Concept Review 691
SUMMARY AND CONCEPT REVIEW
College Algebra & Trignometry—
cob19529_ch06_615-700.qxd 11/11/08 8:11 PM Page 691 epg HD 049:Desktop Folder:11/11/08:z_PDF:

11. 12.
SECTION 6.3 The Sum and Difference Identities
KEY CONCEPTS
The sum and difference identities can be used to
•
Find exact values for nonstandard angles that are a sum or difference of two standard angles.
•
Verify the cofunction identities and to rewrite a given function in terms of its cofunction.
•
Find coterminal angles in for very large angles (the angle reduction formulas).
•
Evaluate the difference quotient for sin x, cos x, and tan x.
•
Rewrite a sum as a single expression: .
The sum and difference identities for sine and cosine can be remembered by noting
•
For , the function repeats and the signs alternate:
•
For the signs repeat and the functions alternate:
EXERCISES
Find exact values for the following expressions using sum and difference formulas.
13. a. b. 14. a. b.
Evaluate exactly using sum and difference formulas.
15. a. b.
Rewrite as a single expression using sum and difference formulas.
16. a. b.
Evaluate exactly using sum and difference formulas, by reducing the angle to an angle in or
17. a. b.
Use a cofunction identity to write an equivalent expression for the one given.
18. a. b.
19. Verify that both expressions yield the same result using sum and difference formulas.
and .
20. Use sum and difference formulas to verify the following identity.
SECTION 6.4 The Double-Angle, Half-Angle, and Product-to-Sum Identities
KEY CONCEPTS
•
When multiple angle identities (identities involving ) are used to find exact values, the terminal side of must
be determined so the appropriate sign can be used.
•
The power reduction identities for cos
2
x and sin
2
x are closely related to the double-angle identities, and can be
derived directly from and .cos12x2 1 2 sin
2
xcos12x2 2 cos
2
x 1
n
cosax
6
b cosax
6
b 13 cos x
tan 15° tan1135° 120°2
tan 15° tan145° 30°2
sinax
12
bcosa
x
8
b
sina
57
4
bcos 1170°
30, 22.30, 360°2
sina
x
4
bcosa
3x
8
b cosa
x
4
bsina
3x
8
bcos13x2cos12x2 sin13x2sin12x2
sin 139° cos 19° cos 139° sin 19°cos 109° cos 71° sin 109° sin 71°
sina
12
btan 15°tana
12
bcos 75°
sin1 2 sin cos cos sin sin1 2
cos1 2 cos cos sin sin cos1 2
cos cos sin sin cos1 2
30, 360°2
1sin x cos x2
2
sin x cos x
csc x sec x 2
sin
4
x cos
4
x
sin x cos x
tan x cot x
692 CHAPTER 6 Trigonometric Identities, Inverses, and Equations 6-78
College Algebra & Trignometry—
cob19529_ch06_615-700.qxd 11/11/08 8:11 PM Page 692 epg HD 049:Desktop Folder:11/11/08:z_PDF:

•
The half-angle identities can be developed from the power reduction identities by using a change of variable and
taking square roots. The sign is then chosen based on the quadrant of the half angle.
•
The product-to-sum and sum-to-product identities can be derived using the sum and difference formulas, and have
important applications in many areas of science.
EXERCISES
Find exact values for , and using the information given.
21. a. in QIV b. in QIII
Find exact values for , and using the information given.
22. a. in QII b. in QII
Find exact values using the appropriate double-angle identity.
23. a. b.
Find exact values for and using the appropriate half-angle identity.
24. a. b.
Find exact values for and using the given information.
25. a. in QIV b. in QIV
26. Verify the equation is an identity. 27. Solve using a sum-to-product formula.
28. The area of an isosceles triangle (two equal sides) is given by the formula where the
equal sides have length x and the vertex angle measures (a) Use this formula and the half-angle identities to
find the area of an isosceles triangle with vertex angle and equal sides of 12 cm. (b) Use substitution and
a double-angle identity to verify that then recompute the triangle’s area. Do the
results match?
SECTION 6.5 The Inverse Trig Functions and Their Applications
KEY CONCEPTS
•
In order to create one-to-one functions, the domains of , and are restricted as follows:
(a) ; (b) ; and (c) .
•
For the inverse function is given implicitly as and explicitly as or
•
The expression is read, “y is the angle or real number whose sine is x.” The other inverse functions are
similarly read/understood.
•
For the inverse function is given implicitly as and explicitly as or
•
For the inverse function is given implicitly as and explicitly as or y arctan x.y tan
1
xx tan yy tan x,
y arccos x.y cos
1
xx cos yy cos x,
y sin
1
x
y arcsin x.y sin
1
xx sin yy sin x,
y tan t; t a
2
,
2
by cos t, t 30, 4y sin t, t c
2
,
2
d
y tan ty sin t, y cos t
x
2
sina
2
b cosa
2
b
1
2
x
2
sin ,
30°
°.
A x
2
sina
2
b cosa
2
b,
cos13x2 cos x 0
cos132 cos
cos132 cos
2 tan
2
sec
2
2
csc
65
33
; 90° 6 6 0; cos
24
25
; 0° 6 6 360°;
cosa
2
bsina
2
b
5
8
67.5°
cos sin
1 2 sin
2
a
12
bcos
2
22.5° sin
2
22.5°
sin122
336
625
; cos122
41
841
;
tan sin , cos
csc
29
20
; cos
13
85
;
tan122sin122, cos122
6-79 Summary and Concept Review 693
College Algebra & Trignometry—
cob19529_ch06_615-700.qxd 11/11/08 8:11 PM Page 693 epg HD 049:Desktop Folder:11/11/08:z_PDF:

•
The domains of and are likewise restricted to create one-to-one functions:
(a) (b) and (c)
•
In some applications, inverse functions occur in a composition with other trig functions, with the expression best
evaluated by drawing a diagram using the ratio definition of the trig functions.
•
To evaluate we use for use and so on.
•
Trigonometric substitutions can be used to simplify certain algebraic expressions.
EXERCISES
Evaluate without the aid of calculators or tables. State answers in both radians and degrees in exact form.
29. 30. 31.
Evaluate the following using a calculator, keeping the domain and range of each function in mind. Answer in radians
to the nearest ten-thousandth and in degrees to the nearest tenth. Some may be undefined.
32. 33. 34.
Evaluate the following without the aid of a calculator. Some may be undefined.
35. 36. 37.
Evaluate the following using a calculator. Some may be undefined.
38. 39. 40.
Evaluate each expression by drawing a right triangle and labeling the sides.
41. 42. 43.
Use an inverse function to solve the following equations for in terms of x.
44. 45. 46.
SECTION 6.6 Solving Basic Trig Equations
KEY CONCEPTS
•
When solving trig equations, we often consider either the principal root, roots in or all real roots.
•
Keeping the graph of each function in mind helps to determine the desired solution set.
•
After isolating the trigonometric term containing the variable, we solve by applying the appropriate inverse
function, realizing the result is only the principal root.
•
Once the principal root is found, roots in or all real roots can be found using reference angles and the
period of the function under consideration.
•
Trig identities can be used to obtain an equation that can be solved by factoring or other solution methods.
EXERCISES
Solve each equation without the aid of a calculator (all solutions are standard values). Clearly state (a) the principal
root; (b) all solutions in the interval ; and (c) all real roots.
47. 48. 49. 8 tan x 713
133 sec x 62 sin x 12
30, 22
30, 22
30, 22,
x 4 sina
6
b713 sec xx 5 cos
cotcsin
1
a
x
281 x
2
bdtancarcseca
7
3x
bdsinccos
1
a
12
37
bd
cot
1
ccota
11
4
bdarccos3cos160°24sin
1
1sin 1.02452
cos1cos
1
22arcseccseca
4
bdsincsin
1
a
1
2
bd
f1x2 arccosa
7
8
by sin
1
0.8892y tan
1
4.3165
y arccosa
13
2
by csc
1
2y sin
1
a
12
2
b
tan
1
a
1
t
b;y cot
1
t,y cos
1
a
1
t
b;y sec
1
t,
y cot t, t 10, 2.y csc t, t c
2
, 0b ´ a0,
2
d;y sec t; t c0,
2
b ´ a
2
, d;
y cot xy sec x, y csc x,
694 CHAPTER 6 Trigonometric Identities, Inverses, and Equations 6-80
College Algebra & Trignometry—
cob19529_ch06_615-700.qxd 11/11/08 8:11 PM Page 694 epg HD 049:Desktop Folder:11/11/08:z_PDF:

Solve using a calculator and the inverse trig functions (not by graphing). Clearly state (a) the principal root;
(b) solutions in and (c) all real roots. Answer in radians to the nearest ten-thousandth as needed.
50. 51. 52.
53. The area of a circular segment (the shaded portion shown in the diagram) is given by the
formula , where is in radians. If the circle has a radius of 10 cm, find
the angle that gives an area of 12 cm
2
.
SECTION 6.7 General Trig Equations and Applications
KEY CONCEPTS
•
In addition to the basic solution methods from Section 6.6, additional strategies include squaring both sides,
factoring by grouping, and using the full range of identities to simplify an equation.
•
Many applications result in equations of the form . To solve, isolate the factor
(subtract D and divide by A), then apply the inverse function.
•
Once the principal root is found, roots in or all real roots can be found using reference angles and the
period of the function under consideration.
EXERCISES
Find solutions in using the method indicated. Round nonstandard values to four decimal places.
54. squaring both sides 55. using identities
56. factor by grouping 57. using any appropriate method
State the period P of each function and find all solutions in [0, P). Round to four decimal places as needed.
58. 59.
60. The revenue earned by Waipahu Joe’s Tanning Lotions fluctuates with the seasons, with a great deal more lotion
sold in the summer than in the winter. The function models the monthly sales of
lotion nationwide, where R(x) is the revenue in thousands of dollars and x represents the months of the year
( ). (a) How much revenue is projected for July? (b) For what months of the year does revenue exceed
$37,000?
x 1 S Jan
R1x2 15 sina
6
x
2
b 30
80 cosa
3
x
4
b 4012 0750 sina
6
x
2
b 120 0
csc x cot x 14 sin x cos x 213 sin x 2 cos x 13 0
3 cos12x2 7 sin x 5 0sin x cos x
16
2
30, 22
30, 22
sin1Bx C2
Asin1Bx C2 D k
A
1
2
r
2
1 sin 2
12
csc x 3 7
2
5
sin122
1
4
9 cos x 4
30, 22;
6-81 Mixed Review 695
rr
MIXED REVIEW
Find the value of all six trig functions using the
information given.
1. in QII 2.
Find the exact value of each expression using a sum or
difference identity.
3. 4. cosa
19
12
btan 255°
tan
1
a
4
3
b csc
1117
6
;
Evaluate each expression by drawing a right triangle and
labeling the sides appropriately.
5. 6.
7. Solve for x in the interval [0, ). Round to four
decimal places as needed:
100 sin a
4
x
6
b 80 100
2
sincsec
1
a
264 x
2
x
bdtancarccsca
10
x
bd
College Algebra & Trignometry—
cob19529_ch06_691-700.qxd 12/29/2008 11:30 am Page 695
696 CHAPTER 6 Trigonometric Identities, Inverses, and Equations 6-82
8. The horizontal distance R that an object will travel
when it is projected at angle with initial velocity v
is given by the equation
a. Use an identity to show this equation can be
written as
b. Use this equation to show why the horizontal
distance traveled by the object is the same for any
two complementary angles.
9. The profits of Red-Bud Nursery can be modeled by
a sinusoid, with profit peaking twice each year.
Given profits reach a yearly low of $4000 in mid-
January (month 1.5), and a yearly high of $14,000 in
mid-April (month 4.5). (a) Construct an equation for
their yearly profits. (b) Use the model to find their
profits for August. (c) Name the other month at
which profit peaks.
10. Find the exact value of using an
appropriate identity.
Verify the following identity.
11.
1 cos
2
sin
2
tan
2
1 cos122
2 cos
2
a
12
b 1
R
R
1
32
v
2
sin122.
R
1
16
v
2
sin cos .
12. Find exact values for and using the
information given.
a.
b.
Evaluate without the aid of calculator or tables. Answer
in both radians and degrees.
13. 14.
15. Verify the following identities using a sum formula.
a.
b.
Use an inverse function to solve each equation for in
terms of x.
16. 17.
18. Find the value of each expression using sum-to-product
and half-angle identities (without using a calculator).
a.
b.
19. Given 100 use a calculator to find (a) the
principal root, (b) all solutions in [ ], and (c) all
real solutions. Round to the nearest ten-thousandth.
20. Use the product-to-sum formulas to find the exact
value of
a. b. sina
13
24
bsina
7
24
bsina
13
24
bcosa
7
24
b
0, 2
sin t 70,
cos 172.5° cos 52.5°
sin 172.5° sin 52.5°
212
csca
4
b x
x
10
tan
cos12x2 cos
2
x sin
2
x
sin12x2 2 sin x cos x
y tan
1
13y arcsec1122
sec x
11.7
4.5
; 0 6 x 6
2
sin x
6
7.5
; 540° 6 x 6 630°
cosa
x
2
bsina
x
2
b
College Algebra & Trignometry—
PRACTICE TEST
Verify each identity using fundamental identities and the
method specified.
1. special products
2. factoring
3. Find the value of all six trigonometric functions
given in QIV
4. Find the exact value of using a sum or
difference formula.
5. Rewrite as a single expression and evaluate:
cos 81° cos 36° sin 81° sin 36°
tan 15°
cos
48
73
;
sin
3
x cos
3
x
1 cos x sin x
sin x cos x
1csc x cot x21csc x cot x2
sec x
cos x
6. Evaluate exactly using an angle reduction
formula.
7. Use sum and difference formulas to verify
8. Find exact values for , and given
in QI
9. Use a double-angle identity to evaluate
.
10. Find exact values for and given
in QItan
12
35
;
cosa
2
bsina
2
b
2 cos
2
75° 1
cos122
161
289
;
tan sin , cos
sinax
4
b sinax
4
b 12 cos x.
cos 1935°
cob19529_ch06_691-700.qxd 12/29/2008 11:30 am Page 696
11. The area of a triangle is
given geometrically as
. The
trigonometric formula for
the triangle’s area is where is the
angle formed by the sides b and c. In a certain
triangle, and Use the
formula for A given here and a half-angle identity to
find the area of the triangle in exact form.
12. The equation can be written
in an alternative form that makes it easier to graph.
This is done by eliminating the mixed xy-term using
the relation to find We can then
find values for and , which are used in a
conversion formula. Find and for
assuming in QI.
13. Evaluate without the aid of calculators or tables.
a. b.
c.
14. Evaluate the following. Use a calculator for part
(a), give exact answers for part (b), and find the
value of the expression in part (c) without using a
calculator. Some may be undefined.
a. b.
c. y sec
1
cseca
7
24
bd
y arctan1tan 78.5°2y sin
1
0.7528
y arccos1cos 30°2
y sincsin
1
a
1
2
bdy tan
1
a
1
13
b
217x
2
513xy 2y
2
0,
cos sin
cos sin
.tan122
B
A C
Ax
2
Bxy Cy
2
0
22.5°.b 8, c 10,
A
1
2
bc sin ,
A
1
2
base
#
height
c
a
b
␣
6-83 Calculator Exploration and Discovery 697
Evaluate the expressions by drawing a right triangle and
labeling the sides.
15.
16.
17. Solve without the aid of a calculator (all solutions
are standard values). Clearly state (a) the principal
root, (b) all solutions in the interval and
(c) all real roots.
I. II.
18. Solve each equation using a calculator and inverse
trig functions to find the principal root (not by
graphing). Then state (a) the principal root, (b) all
solutions in the interval , and (c) all real
roots.
I. II.
19. Solve the equations graphically in the indicated
interval using a graphing calculator. State answers in
radians rounded to the nearest ten-thousandth.
a.
b.
20. Solve the following equations for using
a combination of identities and/or factoring. State
solutions in radians using the exact form where
possible.
a.
b. 1cos x sin x2
2
1
2
2 sin x sin12x2 sin12x2 0
x 30, 22
21x
1 3 cos
2
x; x 30, 22
3 cos12x 12 sin x; x 3, 4
3 cos12x2 0.8 0
2
3
sin12x2
1
4
30, 22
13
sec x 2 48 cos x 412
30, 22,
cotccos
1
a
x
1
25 x
2
bd
cosctan
1
a
56
33
bd
CALCULATOR EXPLORATION AND DISCOVERY
Seeing the Beats as the Beats Go On
When two sound waves of slightly different frequencies
are combined, the resultant wave varies periodically in
amplitude over time. These
amplitude pulsations are
called beats. In this Explo-
ration and Discovery, we’ll
look at ways to “see” the
beats more clearly on a
graphing calculator, by
representing sound waves
very simplistically as
and and noting a relationship
between m, n, and the number of beats in Using a
sum-to-product formula, we can represent the resultant
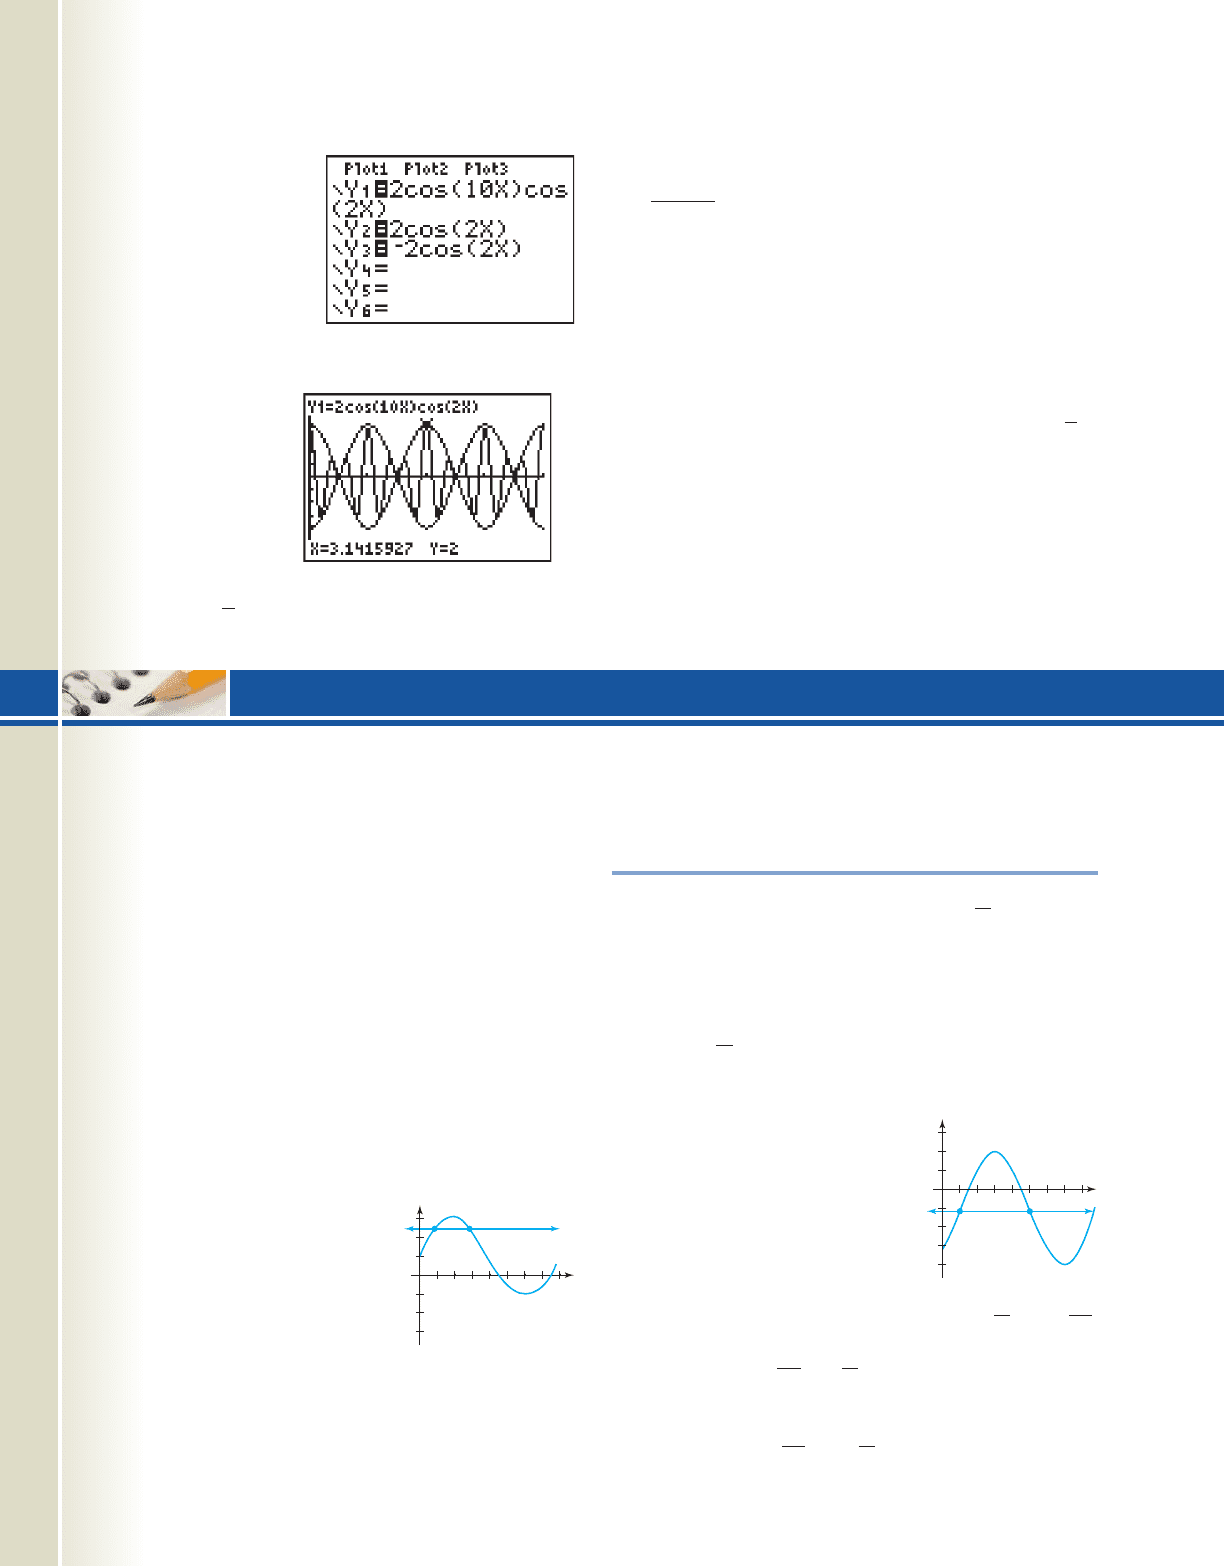
wave as a single term. For and Y
2
cos18t2Y
1
cos112t2
30, 24.
Y
2
cos1nt2Y
1
cos1mt2
the result is
The window
used and resulting
graph are shown in
Figures 6.33 and
6.34, and it appears
that “silence” occurs
four times in this
interval—where the
graph of the com-
bined waves is
2 cos110t2cos12t2
cos112t2 cos18t2 2 cosa
12t 8t
2
b cosa
12t 8t
2
b
3
3
2
0
Figure 6.33
Figure 6.34
cob19529_ch06_691-700.qxd 12/29/2008 01:10 PM Page 697
698 CHAPTER 6 Trigonometric Identities, Inverses, and Equations 6-84
STRENGTHENING CORE SKILLS
tangent to (bounces off
of) the x-axis. This indi-
cates a total of four beats.
Note the number of beats
is equal to the difference
Further experimentation
will show this is not a
coincidence, and this
enables us to con-
struct two additional
functions that will
frame these pulsa-
tions and make them
easier to see. Since
the maximum ampli-
tude of the resulting
wave is 2, we use
functions of the
form to construct the frame, where k is the
2 cosa
k
2
xb
m n: 12 8 4.
number of beats in the interval For
and we have
and the functions we use will be
and as shown in
Figure 6.35. The result is shown in Figure 6.36, where
the frame clearly shows the four beats or more precisely,
the four moments of silence.
For each exercise, (a) express the sum as a
product, (b) graph Y
R
on a graphing calculator for
and identify the number of beats in this inter-
val, and (c) determine what value of k in
would be used to frame the resultant Y
R
, then enter these
as Y
2
and Y
3
to check the result.
Exercise 1:
Exercise 2:
Exercise 3:
Exercise 4:
Y
1
cos111t2;
Y
2
cos110t2
Y
1
cos114t2;
Y
2
cos16t2
Y
1
cos112t2;
Y
2
cos19t2
Y
1
cos114t2;
Y
2
cos18t2
2 cosa
k
2
xb
x 30, 24
Y
1
Y
2
Y
3
2 cos12x2Y
2
2 cos12x2
k
12 8
2
2
Y
2
cos18t2,Y
1
cos112t2
1m n k2.
Figure 6.35
Figure 6.36
3
3
2
0
College Algebra & Trignometry—
Trigonometric Equations and Inequalities
The ability to draw a quick graph of the trigonometric
functions is a tremendous help in understanding equations
and inequalities. A basic sketch can help reveal the number
of solutions in and the quadrant of each solution.
For nonstandard angles, the value given by the inverse
function can then be used as a basis for stating the solu-
tion set for all real numbers. We’ll illustrate the process
using a few simple examples, then generalize our obser-
vations to solve more realistic applications. Consider the
function a sine wave with amplitude 2,
and a vertical translation of To find intervals in
where we reason that f has a
maximum of and a minimum of
since With no phase
shift and a standard period of we can easily draw a
quick sketch of f by vertically translating x-intercepts and
max/min points 1 unit up. After
drawing the line (see
Figure 6.37), it appears there are
two intersections in the interval,
one in QI and one in QII. More
importantly, it is clear that
between these two
solutions. Substituting 2.5 for f(x)
in we solve for sin x to obtain
which we use to state the solution in exact
form: for
In approximate form the solution interval is
x 10.85, 2.292.
x 1sin
1
0.75, sin
1
0.752.f 1x27 2.5
sin x 0.75,
f 1x2 2 sin x 1,
f 1x27 2.5
y 2.5
2,
1 sin x 1.1 2112 1,
3 2112 1
f 1x27 2.5,30, 22
1.
f 1x2 2 sinx 1,
30, 22
If the function involves a horizontal shift, the graphi-
cal analysis will reveal which intervals should be chosen
to satisfy the given inequality.
Illustration 1
Given solve
for
Solution
Plot the x-intercepts and maximum/minimum
values for a standard sine wave with amplitude 3, then shift
these points units to the right. Then shift each point one
unit down and draw a sine wave
through the points (see Figure
6.38). This sketch along with the
graph of is sufficient to
reveal that solutions to
occur in QI and QIII,
with solutions to
outside this interval. Substituting
for g(x) and isolat-
ing the sine function we obtain
then after taking the inverse
sine of both sides. This is the QI solution, with
being the solution in
x c sin
1
a
1
15
bd
4
x sin
1
a
1
15
b
4
sinax
4
b
1
15
,
1.2
g1x21.2
g1x21.2
y 1.2
4
x 30, 22.g1x21.2
g1x2 3 sinax
4
b 1,
Figure 6.37
Figure 6.38
y 2.5
f(x)
2
3
3
y
x
f(x)
2
4
3
y
x
cob19529_ch06_691-700.qxd 12/29/2008 01:20 PM Page 698
6-85 Cumulative Review Chapters 1–6 699
CUMULATIVE REVIEW CHAPTERS 1–6
College Algebra & Trignometry—
QIII. In approximate form the solution interval is
The basic ideas remain the same regardless of the
complexity of the equation. Remember—our current goal
is not a supremely accurate graph, just a sketch that will
guide us to the solution using the inverse functions and the
correct quadrants. Perhaps that greatest challenge is recall-
ing that when the horizontal shift is but other
than this a fairly accurate sketch can quickly be obtained.
C
B
,B 1,
x 30, 0.724 ´ 33.99, 24.
Practice with these ideas by solving the following inequal-
ities within the intervals specified.
Exercise 1:
Exercise 2:
Exercise 3:
Exercise 4:
f 1x27 25,250; x 30, 3602
f 1x2 15,750 sina
2
360
x
4
b 19,250;
h1x2 150; x 30, 122
h1x2 125 sina
6
x
2
b 175;
g1x22; x 30, 22
g1x2 4 sinax
3
b 1;
f 1x2 3 sin x 2; f 1x27 3.7; x 30, 22
1. Find for all six trig
functions, given
is on the
terminal side with in
QII.
2. Find the lengths of the
missing sides.
3. Verify that
is a zero of
4. Determine the domain of Answer
in interval notation.
5. Standing 5 mi (26,400 ft) from the base of Mount
Logan (Yukon) the angle of elevation to the summit
is . How much taller is Mount McKinley
(Alaska) which stands at 20,320 ft high?
6. Use the Guidelines for Graphing Polynomial
Functions to sketch the graph of
7. Use the Guidelines for Graphing Rational Functions
to sketch the graph of
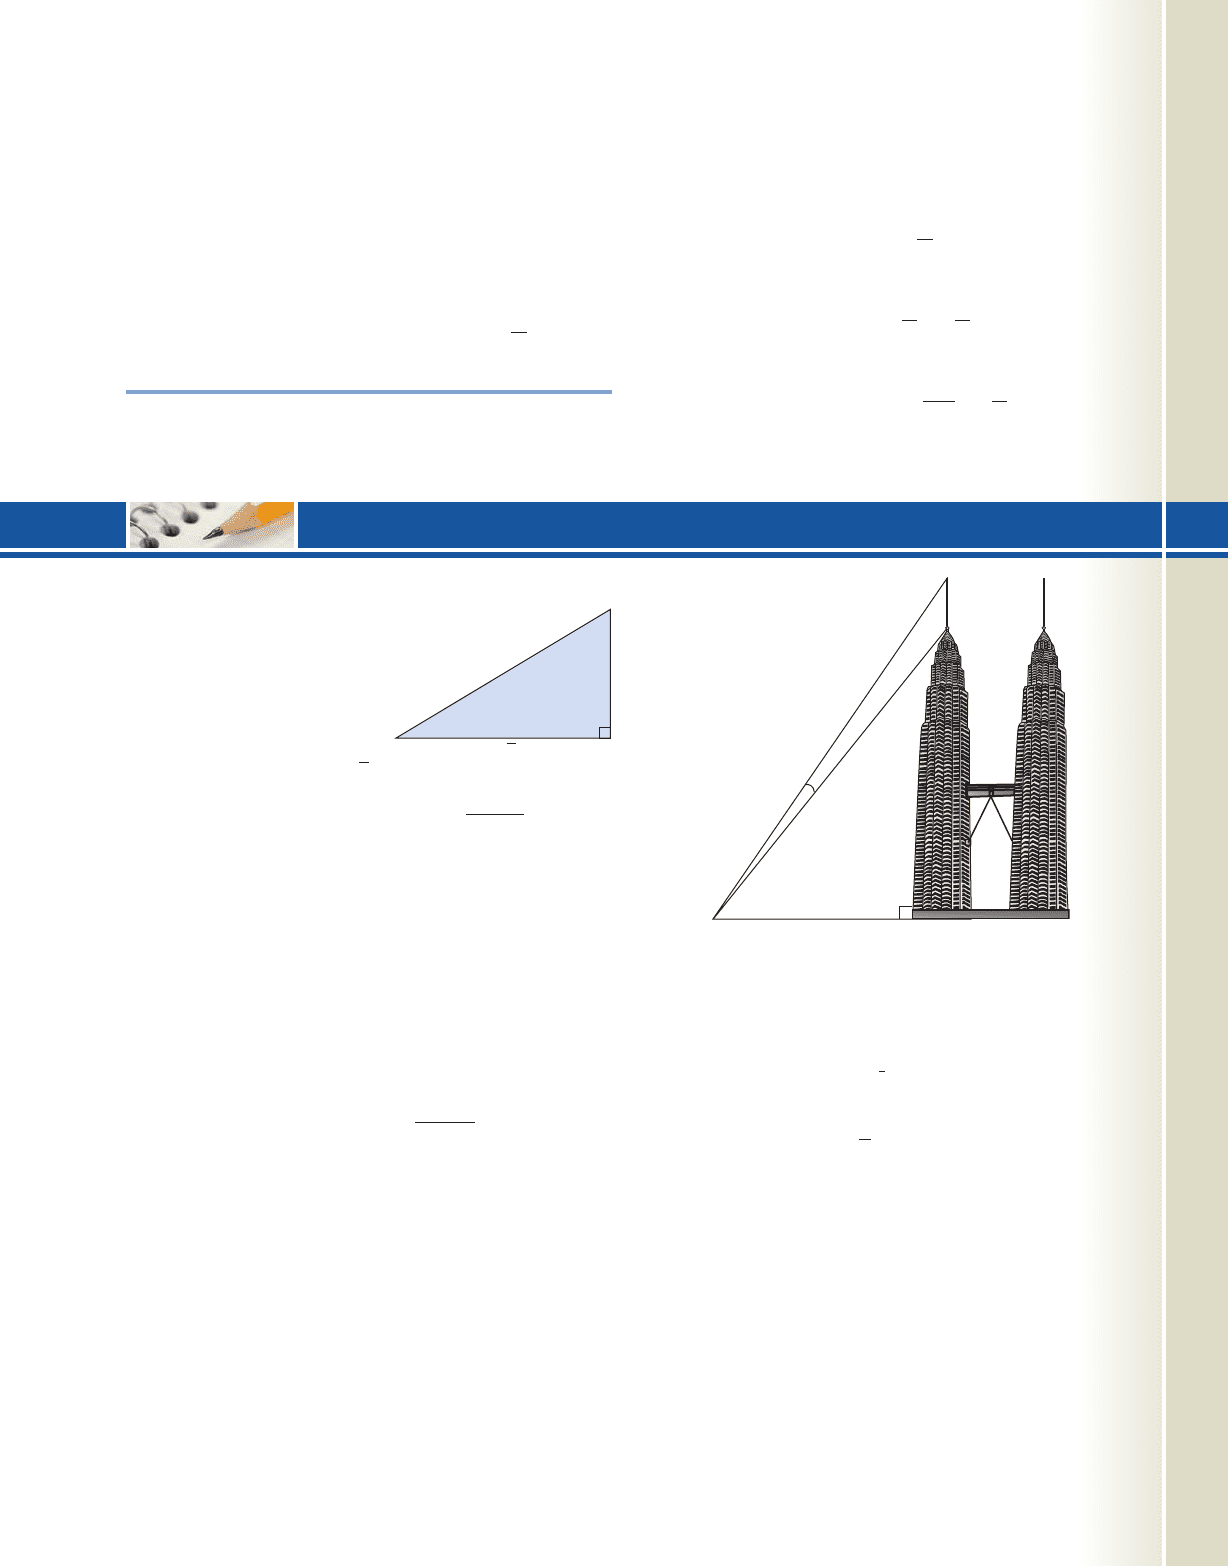
8. The Petronas Towers in Malaysia are two of the
tallest structures in the world. The top of the roof
reaches 1483 ft above the street below and the
stainless steel pinnacles extend an additional 241
ft into the air (see figure). Find the viewing angle
for the pinnacles from a distance of 1000 ft
(the angle formed from the base of the antennae
to its top).
h1x2
x 1
x
2
4
f 1x2 x
3
3x
2
4.
36° 56¿
r1x2 29 x
2
.
g1x2 x
2
4x 1.
x 2 13
P113, 842
f 12
9. A wheel with radius 45 cm is turning at 5
revolutions per second. Find the linear velocity of a
point on the rim in kilometers per hour, rounded to
the nearest 10th of a kilometer.
10. Solve for
11. Solve for x:
12. The Earth has a radius of 3960 mi. Tokyo, Japan, is
located at N latitude, very near the E
latitude line. Adelaide, Australia, is at S
latitude, and also very near E latitude. How
many miles separate the two cities?
139°
34.6°
139°35.4°
3
x
1
2
5 10
x:
21x 32
3
4
1 55.
241 ft
1483 ft
1000 ft
60
5√3
Exercise 2
cob19529_ch06_691-700.qxd 12/29/2008 12:25 PM Page 699