Coburn J.W., Herdlick J.D. College Algebra: Graphs and Models
Подождите немного. Документ загружается.

b. To prove that is an odd function, we must show that
✓
Using , and with symmetry about the origin
produces the graph shown in Figure 2.7.
Now try Exercises 13 through 24
䊳
Finally, some relations also exhibit a third form of symmetry, that of symmetry to
the x-axis. If the graph of a circle is centered at the origin, the graph has both odd and
even symmetry, and is also symmetric to the x-axis. Note that if a graph exhibits x-axis
symmetry, it cannot be the graph of a function.
B. Intervals Where a Function Is Positive or Negative
Consider the graph of shown in Figure 2.8, which has x-intercepts at
( , 0) and (2, 0). As in Section 1.5, the x-intercepts have the form (x, 0) and are called
the zeroes of the function (the x-input causes an output of 0). Just as zero on the num-
ber line separates negative numbers from positive numbers, the zeroes of a function
that crosses the x-axis separate x-intervals where a function is negative from x-intervals
where the function is positive. Noting that outputs (y-values) are positive in Quadrants I
and II, in intervals where its graph is above the x-axis. Conversely, f
1x26 0f 1x27 0
2
f
1x2 x
2
4
h102 0h122 0, h112 3
k
3
4k k
3
4k
1k2
3
41k2ⱨ 3k
3
4k4
h1k2ⱨ h1k2
h1k2h1k2.
h1x2 x
3
4x
190 CHAPTER 2 More on Functions 2–4
College Algebra Graphs & Models—
EXAMPLE 2
䊳
Graphing an Odd Function Using Symmetry
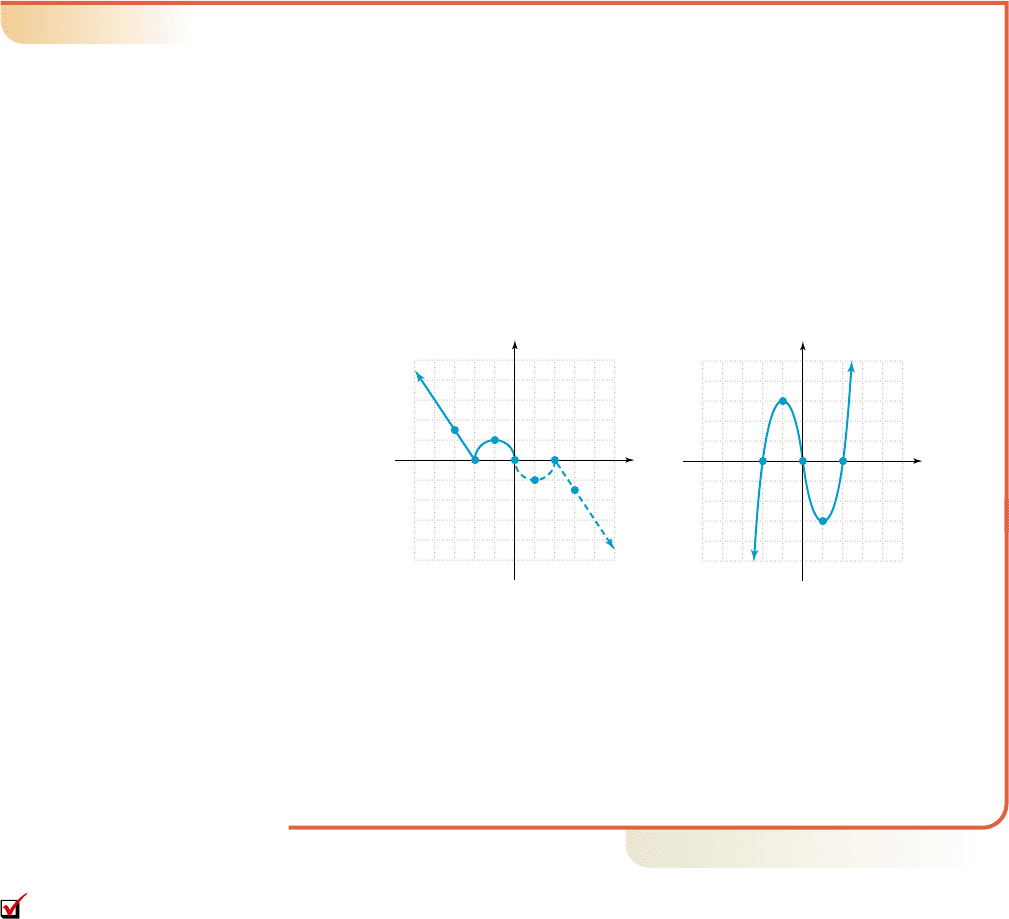
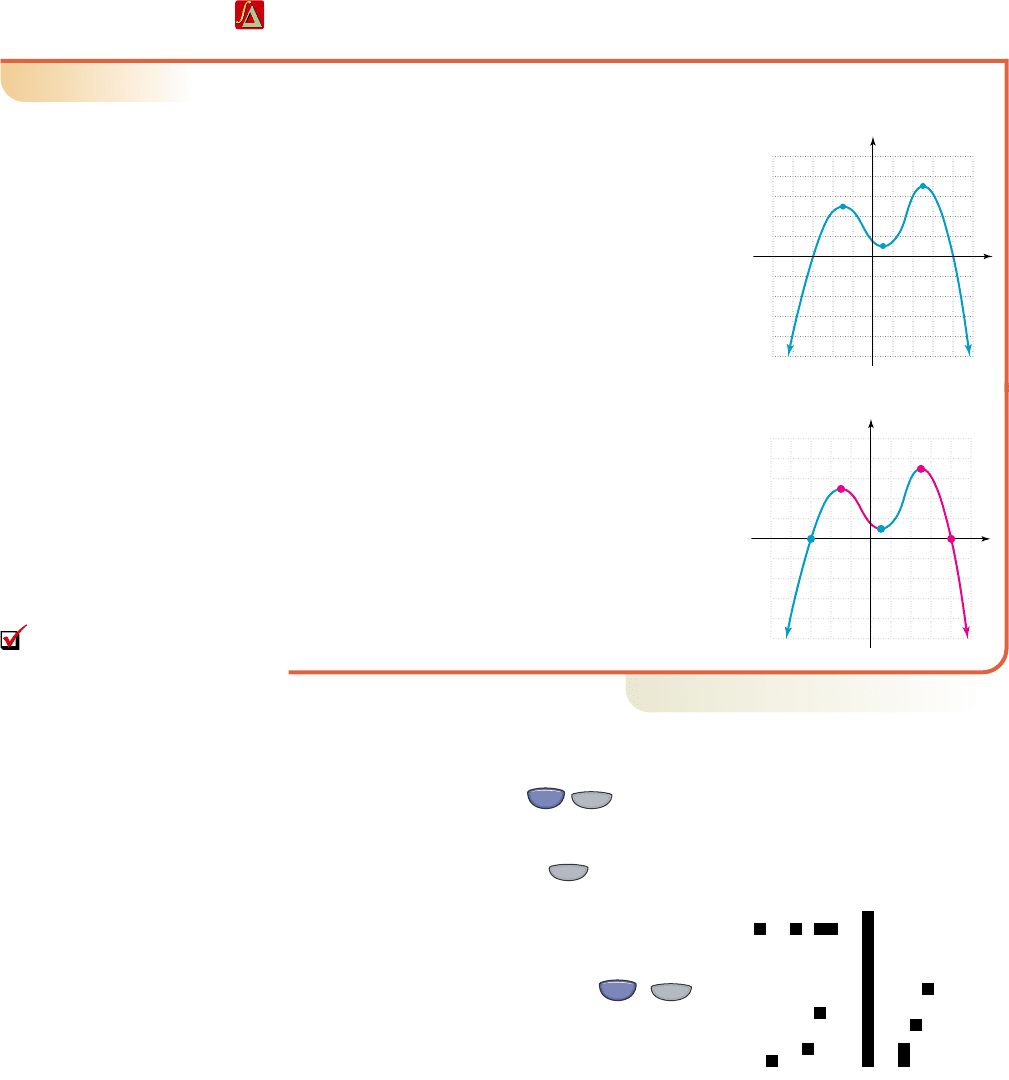
a. In Figure 2.6, the function g(x) given (shown in solid blue) is known to be odd.
Draw the complete graph.
b. Show that is an odd function using the arbitrary value
[show ], then sketch the graph using , , h(0), and
odd symmetry.
Solution
䊳
a. To complete the graph of g, use the points ( , 3), ( , 0), and ( , 2) and
odd symmetry to find additional points. The corresponding ordered pairs are
(6, ), (4, 0), and (2, ), which we use to help draw a “mirror image” of the
partial graph given (see Figure 2.6).
23
246
h112h122h1x2h1x2
x kh1x2 x
3
4x
Figure 2.6 Figure 2.7
1010
10
10
x
y
(2, 2)
(4, 0)
g(x)
(4, 0)
(6, 3)
(2, 2)
(6, 3)
55
5
5
x
y
(1, 3)
(1, 3)
(2, 0) (2, 0)
(0, 0)
h(x)
A. You’ve just seen how
we can determine whether a
function is even, odd, or
neither
cob19545_ch02_187-201.qxd 11/1/10 7:35 AM Page 190
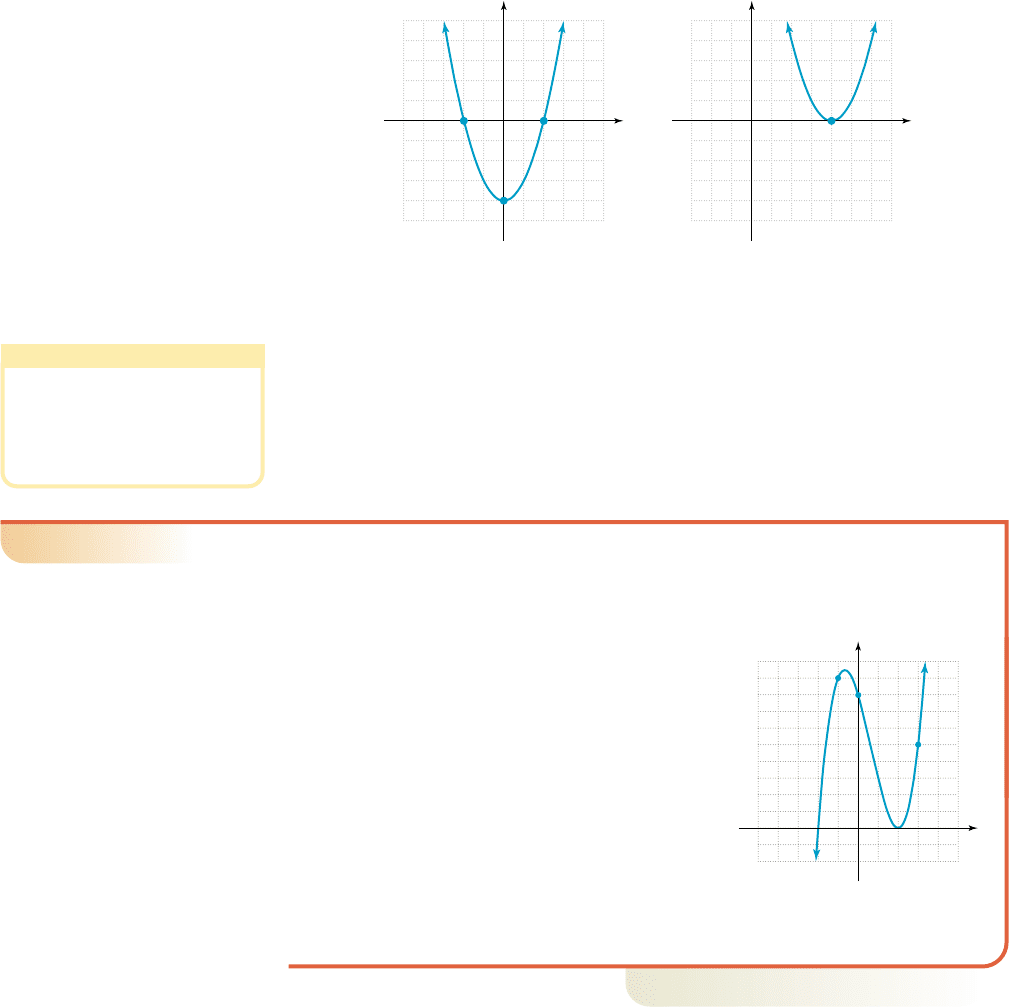
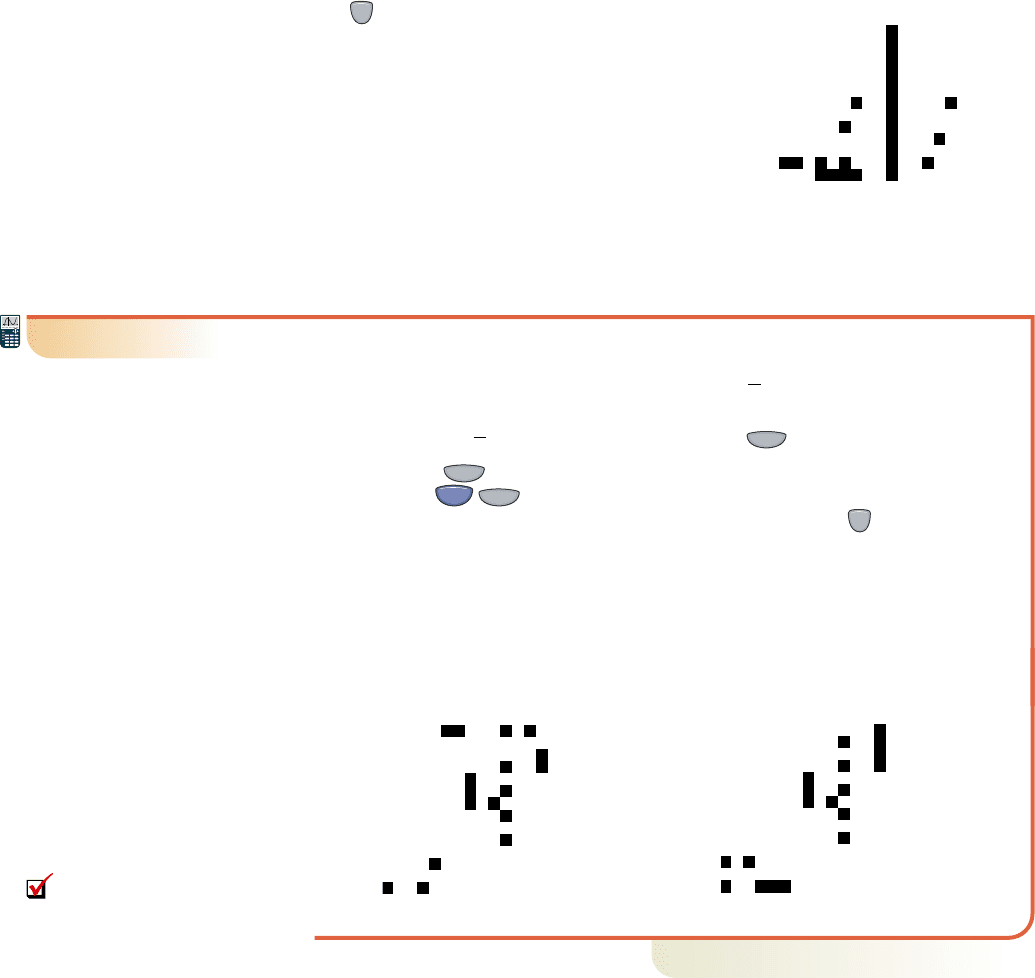
The graph of f is a parabola, with x-intercepts of ( , 0) and (2, 0). Using our pre-
vious observations, we note for since the graph is
above the x-axis, and for . The graph of g is also a parabola, but
is entirely above or on the x-axis, showing for . The difference is that
zeroes coming from factors of the form ( ) (with degree 1) allow the graph to
cross the x-axis. The zeroes of f came from . Zeroes that come
from factors of the form (with degree 2) cause the graph to “bounce” off the
x-axis (intersect without crossing) since all outputs must be nonnegative. The zero of
g came from .
EXAMPLE 3
䊳
Solving an Inequality Using a Graph
Use the graph of given to solve the inequalities
a. b.
Solution
䊳
From the graph, the zeroes of g (x-intercepts)
occur at ( , 0) and (2, 0).
a. For , the graph must be on or above
the x-axis, meaning the solution is
.
b. For , the graph must be below the
x-axis, and the solution is .
As we might have anticipated from the
graph, factoring by grouping gives
, with the graph
crossing the x-axis at , and bouncing
off the x-axis (intersects without crossing)
at .
Now try Exercises 25 through 28
䊳
Even if the function is not a polynomial, the zeroes can still be used to find
x-intervals where the function is positive or negative.
x 2
2
g1x2 1x 221x 22
2
x 1q, 22
g1x26 0
x 32, q2
g1x2 0
2
g1x26 0g1x2 0
g1x2 x
3
2x
2
4x 8
1x 42
2
0
1x r2
2
1x 221x 22 0
x r
x ⺢g1x2 0
x 12, 22f
1x26 0
x 1q, 24 ´ 32, q2f
1x2 0
2
2–5 Section 2.1 Analyzing the Graph of a Function 191
College Algebra Graphs & Models—
Figure 2.8
Figure 2.9
(0, 4)
(2, 0)
55
5
5
x
y
f(x) x
2
4
(2, 0)
(4, 0)
53
5
5
x
y
g(x) (x 4)
2
WORTHY OF NOTE
These observations form the basis
for studying polynomials of higher
degree in Chapter 4, where we
extend the idea to factors of the
form in a study of roots of
multiplicity.
1x r2
n
2
5
y
g(x)
(0, 8)
55
x
in x-intervals where its graph is below the x-axis. To illustrate, compare the graph of f
in Figure 2.8, with that of g in Figure 2.9.
cob19545_ch02_187-201.qxd 11/1/10 7:35 AM Page 191
192 CHAPTER 2 More on Functions 2–6
College Algebra Graphs & Models—
EXAMPLE 4
䊳
Solving an Inequality Using a Graph
For the graph of shown, solve
a.
b.
Solution
䊳
a. The only zero of r is at (3, 0). The graph is on
or below the x-axis for , so
in this interval.
b. The graph is above the x-axis for ,
and in this interval.
Now try Exercises 29 through 32
䊳
This study of inequalities shows how the graphical solutions studied in Section 1.5
are easily extended to the graph of a general function. It also strengthens the founda-
tion for the graphical solutions studied throughout this text.
C. Intervals Where a Function Is Increasing or Decreasing
In our study of linear graphs, we said a graph was increasing if it “rose” when
viewed from left to right. More generally, we say the graph of a function is increas-
ing on a given interval if larger and larger x-values produce larger and larger
y-values. This suggests the following tests for intervals where a function is increasing
or decreasing.
Increasing and Decreasing Functions
Given an interval I that is a subset of the domain, with x
1
and x
2
in I and ,
1. A function is increasing on I if for all x
1
and x
2
in I
(larger inputs produce larger outputs).
2. A function is decreasing on I if for all x
1
and x
2
in I
(larger inputs produce smaller outputs).
3. A function is constant on I if for all x
1
and x
2
in I
(larger inputs produce identical outputs).
f 1x
2
2 f 1x
1
2
f
1x
2
26 f 1x
1
2
f
1x
2
27 f 1x
1
2
x
2
7 x
1
r 1x27 0
x 13, q2
r
1x2 0
x 31, 34
r 1x27 0
r
1x2 0
r
1x2 1x 1 2
1010
x
y
10
10
r(x)
B. You’ve just seen how
we can determine intervals
where a function is positive or
negative
x
f(x) is increasing on I
graph rises when viewed
from left to right
Interval I
f(x
2
)
f(x)
f(x
1
)
x
2
x
1
and f(x
2
) f(x
1
)
for all x I
f(x
1
)
x
1
x
2
f(x
2
)
x
f(x) is decreasing on I
Interval I
f(x
1
)
f(x
2
)
x
2
x
1
and f(x
2
) f(x
1
)
for all x I
x
1
x
2
f(x
2
)
f(x
1
)
f(x)
graph falls when viewed
from left to ri
g
ht
x
f(x) is constant on I
Interval I
f(x
2
)
f(x
1
)
x
2
x
1
and f(x
2
) f(x
1
)
for all x I
f(x
1
)
x
1
x
2
f(x)
graph is level when viewed
from left to ri
g
ht
cob19545_ch02_187-201.qxd 11/1/10 7:35 AM Page 192
Consider the graph of
given in Figure 2.10. Since the parabola opens
downward with the vertex at (2, 9), the function
must increase until it reaches this peak at , and
decrease thereafter. Notationally we’ll write this as
for and for
Using the interval shown below the figure,
we see that any larger input value from the interval
will indeed produce a larger output value, and
on the interval. For instance,
and and
A calculator check is shown in the figure. Note the outputs are increasing until ,
then they begin decreasing.
EXAMPLE 5
䊳
Finding Intervals Where a Function Is Increasing
or Decreasing
Use the graph of v(x) given to name the interval(s)
where v is increasing, decreasing, or constant.
Solution
䊳
From left to right, the graph of v increases until
leveling off at ( , 2), then it remains constant
until reaching (1, 2). The graph then increases
once again until reaching a peak at (3, 5) and
decreases thereafter. The result is for
for and
v(x) is constant for .
Now try Exercises 33 through 36
䊳
Notice the graph of f in Figure 2.10 and the graph of v in Example 5 have some-
thing in common. It appears that both the far left and far right branches of each graph
point downward (in the negative y-direction). We say that the end-behavior of both
graphs is identical, which is the term used to describe what happens to a graph as be-
comes very large. For , we say a graph is, “up on the right” or “down on the
right,” depending on the direction the “end” is pointing. For , we say the graph
is “up on the left” or “down on the left,” as the case may be.
EXAMPLE 6
䊳
Describing the End-Behavior of a Graph
The graph of is shown. Use the
graph to name intervals where f is increasing or
decreasing, and comment on the end-behavior of
the graph.
Solution
䊳
From the graph we observe that for
, and for .
The end-behavior of the graph is down on the left,
and up on the right (down/up).
Now try Exercises 37 through 40
䊳
x 11, 12f 1x2Tx 1q, 12 ´ 11, q2
f
1x2c
f
1x2 x
3
3x
x 6 0
x 7 0
冟
x
冟
x 12, 12
x 13, q2,x 1q, 22 ´ 11, 32, v1x2T
v1x2c
2
x 2
8 7 7
f 1x
2
27 f 1x
1
2f 1127 f 122
x
2
7 x
1
1 7 2
f
1x2c
13, 22
x 12, q2.f
1x2Tx 1q, 22f 1x2c
x 2
f
1x2x
2
4x 5
2–7 Section 2.1 Analyzing the Graph of a Function 193
College Algebra Graphs & Models—
(5, 0)
(2, 9)
(0, 5)
(1, 0)
x (3, 2)
55
10
10
x
y
f(x) x
2
4x 5
Figure 2.10
55
5
5
x
y
v(x)
55
5
5
x
y
f(x) x
2
3x
WORTHY OF NOTE
Questions about the behavior of a
function are asked with respect to
the y outputs: is the function
positive, is the function increasing,
etc. Due to the input/ output,
cause/effect nature of functions,
the response is given in terms of x,
that is, what is causing outputs to
be positive, or to be increasing.
C. You’ve just seen how
we can determine where a
function is increasing or
decreasing
cob19545_ch02_187-201.qxd 11/23/10 8:10 AM Page 193
D. Maximum and Minimum Values
The y-coordinate of the vertex of a parabola that opens downward, and the y-coordinate
of “peaks” from other graphs are called maximum values. A global maximum (also
called an absolute maximum) names the largest y-value over the entire domain. A
local maximum (also called a relative maximum) gives the largest range value in a
specified interval; and an endpoint maximum can occur at an endpoint of the domain.
The same can be said for any corresponding minimum values.
We will soon develop the ability to locate maximum and minimum values for
quadratic and other functions. In future courses, methods are developed to help locate
maximum and minimum values for almost any function. For now, our work will rely
chiefly on a function’s graph.
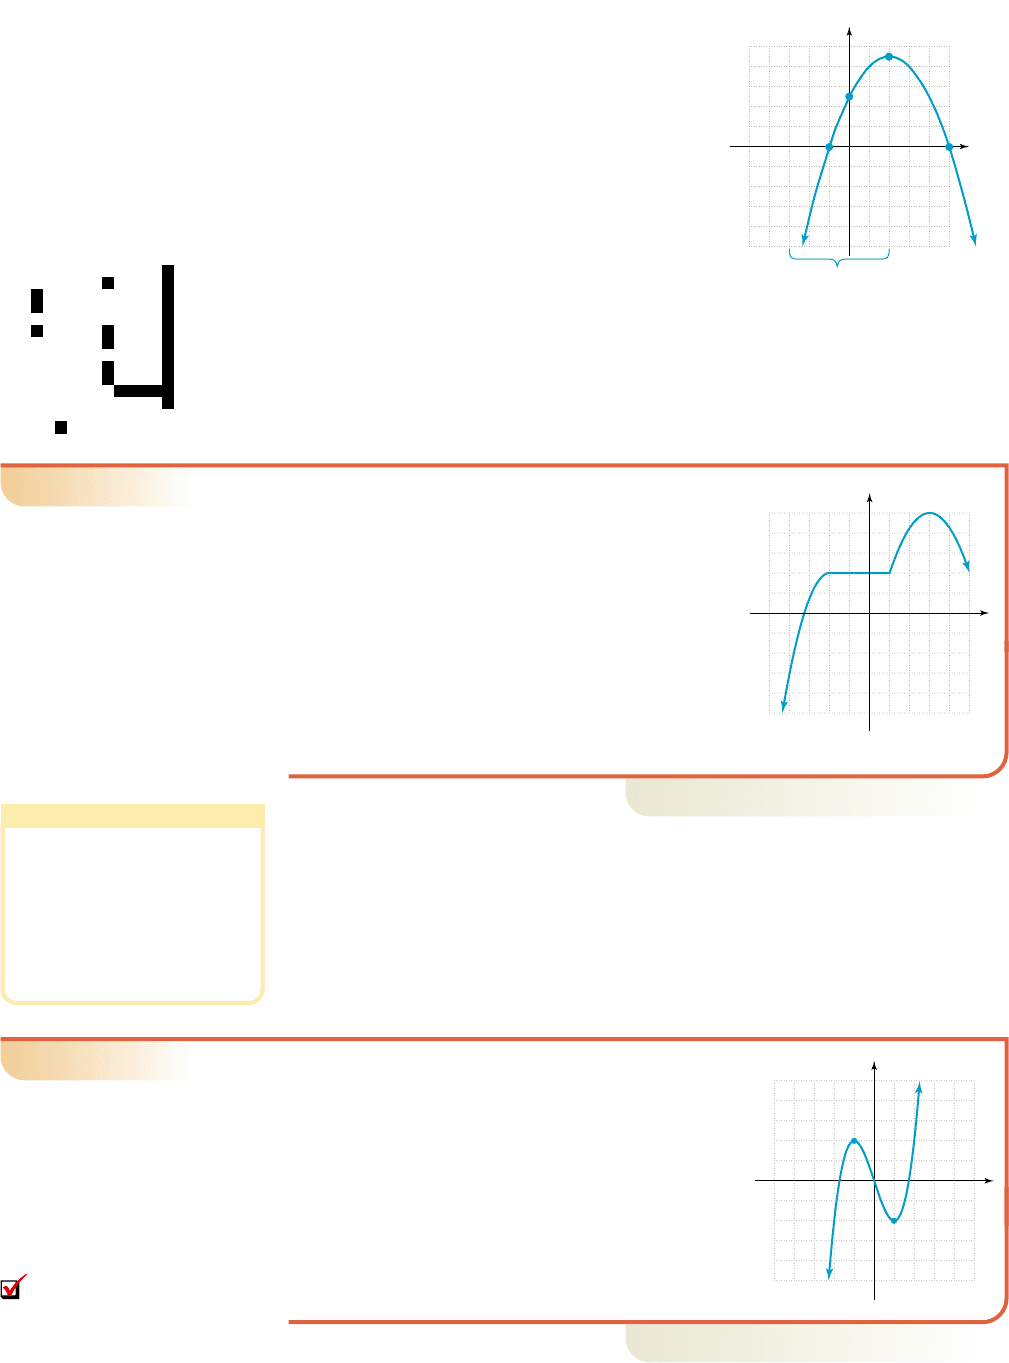
EXAMPLE 7
䊳
Analyzing Characteristics of a Graph
Analyze the graph of function f shown in
Figure 2.11. Include specific mention of
a. domain and range,
b. intervals where f is increasing or decreasing,
c. maximum (max) and minimum (min) values,
d. intervals where and , and
e. whether the function is even, odd, or neither.
Solution
䊳
a. Using vertical and horizontal boundary lines
show the domain is , with a range of:
.
b. for shown
in blue in Figure 2.12, and for
as shown in red.
c. From Part (b) we find that at ( , 5) and
at (5, 7) are local maximums, with a
local minimum of at (1, 1). The point (5, 7)
is also a global maximum (there is no global
minimum).
d. for for
e. The function is neither even nor odd.
Now try Exercises 41 through 48
䊳
E. Locating Maximum and Minimum Values Using Technology
In Section 1.5, we used the (CALC) 2:zero option of a graphing calcula-
tor to locate the zeroes/x-intercepts of a function. The maximum or minimum values
of a function are located in much the same way. To illustrate, enter the function
as Y
1
on the screen, then
graph it in the window shown, where
and . As seen in Figure 2.13, it
appears a local maximum occurs at and
a local minimum at . To actually find the
local maximum, we access the
(CALC) 4:maximum option, which returns
you to the graph and asks for a Left Bound?,a
Right Bound?, and a Guess? as before. Here,
we entered a left bound of “ ,” a right bound3
TRACE
2nd
x 1
x 1
y 35, 54
x 34, 44
Y=
y x
3
3x 2
TRACE
2nd
x 1q, 62 ´ 18, q2
x 36, 84; f
1x26 0f 1x2 0
y 1
y 7
3y 5
x 13, 12 ´ 15, q2
f
1x2T
x 1q, 32 ´ 11, 52f
1x2c
y 1q, 74
x ⺢
f
1x26 0f 1x2 0
194 CHAPTER 2 More on Functions 2–8
College Algebra Graphs & Models—
1010
10
10
x
y
f
(x)
(3, 5)
(5, 7)
(1, 1)
Figure 2.11
Figure 2.12
1010
10
10
x
y
(5, 7)
(8, 0)
(1, 1)
(6, 0)
(3, 5)
D. You’ve just seen how
we can identify the maximum
and minimum values of a
function
4
5
5
4
Figure 2.13
cob19545_ch02_187-201.qxd 11/23/10 8:10 AM Page 194
of “0” and bypassed the guess option by press-
ing a third time (the calculator again sets
the “ ” and “ ” markers to show the bounds
chosen). The cursor will then be located at the
local maximum in your selected interval, with
the coordinates displayed at the bottom of the
screen (Figure 2.14). Due to the algorithm
the calculator uses to find these values, a deci-
mal number very close to the expected value is
sometimes displayed, even if the actual value
is an integer (in Figure 2.14, 0.9999997 is
displayed instead of ). To check, we evaluate and find the local maximum
is indeed 0.
EXAMPLE 8
䊳
Locating Local Maximum and Minimum Values on a Graphing Calculator
Find the maximum and minimum values of .
Solution
䊳
Begin by entering as Y
1
on the screen, and graph the
function in the 6:ZStandard window. To locate the leftmost minimum value,
we access the (CALC) 3:minimum option, and enter a left bound of
“4,” and a right bound of “1” (Figure 2.15). After pressing once more, the
cursor is located at the minimum in the interval we selected, and we find that a
local minimum of occurs at (Figure 2.16). Repeating these steps
using the appropriate options shows a local maximum of occurs at ,
and a second local minimum of occurs at . Note that is
also a global minimum.
y 4.5x 2y 4.5
x 0y 3.5
x 24.5
ENTER
TRACE
2nd
ZOOM
Y=
1
2
1X
4
8X
2
72
f
1x2
1
2
1x
4
8x
2
72
f
1121
䉳䉴
ENTER
2–9 Section 2.1 Analyzing the Graph of a Function 195
College Algebra Graphs & Models—
4
5
5
4
10
10
10
10
10
10
10
10
Now try Exercises 49 through 54
䊳
The ideas presented here can be applied to functions of all kinds, including
rational functions, piecewise-defined functions, step functions, and so on. There is a
wide variety of applications in Exercises 57 through 64.
Figure 2.14
Figure 2.15 Figure 2.16
E. You’ve just seen how
we can locate local maximum
and minimum values using a
graphing calculator
cob19545_ch02_187-201.qxd 11/1/10 7:36 AM Page 195
196 CHAPTER 2 More on Functions 2–10
College Algebra Graphs & Models—
6. Without referring to notes or textbook, list as many
features/attributes as you can that are related to
analyzing the graph of a function. Include details
on how to locate or determine each attribute.
䊳
CONCEPTS AND VOCABULARY
Fill in each blank with the appropriate word or phrase. Carefully reread the section if needed.
2.1 EXERCISES
1. The graph of a polynomial will cross through the
x-axis at zeroes of factors of degree 1, and
off the x-axis at the zeroes from linear
factors of degree 2.
2. If for all x in the domain, we say that
f is an function and symmetric to the
axis. If , the function is
and symmetric to the .
f 1x2f 1x2
f 1x2 f 1x2
3. If for for all x in a given
interval, the function is in the interval.
x
1
6 x
2
f 1x
2
27 f 1x
1
2
5. Discuss/Explain the following statement and give
an example of the conclusion it makes. “If a
function f is decreasing to the left of (c, f(c)) and
increasing to the right of (c, f(c)), then f(c) is either
a local or a global minimum.”
4. If for all x in a specified interval, we
say that f(c) is a local for this interval.
f 1c2 f 1x2
䊳
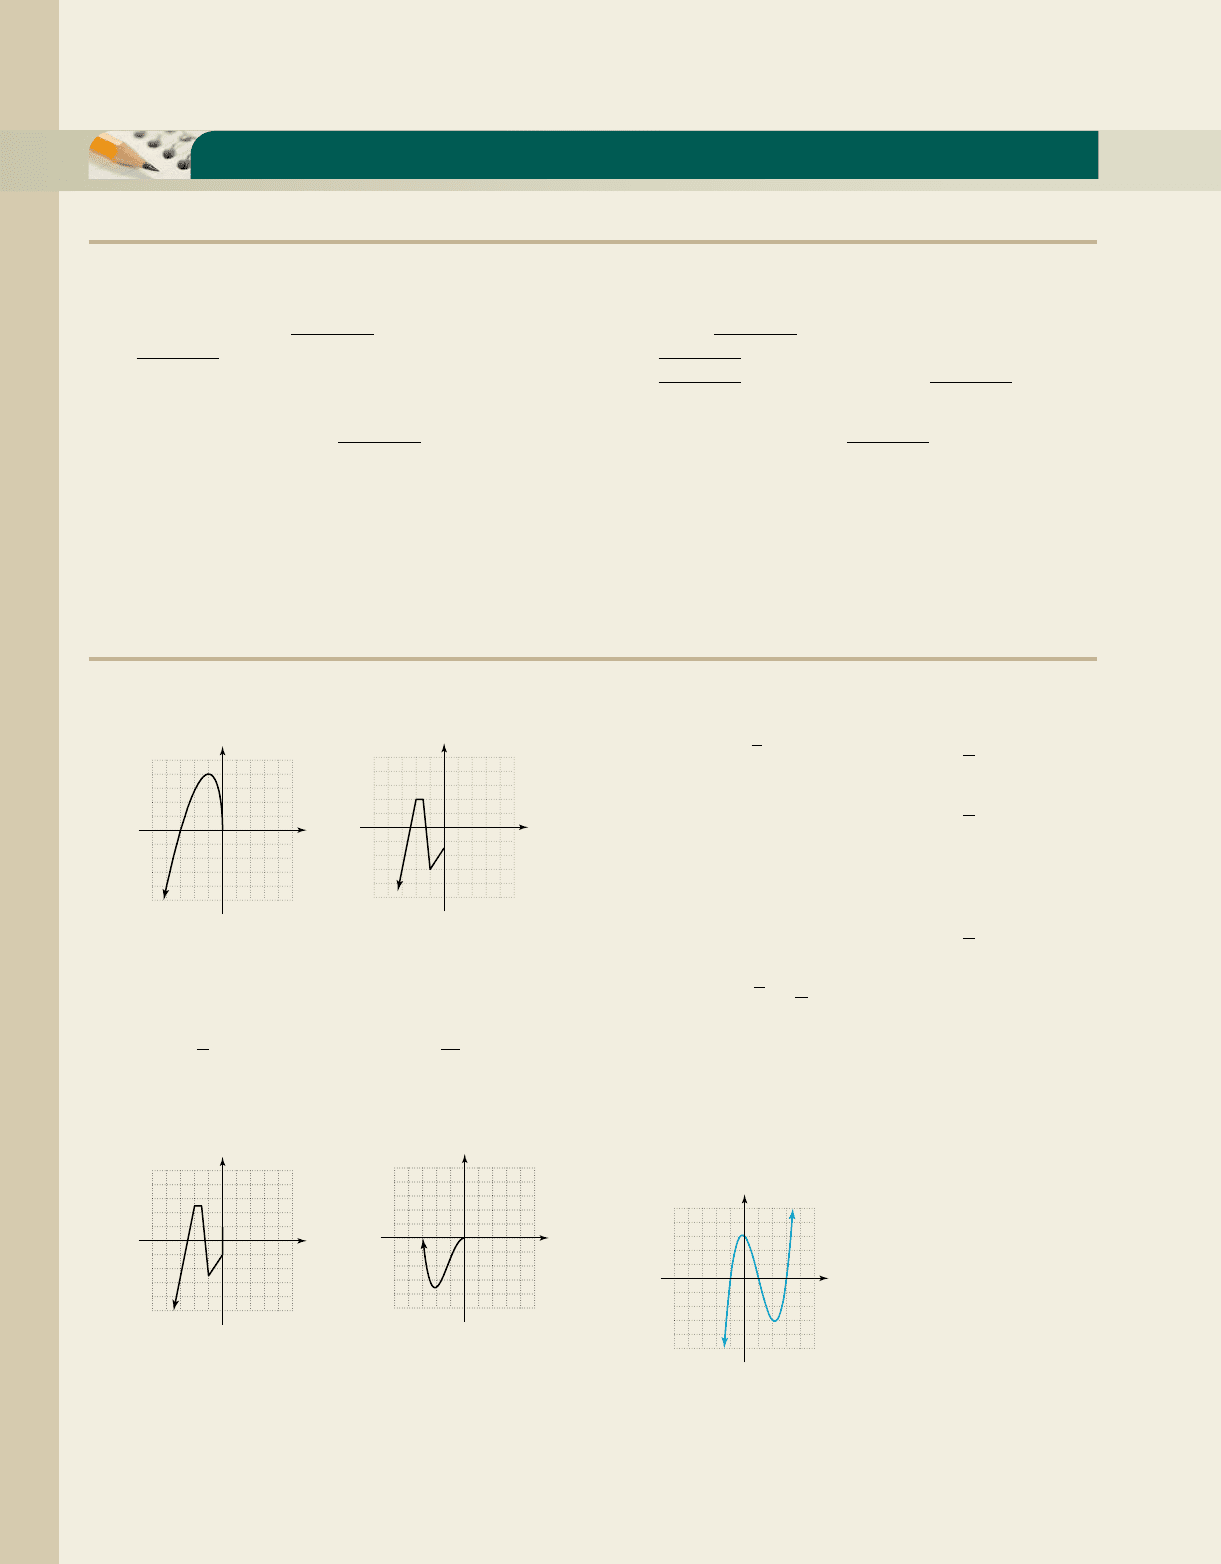
DEVELOPING YOUR SKILLS
The following functions are known to be even. Complete
each graph using symmetry.
7. 8.
Determine whether the following functions are even:
.
9. 10.
11. 12.
The following functions are known to be odd. Complete
each graph using symmetry.
13. 14.
1010
10
10
x
y
1010
10
10
x
y
q1x2
1
x
2
冟
x
冟
g1x2
1
3
x
4
5x
2
1
p1x2 2x
4
6x 1f 1x27
冟
x
冟
3x
2
5
f 1k2 f 1k2
1010
10
10
x
y
55
5
5
x
y
Determine whether the following functions are odd:
.
15. 16.
17. 18.
Determine whether the following functions are even,
odd, or neither.
19. 20.
21. 22.
23. 24.
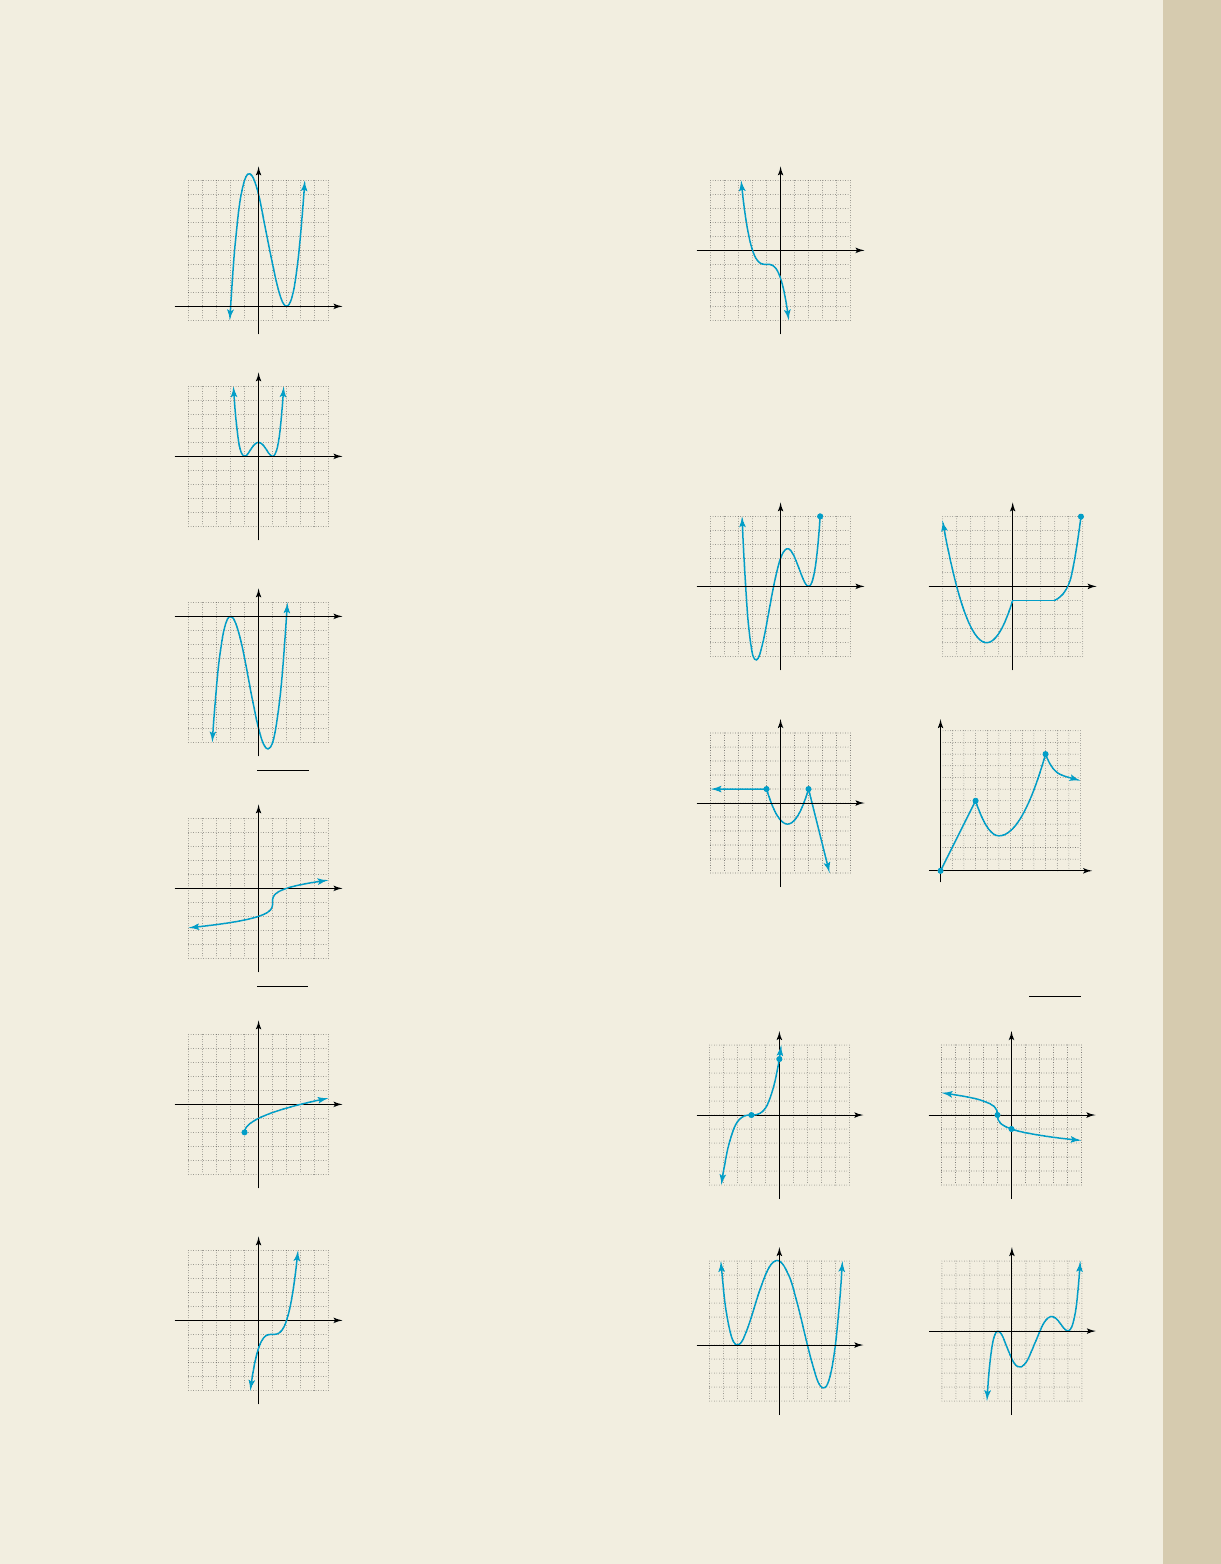
Use the graphs given to solve the inequalities indicated.
Write all answers in interval notation.
25.
55
5
5
x
y
f 1x2 x
3
3x
2
x 3; f 1x2 0
f
1x2 x
4
7x
2
30v1x2 x
3
3
冟
x
冟
g1x2 x
3
7xp1x2 21
3
x
1
4
x
3
q1x2
3
4
x
2
3
冟
x
冟
w1x2 x
3
x
2
q1x2
1
x
xp1x2 3x
3
5x
2
1
g1x2
1
2
x
3
6xf 1x2 41
3
x x
f 1k2f 1k2
cob19545_ch02_187-201.qxd 11/23/10 8:10 AM Page 196
26.
27.
28.
29.
30.
31.
55
5
x
y
f(x)
5
f 1x2 1x 12
3
1; f 1x2 0
55
5
5
x
y
q(x)
q1x2 1x 1 2; q1x27 0
55
5
5
x
y
p(x)
p1x2 1
3
x 1 1; p1x2 0
55
5
1
x
y
f 1x2 x
3
2x
2
4x 8; f 1x2 0
55
5
5
x
y
f 1x2 x
4
2x
2
1; f 1x27 0
5
5
1
5
x
y
f 1x2 x
3
2x
2
4x 8; f 1x27 0 32.
Name the interval(s) where the following functions are
increasing, decreasing, or constant. Write answers using
interval notation. Assume all endpoints have integer
values.
33. 34.
35. 36.
For Exercises 37 through 40, determine (a) interval(s)
where the function is increasing, decreasing or constant,
and (b) comment on the end-behavior.
37. 38.
39. 40.
1010
10
10
x
y
55
3
5
x
y
y g1x2y f 1x2
5
(0, 1)
(1, 0)
5
5
5
x
y
5
(0, 4)
(2, 0)
5
5
5
x
y
q1x21
3
x 1p1x2 0.51x 22
3
108642
10
8
6
4
2
x
y
g(x)
1010
10
10
x
y
f(x)
y g1x2y f 1x2
55
5
5
x
y
H(x)
1010
10
10
x
y
y H1x2y V1x2
55
5
5
x
y
g(x)
g1x21x 12
3
1; g1x26 0
2–11 Section 2.1 Analyzing the Graph of a Function 197
College Algebra Graphs & Models—
cob19545_ch02_187-201.qxd 11/23/10 8:11 AM Page 197
198 CHAPTER 2 More on Functions 2–12
College Algebra Graphs & Models—
䊳
WORKING WITH FORMULAS
55. Conic sections—hyperbola:
While the conic sections are
not covered in detail until
later in the course, we’ve
already developed a number
of tools that will help us
understand these relations
and their graphs. The
equation here gives the
“upper branches” of a hyperbola, as shown in the
figure. Find the following by analyzing the equation:
(a) the domain and range; (b) the zeroes of the
relation; (c) interval(s) where y is increasing or
decreasing; (d) whether the relation is even, odd, or
neither, and (e) solve for x in terms of y.
y
1
3
24x
2
36
56. Trigonometric graphs: and
The trigonometric functions are also studied at
some future time, but we can apply the same tools
to analyze the graphs of these functions as well.
The graphs of and are given,
graphed over the interval . Use
them to find (a) the range of the functions;
(b) the zeroes of the functions; (c) interval(s)
where y is increasing/decreasing; (d) location of
minimum/maximum values; and (e) whether
each relation is even, odd, or neither.
(90, 0)
y cos x
90 180 270 36090180270360
1
1
x
y
90
(90, 1)
180 270 36090180270360
1
1
x
y
y sin x
x 3360°, 360°4
y cos xy sin x
y cos1x2y sin1x2
55
5
y
5
f(x)
x
For Exercises 41 through 48, determine the following
(answer in interval notation as appropriate): (a) domain
and range of the function; (b) zeroes of the function;
(c) interval(s) where the function is greater than or
equal to zero, or less than or equal to zero; (d) interval(s)
where the function is increasing, decreasing, or constant;
and (e) location of any local max or min value(s).
41. 42.
43. 44.
55
5
5
x
y
g(x)
52
2
5
x
y
y h1x2y g1x2
5
(3.5, 0)
5
5
5
x
y
5
(2, 5)
(3, 0)
(1, 0)
(0, 5)
5
5
5
x
y
y f 1x2y H1x2
45. 46.
47. 48.
Use a graphing calculator to find the maximum and
minimum values of the following functions. Round
answers to nearest hundredth when necessary.
49. 50.
51.
52.
53. 54. y x
2
2x 3 2y x24 x
y 0.01x
5
0.03x
4
0.25x
3
0.75x
2
y 0.0016x
5
0.12x
3
2x
y
6
5
1x
3
4x
2
3x2y
3
4
1x
3
5x
2
6x2
4
4
2
2
6
6
8
8
10
10
x
y
1010
10
10
x
y
q1x2
冟
x 5
冟
3p1x2 1x 32
3
1
55
5
5
x
y
55
5
5
x
y
y Y
2
y Y
1
cob19545_ch02_187-201.qxd 11/23/10 8:11 AM Page 198
2–13 Section 2.1 Analyzing the Graph of a Function 199
College Algebra Graphs & Models—
䊳
APPLICATIONS
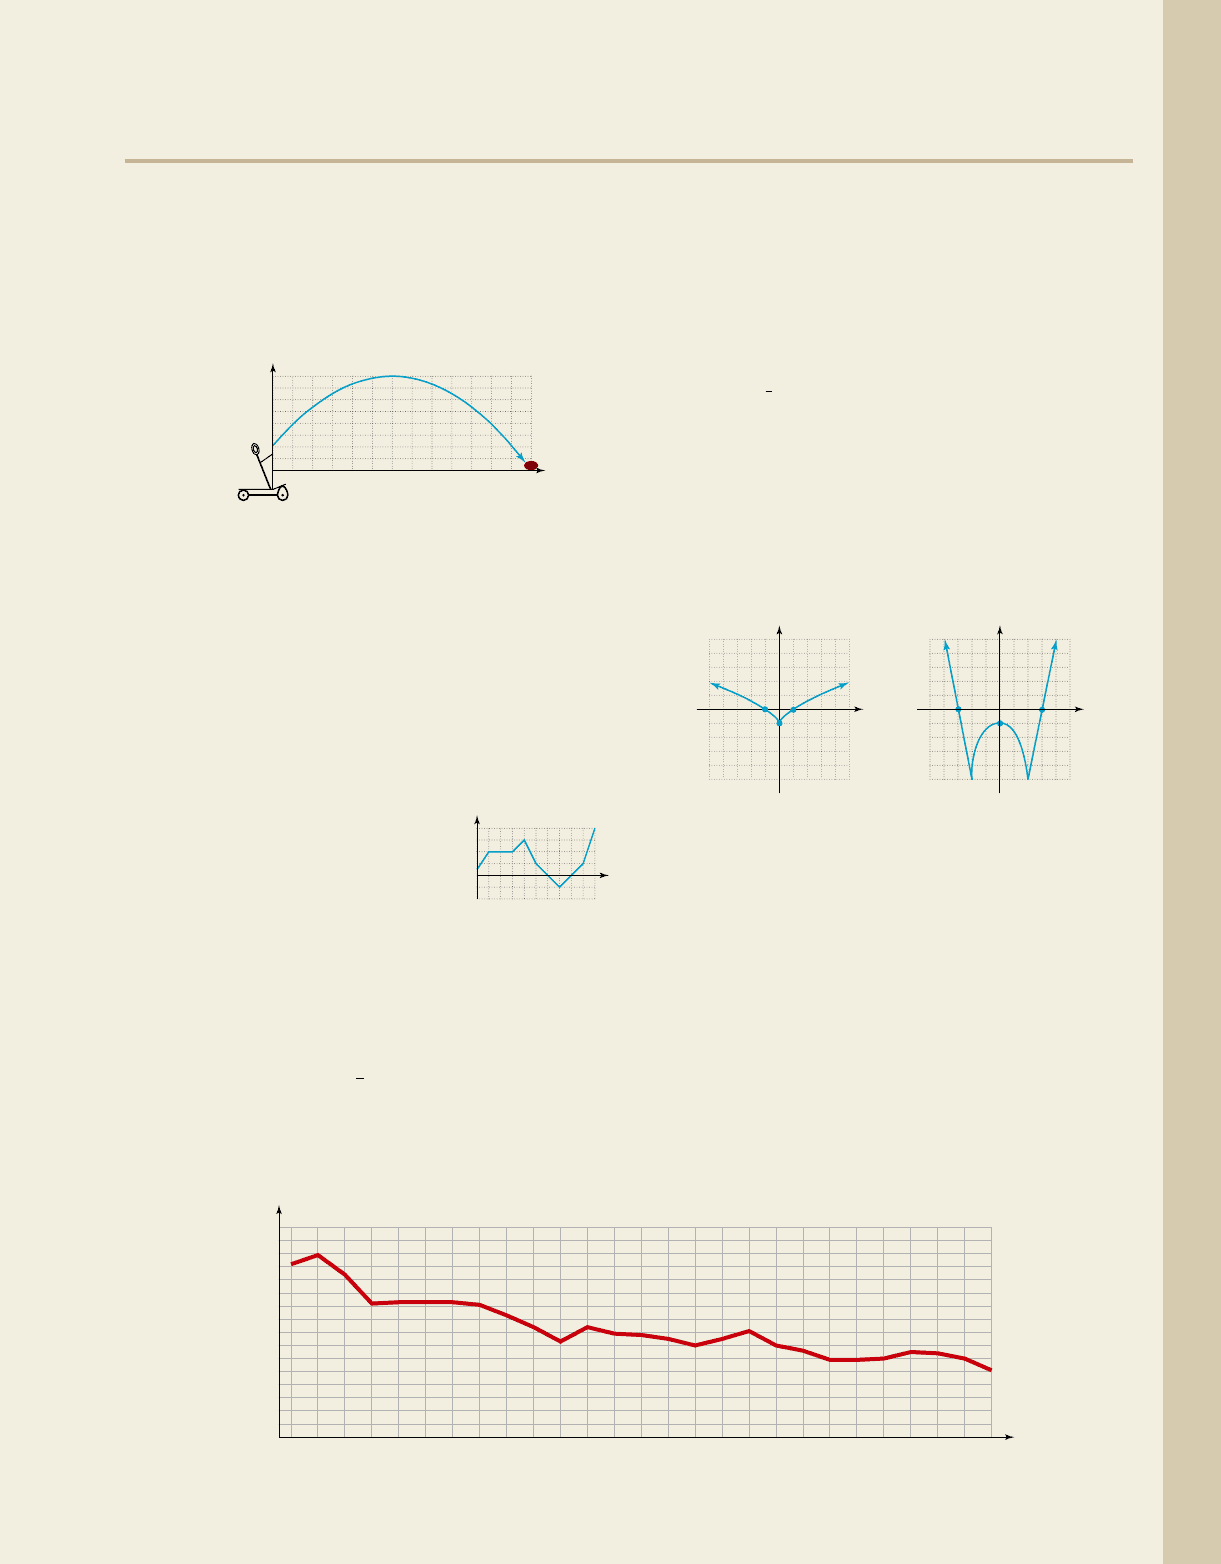
57. Catapults and projectiles: Catapults have a long
and interesting history that dates back to ancient
times, when they were used to launch javelins,
rocks, and other projectiles. The diagram given
illustrates the path of the projectile after release,
which follows a parabolic arc. Use the graph to
determine the following:
a. State the domain and range of the projectile.
b. What is the maximum height of the projectile?
c. How far from the catapult did the projectile
reach its maximum height?
d. Did the projectile clear the castle wall, which
was 40 ft high and 210 ft away?
e. On what interval was the height of the
projectile increasing?
f. On what interval was the height of the
projectile decreasing?
58. Profit and loss: The profit of
DeBartolo Construction Inc.
is illustrated by the graph
shown. Use the graph to
estimate the point(s) or the
interval(s) for which the profit P was:
a. increasing
b. decreasing
30
20 60 100 140 180 220 260
40
50
60
70
80
Height (feet)
Distance (feet)
c. constant
d. a maximum
e. a minimum
f. positive
g. negative
h. zero
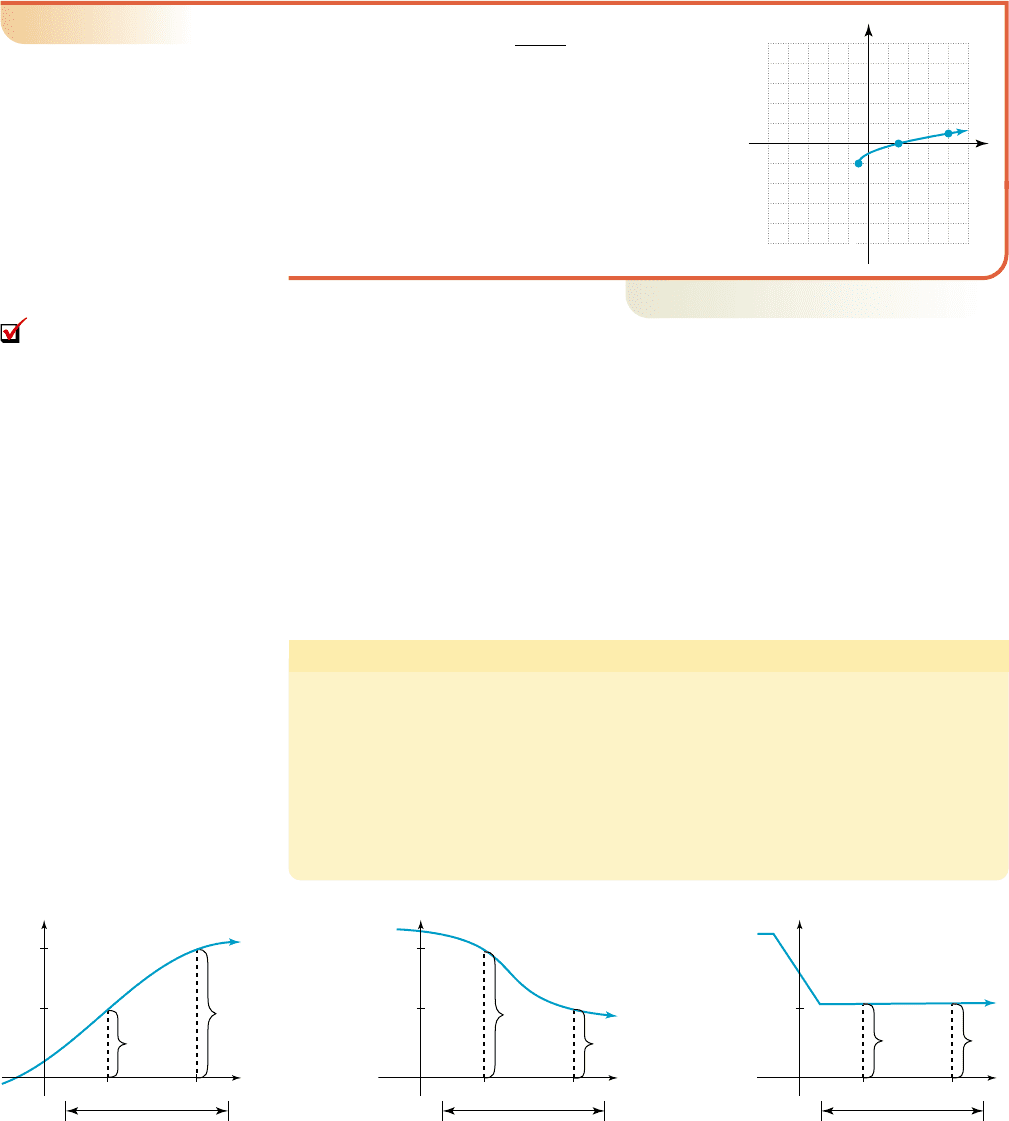
59. Functions and rational exponents: The graph of
is shown. Use the graph to find:
a. domain and range of the function
b. zeroes of the function
c. interval(s) where or
d. interval(s) where f(x) is increasing, decreasing,
or constant
e. location of any max or min value(s)
Exercise 59 Exercise 60
60. Analyzing a graph: Given ,
whose graph is shown, use the graph to find:
a. domain and range of the function
b. zeroes of the function
c. interval(s) where or
d. interval(s) where f(x) is increasing, decreasing,
or constant
e. location of any max or min value(s)
h1x26 0h1x2 0
h1x2
冟
x
2
4
冟
5
55
5
5
(0, 1)
(3, 0) (3, 0)
x
y
55
5
5
(0, 1)
(1, 0)
(1, 0)
x
y
f 1x26 0f 1x2 0
f
1x2 x
2
3
1
4
0
8
12
16
4
8
12345678910
t (years since 1990)
P (millions of dollars)
83 84 85 86 87 88 89 90 91 92 93 94 95 96 97 98 99 00 01 02 03 04 05 06 07 08 09
Mortgage rate
Year (1983 → 83)
14
12
16
10
8
6
4
2
0
t
61. Analyzing interest rates: The graph shown approximates the average annual interest rates I on 30-yr fixed mortgages,
rounded to the nearest . Use the graph to estimate the following (write all answers in interval notation).
a. domain and range b. interval(s) where I(t) is increasing, decreasing, or constant
c. location of any global maximum or d. the one-year period with the greatest rate of increase and
minimum values the one-year period with the greatest rate of decrease
Source: 2009 Statistical Abstract of the United States,
Table 1157
1
4
%
cob19545_ch02_187-201.qxd 11/1/10 7:38 AM Page 199