Concise Hydrology
Подождите немного. Документ загружается.


Download free books at BookBooN.com
Concise Hydrology
91
6. Hydrograph
Solutions 6
Hydrograph
3. The computation is listed below
Time(h) UH(m
3
/s) R
1
*UH(t) R
2
*UH(t-2)
Base
flow
Total
(m
3
/s) above 273m
3
/s
0 0 0 50 50 -223
2 3 6 0 52 58 -215
4 11 22 9 54 85 -188
6 35 70 33 56 159 -114
8 55 110 105 58 273 0
10 66 132 165 60 357 84
12 63 126 198 62 386 113
14 40 80 189 64 333 60
16 22 44 120 66 230 -43
18 9 18 66 68 152 -121
20 2 4 27 70 101 -172
22 0 0 6 72 78 -195
24 0 0 74 74 -199
Rain R
1
=2 cm
Sum of the
positive area
(m
3
)
Rain R
2
= 3 cm 1850400

Download free books at BookBooN.com
Concise Hydrology
92
6. Hydrograph
4. From
>@
0
(,) () ( )
t
Qtt St St t
t
'
' '
'
, and
2 hourt'
,
0
1 hourt'
Time
(hour) S(t) (m
3
/s) S(t-2) UH(2hour)
00 0
116 8
2 226 0 113
3 301 16 142.5
4 341 226 57.5
5 361 301 30
6 371 341 15
7 376 361 7.5
8 376 371 2.5
376 376 0

Download free books at BookBooN.com
Concise Hydrology
93
7. Flow Rounting
7. Flow Routing
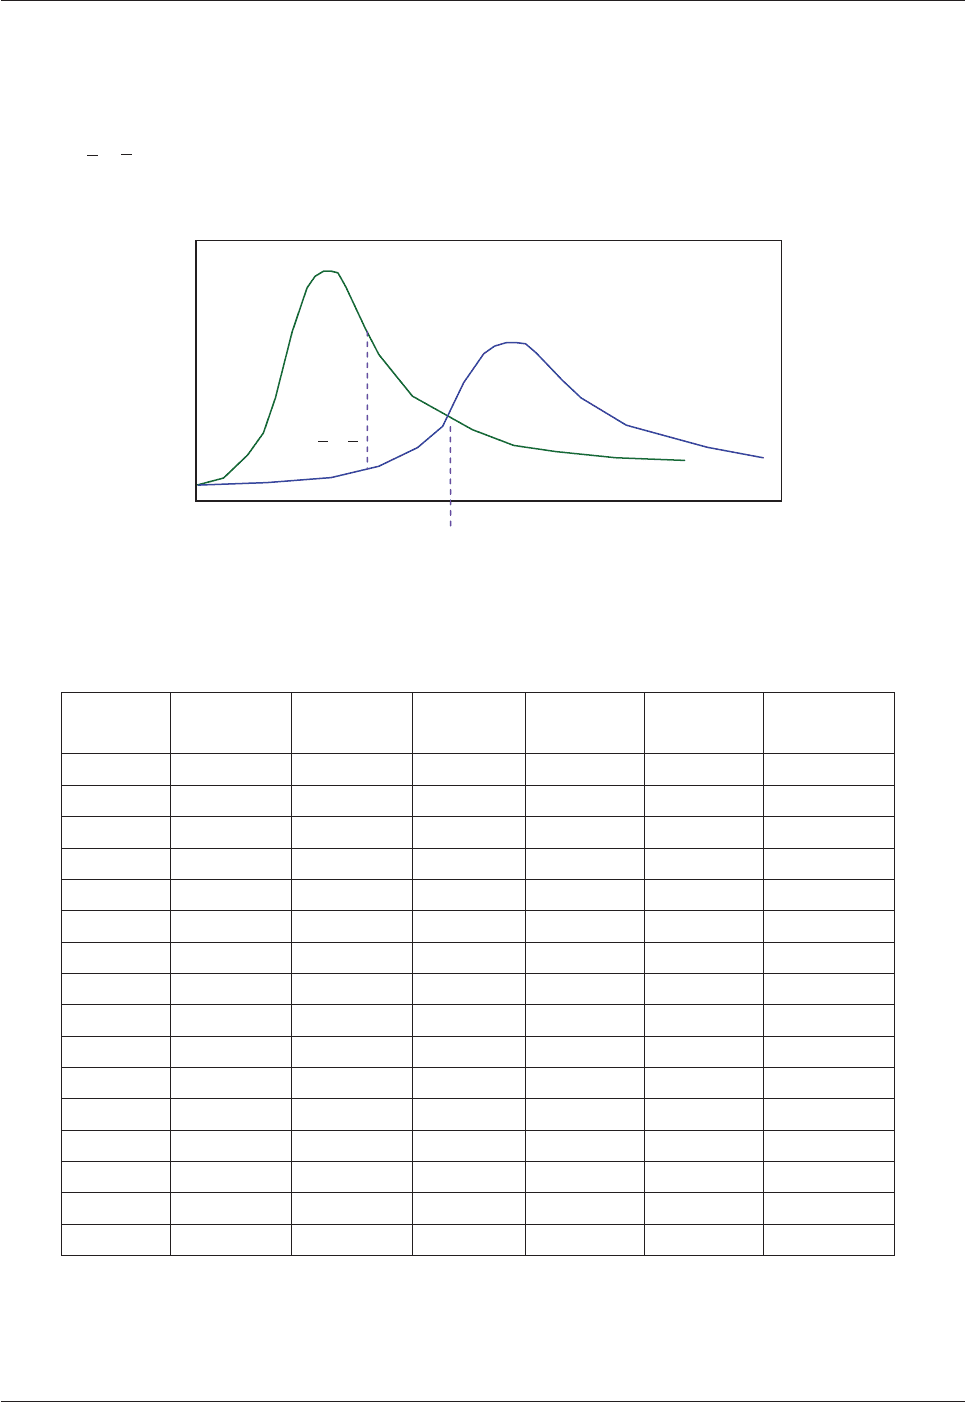
Flow routing is a procedure to estimate downstream hydrograph from upstream hydrograph (Figure 1).
Since flow routing has been widely used in flood estimations, flow routing is usually called flood
routing. The routed hydrograph is delayed by a time lag (translation) and is attenuated. Flow routing is
divided into river flow routing and reservoir flow routing.
Figure 1 Flow routing
Time
Flow
Upstream
h
y
dro
g
ra
p
h
Downstream
h
y
dro
g
ra
p
h
A
ttenuation
Translation
Please click the advert

Download free books at BookBooN.com
Concise Hydrology
94
7. Flow Rounting
7.1 Basic Equations
Figure 2 Flow routing system
From the conservation of mass, water balance for a system in Figure 2 can be expressed as
dS
IO
dt
(1)
where I is upstream inflow , O is downstream outflow, S is the storage (reservoir or a river reach).
In practical calculation, it is more convenient to use a finite difference form of Eq(1) for a
t'
duration.
The mean values for the inflow and outflow are used instead of the instantaneous value.
12 1 2 2 1
22
II OO SS
t
'
(2)
To estimate the downstream outflow, it is also necessary to get the storage function that links the input
and output.
(, )SfIO
(3)
It is then possible to solve the outflow from Eq (2) and (3).
7.2 River Flow Routing (The Muskingum Method)
7.2.1 The outflow equation
The storage function in a river reach is linked with both inflow and outflow.
>@
(1 )SKXI XO
(4)
where K is the storage time constant for the reach, X is a weighing factor ( between 0~ 0.5, usually
around 0.2).
The system
with storage S
(iiti)
Inflow I
Outflow O

Download free books at BookBooN.com
Concise Hydrology
95
7. Flow Rounting
From the water balance equation
12 1 2 2 1
22
II OO SS
t
'
So
>@>@
2211
12 1 2
(1 ) (1 )
22
KXI XO KXI XO
II OO
t
'
Simplify it to get the Muskingum equation
1211202
OCICICO
(5)
where
0
0.5 /CtKXD '
,
1
0.5 /CKX tD '
,
2
0.5 /CKKX tD '
0.5DKKX t '
It is important to check if
1
210
CCC
. If not, some adjustments to the parameters are needed. If
there are rounding errors, adjust the largest C value first.
Since I
1
, I
2
and O
1
are known for every time step, O
2
is solved for successive time steps using each O
2
as O
1
for the next time step. O
1
is assumed the same as I
1
at the beginning if not given.
Practice
Estimate the downstream hydrograph using the Muskingum method with K=3hr and X=0.3. The time
interval is 3 hours. The upstream hydrograph is as follows
Time
(hr) 0369121518
I (m
3
/s) 1 3 9 15 13 10 6
Solution
Calculate the basic parameters
3 3 0.3 0.5 3 3.6D uu
0
(0.5 3 3 0.3) / 3.6 0.17C uu
1
(3 0.3 0.5 3) / 3.6 0.67C uu
2
(3 3 0.3 0.5 3) / 3.6 0.17C u u
Check if
1
210
CCC
0.17 0.67 0.17 1.01
let
1
0.66C
(change the largest weight)
With the routing equation
2021121 2 1 1
0.17 0.66 0.17OCICICO I I O

Download free books at BookBooN.com
Concise Hydrology
96
7. Flow Rounting
Time (h) 0 3 6 9 12 15 18
I (m
3
/s) 1 3 9 15 13 10 6
O (m
3
/s) 1 1.3 3.7 9.1 13.7 12.6 9.8
Figure 3 Muskingum routing results
7.2.2 Estimation of K and X
If there are no downstream records, the K value is estimated from the travel time in the reach (based on
river bed slope and cross section). The X value is usually assumed as 0.2. If there are measured flow
records downstream, more accurate X and K values can be derived from the procedures below.
Always aiming for higher ground.
Just another day at the office for a Tiger.
©
2009 Accenture. All rights reserved.
Visit student.accentureforum.dk
Join the Accenture High Performance Business Forum
On Thursday, April 23rd, Accenture invites top students
to the High Performance Business Forum where you
can learn how leading Danish companies are using
the current economic downturn to gain competitive
advantages. You will meet two of Accenture’s global
senior executives as they present new original research
and illustrate how technology can help forward
thinking companies cope with the downturn.
Visit student.accentureforum.dk to see the program
and register
Please click the advert
Download free books at BookBooN.com
Concise Hydrology
97
7. Flow Rounting
From the Eq (4),
>@
(1 )SKXI XO
, so
S
and
>@
(1 )XI X O
have a linear relationship and its
slope is
K
. The storage S can be worked out by accumulating
()
mean mean
IO
from each time step
1
t
tii
i
SIO
¦
(Figure 4). For
>@
(1 )XI X O
calculations, only use the instantaneous values.
Figure 4 Storage calculation
Table 1 The K and X estimation table
Time
(hr)
I
(m
3
/s)
O
(m
3
/s) S X=0.2 X=0.3 X=0.25
0 31 31 0 31.0 31.0 31.0
6 50 27 11.5 31.6 33.9 32.8
12 86 25 53.5 37.2 43.3 40.3
18 123 30 130.5 48.6 57.9 53.3
24 145 44 227.5 64.2 74.3 69.3
30 150 63 321.5 80.4 89.1 84.8
36 144 82 396 94.4 100.6 97.5
42 128 97 442.5 103.2 106.3 104.8
48 113 106 461.5 107.4 108.1 107.8
54 95 111 457 107.8 106.2 107.0
60 79 111 433 104.6 101.4 103.0
66 65 108 395.5 99.4 95.1 97.3
72 55 101 351 91.8 87.2 89.5
78 46 94 304 84.4 79.6 82.0
84 40 85 257.5 76.0 71.5 73.8
90 35 77 214 68.6 64.4 66.5
Flow
1
t
tii
i
SIO
¦
Water entering storage
Water leaving storage
t
Download free books at BookBooN.com
Concise Hydrology
98
7. Flow Rounting
96 31 70 173.5 62.2 58.3 60.3
102 27 63 136 55.8 52.2 54.0
108 25 56 102.5 49.8 46.7 48.3
114 24 50 74 44.8 42.2 43.5
120 23 45 50 40.6 38.4 39.5
126 22 41 29.5 37.2 35.3 36.3
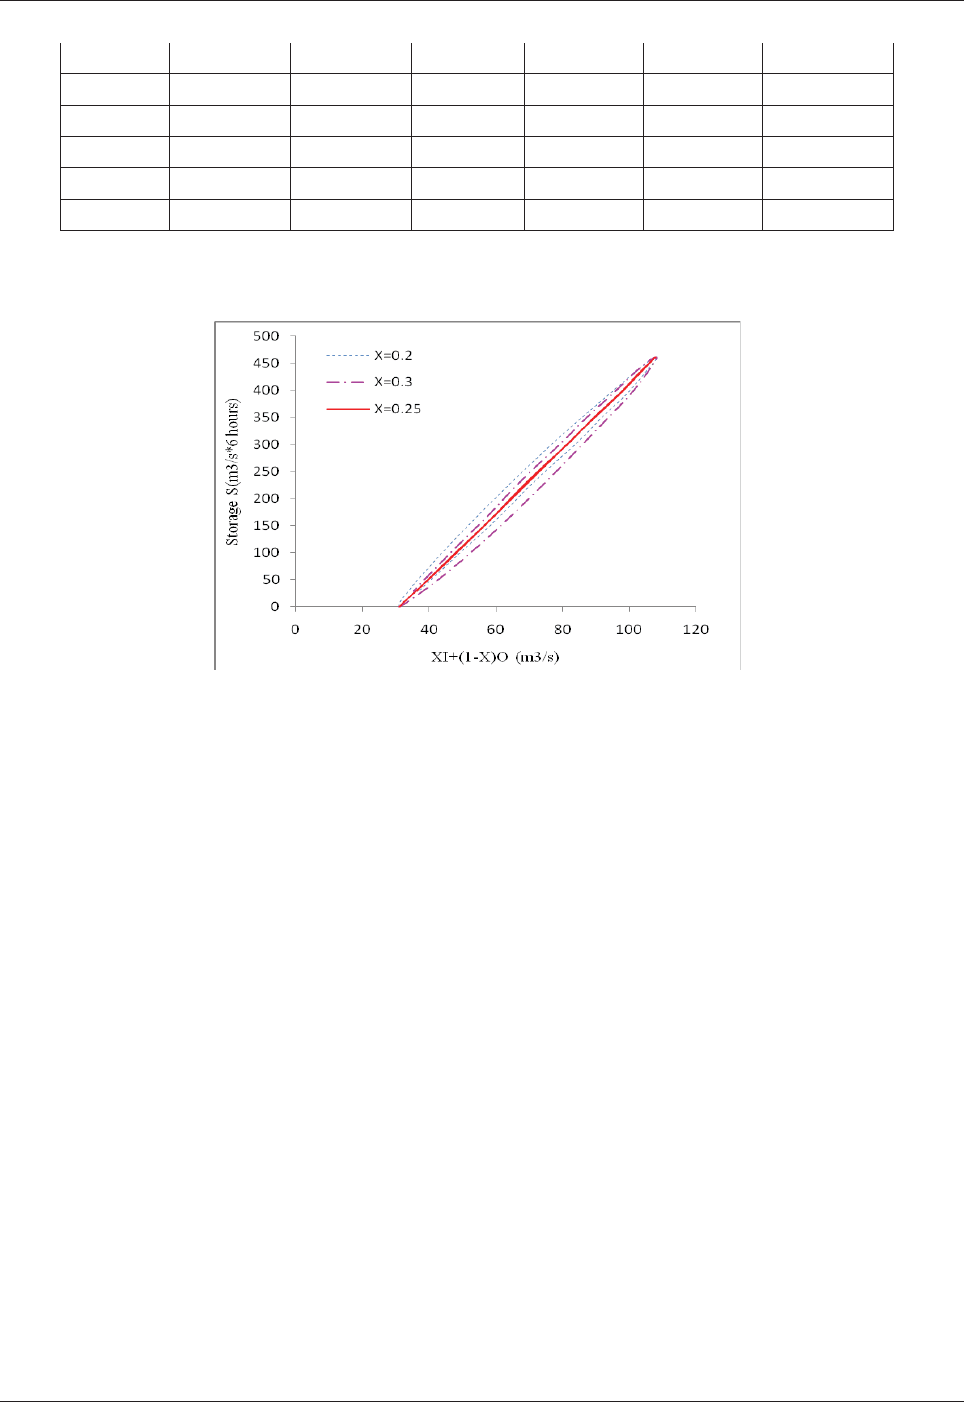
The results from Table 1 are plotted in Figure 5.
Figure 5 Storage loop diagram
From Figure 5, it is clear that X=0.25 curve has the narrowest loop, hence X=0.25 is chosen. The slope
of the line is 6. Since the time interval is 6 hours, so
66 36Khrhr u
. The line’s intercept to the
horizontal axis is not zero because the storage initial value is set as zero instead of 31. Since we are
only interested in the slope, this is not a problem.
7.3 Reservoir Flow Routing
For a flood going through a reservoir, the water level in the reservoir is assumed as horizontal. The
storage function would be linked with the reservoir water level.
()Sfh
(6)
This function can be found from the topographic map. Since the storage below the spillway crest plays
no role in the flow routing process, only the storage above the crest is considered.
Download free books at BookBooN.com
Concise Hydrology
99
7. Flow Rounting
Figure 6 Reservoir flood routing
The discharge over the spillway crest is a function of h as well.
1.5
OCbh
(7)
where C is the discharge coefficient, b is the width of the spillway crest.
From Eq(2)
D
am
S
pillway
h
I
(t)
O(t)
Storage S
it’s an interesting world
Get under the skin of it.
Graduate opportunities
Cheltenham | £24,945 + benefits
One of the UK’s intelligence services, GCHQ’s role is two-fold:
to gather and analyse intelligence which helps shape Britain’s
response to global events, and, to provide technical advice for the
protection of Government communication and information systems.
In doing so, our specialists – in IT, internet, engineering, languages,
information assurance, mathematics and intelligence – get well
beneath the surface of global affairs. If you thought the world was
an interesting place, you really ought to explore our world of work.
www.careersinbritishintelligence.co.uk
Applicants must be British citizens. GCHQ values diversity and welcomes applicants from
all sections of the community. We want our workforce to reflect the diversity of our work.
TOP
GOVERNMENT
EMPLOYER
Please click the advert
Download free books at BookBooN.com
Concise Hydrology
100
7. Flow Rounting
12
12 1 2
22SS
IIO O
tt
''
(8)
The knowns are on the left side and the unknowns are on the right side. The computation time interval
is usually taken as
Duration of the inflow rising limb
5
t'|
(9)
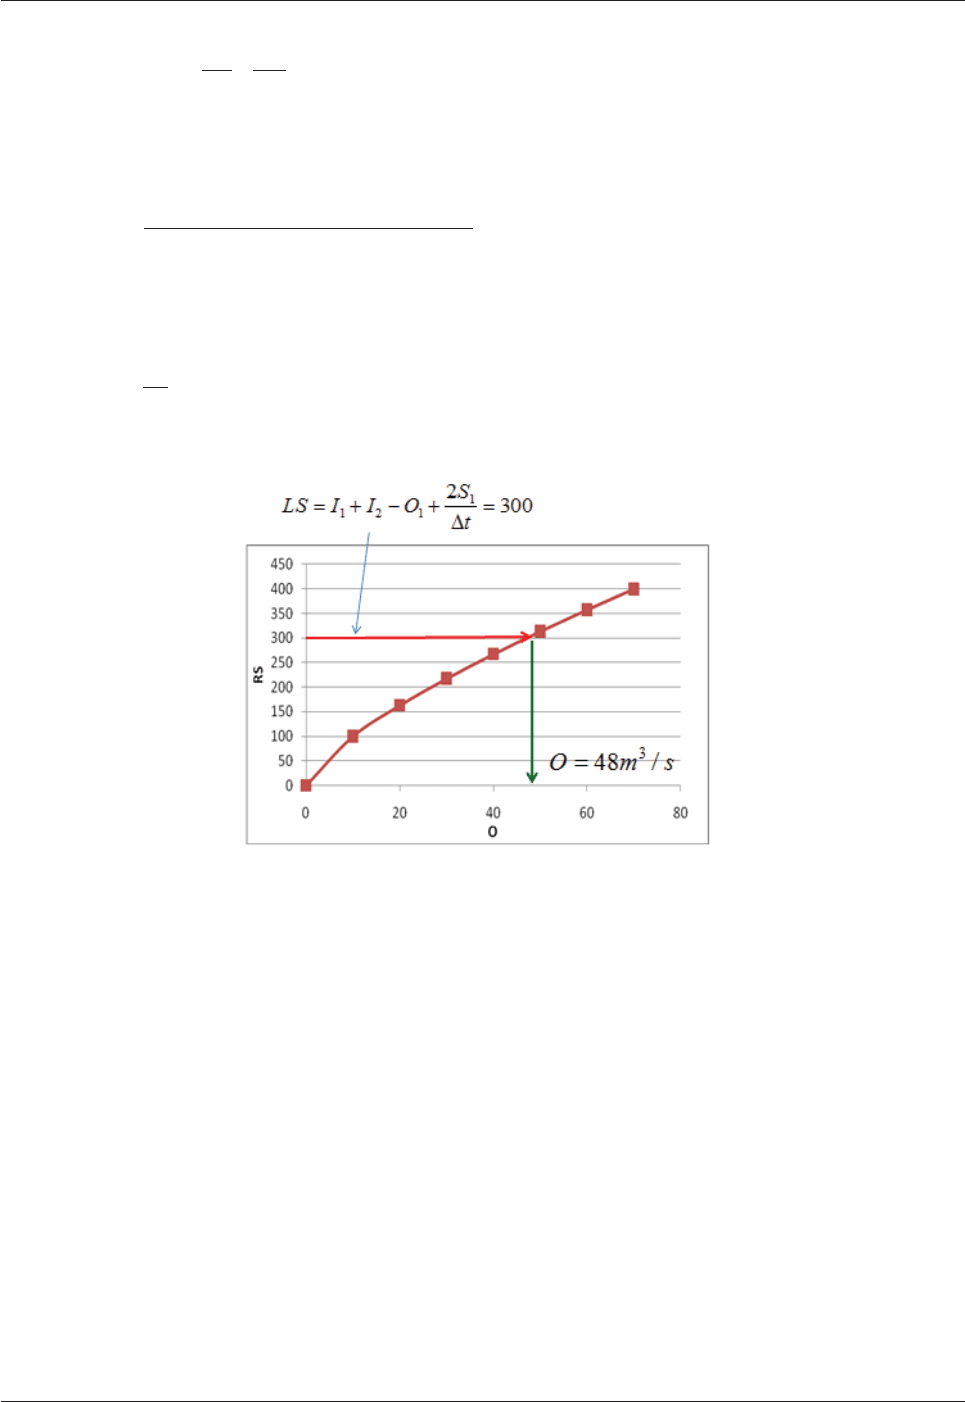
Since Eq(8) is nonlinear, the outflow can be solved either by a graph method or MATAB. To use the
graph method, a curve from the following equation is plotted as in Figure 7.
2S
RS O
t
'
(10)
For each time step, Eq (8) is used to derive RS, and then the outflow O can be found from the curve if
Figure 7.
Figure 7 Curve RS versus O
A typical reservoir flow routing is illustrated in Figure 8. The outflow peak is attenuated by the
reservoir, hence the downstrean flooding risk is reduced.