Grossnick Roy A. United States Naval Aviation, 1910-1995
Подождите немного. Документ загружается.


Aircraft Repair Ships (Engines) (ARVE)
Date of New
Commission Designation Date of
Hull and or Change of Designation
Number Name Decommission Designation Change Disposition & Status
3
Aventinus
30 May 1945 ARVE 3 Transferred to Chile in Aug 1963.
4 Apr 1952
4
Chloris
19 Jun 1945 ARVE 4 Scrapped 1 Jun 1973.
9 Dec 1955
Advanced Aviation Base Ships (AVB)
1
Alameda County
12 Jul 1943 LST 32 Stricken 30 Jun 1962.
25 Jun 1962 AVB 1 28 Sep 1957
2
Tallahatchie County
24 May 1949 LST 1154 Stricken 15 Jan 1970.
15 Jan 1970 AVB 2 3 Feb 1962
Aviation Supply Ships (AVS)
1
Supply
8 Feb 1944 IX 147 Stricken 25 Feb 1946.
4 Feb 1946 AVS 1 25 May 1945
2
Fortune
19 Feb 1944 IX 146 Returned to War Shipping Administration 18 Oct 1945.
18 Oct 1945 AVS 2 25 May 1945
3
Grumium
20 Oct 1943 AK 112 Returned to Maritime Commission 28 Dec 1945.
20 Dec 1945 IX 174 20 Jun 1944
AVS 3 25 May 1945
4
Alioth
25 Oct 1943 AK 109 Transferred to Maritime Commission 13 May 1947.
18 May 1946 IX 204 31 Dec 1944
AVS 4 25 May 1945
5
Gwinnett
10 Apr 1945 AG 92 Returned to Maritime Commission 11 Feb 1946.
11 Feb 1946 AVS 5 25 May 1945
6
Nicollet
27 Apr 1945 AG 93 Stricken 3 Jul 1946.
17 Jun 1946 AVS 6 25 May 1945
7
Pontotoc
22 Mar 1945 AG 94 Stricken and returned to owner 26 Apr 1946.
26 Apr 1946 AVS 7 25 May 1945
8
Jupiter
22 Aug 1942 AK 43 Stricken 1 Aug 1965.
AVS 8 31 Jul 1945
NOTE ON DECOMMISSIONING DATES: There were a number of ships that were decommissioned and then recommissioned for further service. Only the final decommis-
sioning date is listed for these ships. Many ships were also placed out of commission during major rennovations or yard periods. In some cases the records regarding
decommissioning dates were not complete. Consequently, the decommissioning date was left blank if it was unknown.
UNITED STATES NAVAL AVIATION 1910–1995
441
Patrol Craft Tenders (AGP)
These ships were fitted to service PBRs and UH-1 helicopters and worked with the Navy’s riverine Task Force
in South Vietnam beginning in 1967.
Date of New
Commission Designation Date of
Hull and or Change of Designation
Number Name Decommission Designation Change Disposition & Status
786
Garrett County
28 Aug 1944 LST 786 Transferred to South Vietnam 23 Apr 1971.
AGP 786 25 Sep 1970
821
Harnett County
22 Nov 1944 LST 821 Transferred to South Vietnam 12 Oct 1970.
AGP 821 25 Sep 1970
838
Hunterdon County
4 Dec 1944 LST 838 Transferred to Malaysia 1 Jul 1971.
AGP 838 25 Sep 1970
846
Jennings County
9 Jan 1945 LST 846 Stricken 25 Sep 1970.
*
*
Jennings County
was never redesignated AGP although she served in that capacity in Vietnam.
NOTE ON DECOMMISSIONING DATES: There were a number of ships that were decommissioned and then recommissioned for further service. Only the final decommis-
sioning date is listed for these ships. Many ships were also placed out of commission during major rennovations or yard periods. In some cases the records regarding
decommissioning dates were not complete. Consequently, the decommissioning date was left blank if it was unknown. I
442 UNITED STATES NAVAL AVIATION 1910–1995
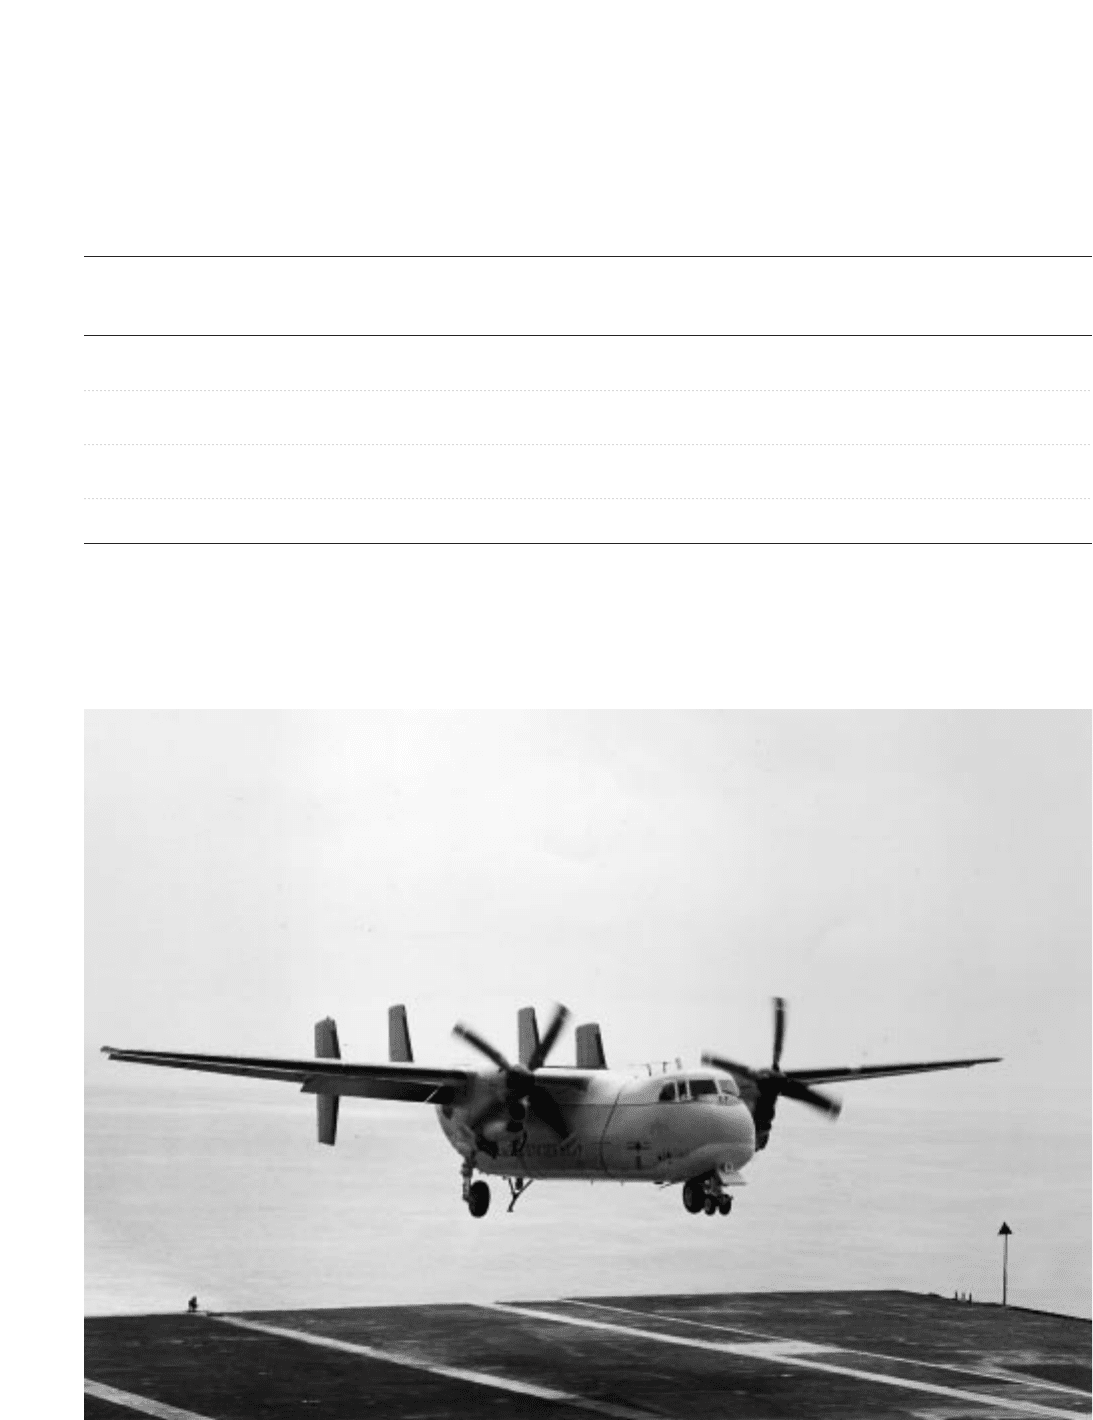
The transport workhorse for carrier-onboard-delivery (COD), the C-2A Greyhound, lands aboard Kitty Hawk.

Ship Designations
AC Collier
AG Miscellaneous Auxiliary
AGC Amphibious Force Flagship
AGMR Major Communications Relay Ship
AGOR Oceanographic Research Ship
AGP Patrol Craft Tender (Motor Torpedo Boat Tender, Old Design.)
AGS Surveying Ship
AKV Aircraft Ferry; later, Cargo Ship and Aircraft Ferry.
AM Mine Sweeper
AO Fleet Oiler
AP Transport
APV Transport and Aircraft Ferry
ARG Repair Ship, Engines
ARV Aircraft Repair Ship
ARVA Aircraft Repair Ship (Aircraft)
ARVE Aircraft Repair Ship (Engines)
ARVH Aircraft Repair Ship (Helicopter)
AV Seaplane Tender
AVB Advanced Aviation Base Ship
AVD Seaplane Tender (Destroyer)
AVM Guided Missiles Ship
AVP Seaplane Tender (Small)
AVS Aviation Supply Ship
AVT Auxiliary Aircraft Transport
AZ Lighter-than-air Tender
CV Aircraft Carrier
CVA Attack Aircraft Carrier
CVAN Nuclear-Powered Attack Aircraft Carrier
CVB Aircraft Carrier, Large (Old)
CVE Escort Aircraft Carrier
CVHA Assault Helicopter Aircraft Carrier until 1963—later LPH
CVHE Escort Helicopter Aircraft Carrier (Old)
CVL Small Aircraft Carrier
CVS Antisubmarine Warfare Support Aircraft Carrier
CVU Utility Aircraft Carrier
DD Destroyer
IX Miscellaneous auxiliary
LHA Amphibious Assault Ship (General Purpose)
LHD Amphibious Assault Ship (Multi-Purpose)
LPH Amphibious Assault Ship (Helicopter)
LPD Amphibious Assault Ship
LST Landing Ship,Tank
T-ARVH Associated with ARVH, indicates operated by military Sealift Command, formerly Military
Sea Transportation Service.
UNITED STATES NAVAL AVIATION 1910–1995 443

Aviation Ships in Active Status as of 1 July
YEAR CV CVS CVL CVE LHA/ AV AVD AVP AVM ARV AVS AKV AGP AVB CVT/
** LPH/ AVT
LHD
***
1922 1 — - — — 1 — 2 — — — — — — —
1923 1 — — — — 1 — 2 — — — — — — —
1924 1 — — — — 1 — 3 — — — — — — —
1925 1 — — — — 1 — 6 — — — — — — —
1926 1 — — — — 1 — 6 — — — — — — —
1927 3 — — — — 1 — 8 — — — — — — —
1928 3 — — — — 1 — 10 — — — — — — —
1929 3 — — — — 1 — 10 — — — — — — —
1930 3 — — — — 2 — 10 — — — — — — —
1931 3 — — — — 2 — 11 — — — — — — —
1932 3 — — — — 2 — 10 — — — — — — —
1933 3 — — — — 2 — 10 — — — — — — —
1934 4 — — — — 2 — 9 — — — — — — —
1935 4 — — — — 2 — 8 — — — — — — —
1936 4 — — — — 1 — 9 — — — — — — —
1937 3 — — — — 2 — 9 — — — — — — —
1938 5 — — — — 2 — 9 — — — — — — —
1939 5 — — — — 2 — 11 — — — — — — —
1940 6 — — — — 2 — 16 — — — — — — —
1941 6 — — 1 — 5 14 9 — — — — — — —
1942 5 — — 3 — 5 14 14 — — — 2 — — —
1943 7 — 5 17 — 6 14 20 — — — 2 — — —
1944 13 — 9 63 — 10 5 27 — — — 2 — — —
1945 20 — 8 70 — 11 5 36 — 6 7 2 — — —
1946 14 — 1 10 — 8 — 11 — 4 1 — — — —
1947 12 — 2 8 — 5 — 9 — 1 — — — — —
1948 11 — 2 7 — 5 — 7 — 1 — — — — —
1949 8 — 3 7 — 5 — 9 — — — — — — —
1950 7 — 4 4 — 3 — 7 — — — — — — —
1951 14 — 4 10 — 4 — 9 1 4 1 — — — —
1952 16 — 5 12 — 5 — 11 1 3 1 — — — —
1953 17 — 5 12 — 5 — 11 1 3 1 — — — —
1954 16 4 3 7 — 5 — 11 1 2 1 — — — —
1955 17 5 2 3 — 5 — 8 1 2 1 — — — —
1956 19 7 1 3 — 5 — 7 1 — 1 — — — —
1957 16 8 1 — 1 4 — 7 1 — 1 — — 1 —
1958 15 11 — — 1 4 — 6 1 — 1 — — 1 —
1959 14 10 — — 3 3 — 6 1 — 1 — — 1 —
1960 14 10 — — 3 3 — 3 1 — 1 — — 1 —
1961 15 10 — — 4 3 — 3 1 — 1 — — 1 —
1962 16 10 — — 6 3 — 3 1 — 1 — — 1 —
1963 15 10 — — 6 3 — 3 1 — 1 — — 1 —
1964 15 10 — — 6 3 — 3 1 — 1 — — 1 —
1965 15 10 — — 7 3 — 3 1 — 1 — — 1 —
1966 17 10 — — 8 4 — 4 1 — 1 — 4 1 —
1967 16 9 — — 8 4 — — 1 — 1 — 4 1 —
1968 15 9 — — 9 3 — — 1 — 1 — 4 1 —
1969 15 8 — — 8 3 — — 1 — — — 4 1 1
1970 15 4 — — 7 3 — — 1 — — — 4 1 1
444 UNITED STATES NAVAL AVIATION 1910–1995

Aviation Ships in Active Status as of 1 July—Continued
YEAR CV CVS CVL CVE LHA/ AV AVD AVP AVM ARV AVS AKV AGP AVB CVT/
** LPH/ AVT
LHD
***
1971 14 4 — — 7 3 — — 1 — — — 2 — 1
1972 14 2 — — 7 — — — 1 — — — — — 1
1973 14 2 — — 7 — — — 1 — — — — — 1
1974 14 — — — 7 — — — 1 — — — — — 1
1975 15 — — — 7 — — — 1 — — — — — 1
1976 13 — — — 8 — — — 1 — — — — — 1
1977 13 — — — 9 — — — 1 — — — — — 1
1978 13 — — — 9 — — — 1 — — — — — 1
1979 13 — — — 11 — — — 1 — — — — — 1
1980 13 — — — 12 — — — 1 — — — — — 1
1981* 12 — — — 12 — — — 1 — — — — — 1
1982* 13 — — — 12 — — — 1 — — — — — 1
1983* 13 — — — 12 — — — 1 — — — — — 1
1984* 13 — — — 12 — — — 1 — — — — — 1
1985* 13 — — — 12 — — — 1 — — — — — 1
1986* 13 — — — 12 — — — 1 — — — — — 1
1987* 14 — — — 12 — — — — — — — — — 1
1988* 14 — — — 12 — — — — — — — — — 1
1989* 14 — — — 12 — — — — — — — — — 1
1990* 14 — — — 13 — — — — — — — — — 1
1991* 14 — — — 13 — — — — — — — — — 1
1992* 13 — — — 13 — — — — — — — — — 1
1993* 13 — — — 12 — — — — — — — — — 1
1994* 12 — — — 13 — — — — — — — — — —
1995* 12 — — — 13 — — — — — — — — — —
1996* 13 — — — 13 — — — — — — — — — —
Footnotes:
* During this reporting period, 1981–1996, the total carriers listed under CV does not include the carrier undergoing a major Service Life Extension Program.
** Includes all designations CV, CVA, CVB, CVAN and CVN, that have been used for the Fleet carriers; missions the same.
*** These LHA/LPH/LHDs are counted the same since mission is very similar.
UNITED STATES NAVAL AVIATION 1910–1995
445
446 UNITED STATES NAVAL AVIATION 1910–1995
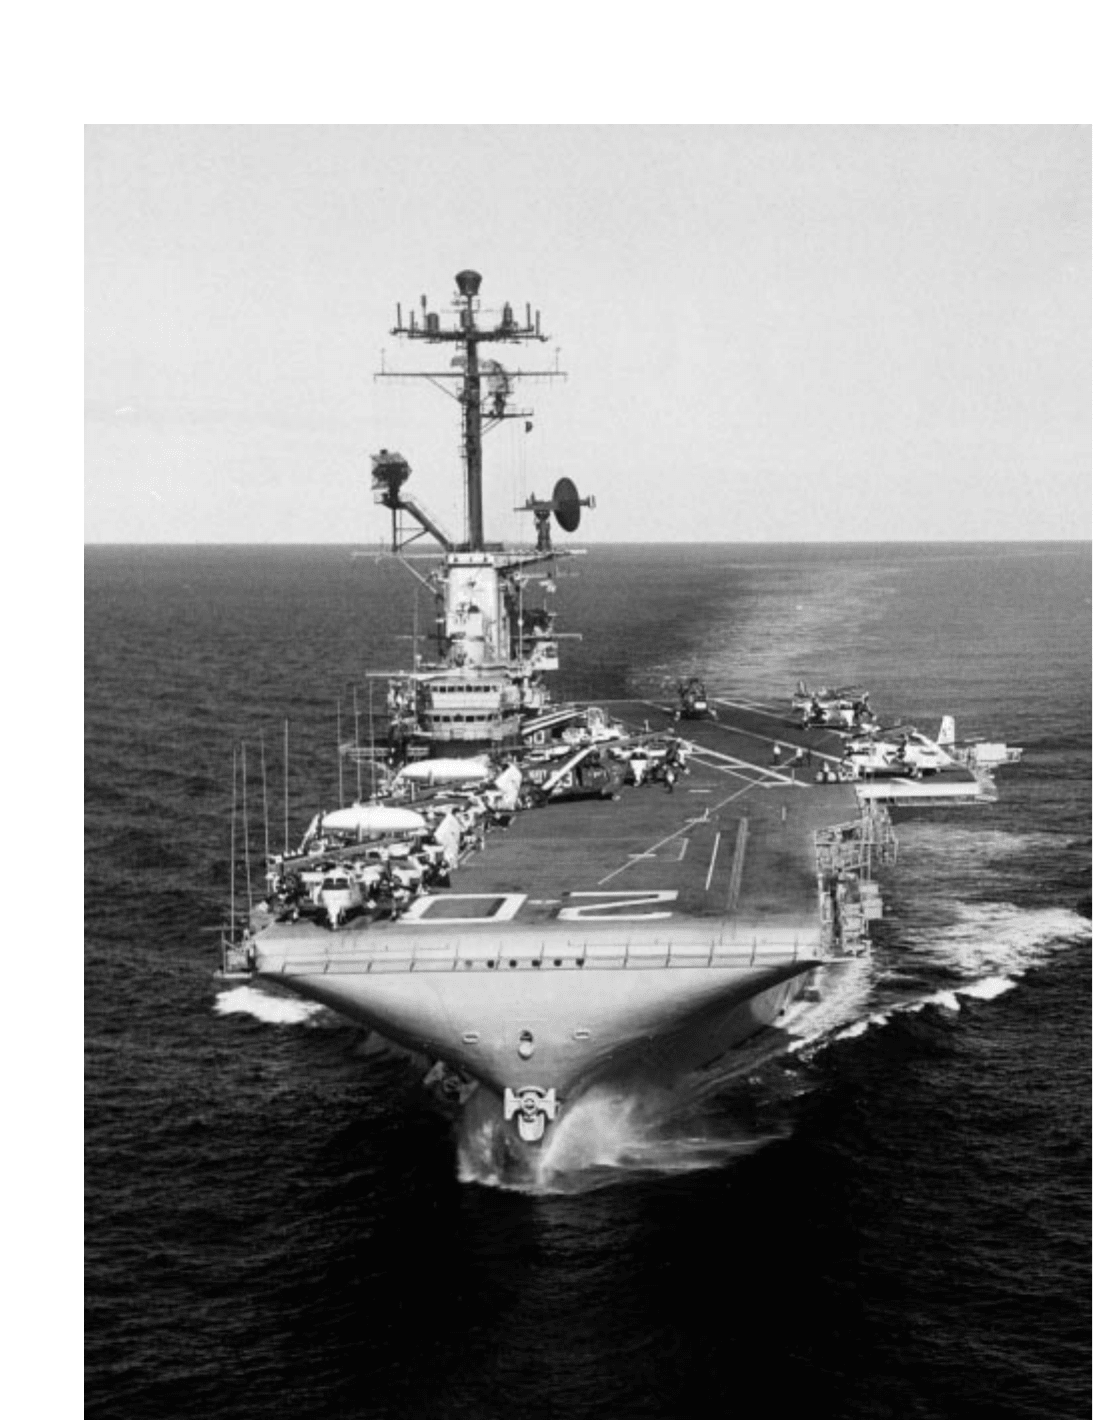
Bennington (CVS 20) underway in the 1960s with antisubmarine aircraft and helicopters on the flight deck.

Total HTA
1 July inventory Seaplanes
1
Flying boats Landplanes LTA Airships
1911 1
2
1
1912 3 3
1913 6 4 2
1914 12 6 6
1915 15 9 6
1916 17 14 3
6 Apr 1917 54 45 6 3 1
11 Nov 1918 2,107 695 1,170 242 15
1
Pontoon Type, referred to as hydroaeoplanes through 1916.
2
The Curtis Triad which made its first flight in the hands of a naval officer on 1 July; the plane was formally accepted on 9 August.
Navy and Marine Corps Combined
Including those assigned to the Air Reserve and In
Storage 1920–1965
HTA TYPES
1
LTA TYPES
3
HTA Transport and Obser- Miscel- Heli-
1 July Inventory Combat Utility
4
vation
5
Training laneous
6
copters
2
Rigids Blimps
1920 1,205 16
1921 1,134 16
1922 1,234 780 484 10
1924 700 530 170 1 1
1925 860 491 134 188 47 2 1
1926 888 600 282 6 1 1
1927 886 599 284 3 1 1
1928 851 605 217 29 1 2
1929 1,038 664 7 205 162 1 2
UNITED STATES NAVAL AVIATION 1910–1995 447
447
APPENDIX 4
Aircraft on Hand
1911–1918

Aircraft on Hand—Continued
1920-1965
HTA TYPES
1
LTA TYPES
3
HTA Transport and Obser- Miscel- Heli-
1 July Inventory Combat Utility
4
vation
5
Training laneous
6
copters
2
Rigids Blimp
1930 1,081 734 12 303 32 1 3
1931 1,204 776 14 300 114 1 3
1932 1,234 909 17 246 62 2 4
1933 1,375 863 38 176 303 2 3
1934 1,347 950 43 157 197 2 2
1935 1,456 1,041 67 170 178 1 2
1936 1,655 1,100 90 166 319 1 4
1937 1,637 972 113 161 393 1 4
1938 2,050 1,284 125 268 373 1 5
1939 2,098 1,316 150 262 370 1 8
1940 1,741 1,194 152 363 32 6
1941 3,437 1,774 183 1,444 31 7
1942 7,058 3,191 461 3,378 28 16
1943 16,691 8,696 878 7,021 96 78
1944 34,071 22,116 1,939 9,652 364 6 146
1945 40,912 29,125 2,897 8,370 520 27 139
1946 24,232 14,637 2,864 2,725 1,006 37 93
1947 17,602 11,181 1,288 413 3,941 779 27 66
1948 15,147 9,889 1,295 299 3,109 545 51 56
1949 14,056 9,372 1,272 144 3,118 150 103 59
1950 14,036 9,422 1,193 126 3,092 203 113 58
1951 13,473 8,713 775 101 3,527 357 163 58
1952 13,787 8,742 971 136 3,567 371 376 59
1953 14,666 8,818 1,250 194 3,700 704 661 50
1954 15,485 8,829 1,276 237 3,762 1,381 724 47
1955 16,440 8,884 1,299 217 3,679 2,361 676 61
1956 15,704 7,961 1,239 233 3,519 2,752 754 51
1957 13,904 7,591 1,287 164 3,341 1,521 821 54
1958 12,531 7,408 1,307 160 3,008 648 933 42
448 UNITED STATES NAVAL AVIATION 1910–1995

Aircraft on Hand—Continued
1920–1965
HTA TYPES
1
LTA TYPES
3
HTA Transport and Obser- Miscel- Heli-
1 July Inventory Combat Utility
4
vation
5
Training laneous
6
copters
2
Rigids Blimp
1959 12,030 7,030 1,355 150 3,027 468 977 37
1960 11,254 6,074 1,320 135 2,925 800 999 18
1961 11,635 6,305 1,285 129 2,769 1,147 1,032 14
1962 11,791 6,420 1,600 2,561 1,210 1,250 13
1963 11,164 6,265 1,639 2,290 970 1,274
1964 10,586 5,420 1,727 2,149 1,290 1,265
1965 10,101 5,127 1,681 20 2,305 968 1,285
1
As determined by model designation.
2
Total on hand; also counted in pertinent columns under HTA types.
3
Includes Los Angeles under Rigids while in non-flying status 1932-39,and the metal clad ZMC-2 under blimps, 1930-38.
4
Includes assault transport helicopters after 1961
5
Included under combat through 1946; thereafter VO and HO.
6
Has different meanings at different times,but generally includes experimental and obsolete aircraft,those awaiting disposition, on loan,and other categories officially
considered “nonprogram” aircraft.
Note:Data not available for fiscal year 1923.
Aircraft on Hand
1966–1995
Total Total
Aircraft Operating Transport/ Rotary
30 June Inventory† Inventory‡ Combat Utility Observation Training Miscellaneous Wing
1966 9,509 6,485 3,163 489 1,678 3,110 1,069
1967 9,399 6,591 3,160 543 14 1,679 2,884 1,119
1968 9,326 6,962 3,362 561 36 1,876 2,300 1,191
1969 9,192 6,984 2,964 614 111 2,180 2,110 1,213
1970 8,646 6,528 3,043 549 91 1,741 1,979 1,243
1971 7,974 6,059 2,793 353 80 1,465 2,007 1,276
1972 7,836 5,658 2,663 445 63 1,369 2,223 1,073
1973 7,444 5,590 2,697 416 78 1,286 1,909 1,058
1974 7,509 5,279 2,817 402 71 1,314 1,776 1,129
1975 7,526 4,915 2,747 377 52 1,204 2,012 1,134
1976 6,836 4,931 2,344 323 63 1,067 1,952 1,087
UNITED STATES NAVAL AVIATION 1910–1995 449

Aircraft on Hand—Continued
1966–1995
Total Total
Aircraft Operating Transport/ Rotary
30 Sep Inventory† Inventory‡ Combat Utility Observation Training Miscellaneous Wing
1977 6,593 4,698 2,346 268 61 879 1,943 1,096
1978 6,359 4,512 2,219 249 53 907 1,895 1,036
1979 6,390 4,463 2,207 213 55 916 1,975 1,024
1980 6,300 4,436 2,164 219 74 884 1,913 1,046
1981 6,225 4,474 2,156 221 79 908 1,803 1,058
1982 6,130 4,534 2,223 199 79 908 1,645 1,076
1983 6,178 4,469 2,418 219 78 1,004 1,230 1,229
1984 6,230 4,437 2,348 214 80 1,028 1,339 1,221
1985 5,396 4,462 2,067 183 73 845 1,004 1,224
1986 5,389 4,474 2,112 137 81 849 993 1,217
1987 5,433 4,421 2,093 131 77 816 1,106 1,210
1988** 5,424 4,174 1,945 188 68 740 1,253 1,230
1989 5,972 4,572 2,588 217 72 931 774 1,390
1990 5,895 4,766 2,550 212 57 915 722 1,439
1991 4,629 4,578 2,146 204 36 866 1,377
1992 4,684 4,403 2,235 211 43 797 1,398
1993 4,704 4,134 2,276 220 36 772 1,400
1994*
1995*
†Figures include aircraft in the pipeline, inactive aircraft,non-program aircraft, and aircraft in storage. Figures drawn from NAVSO P-3523 generated by the Office of the
Navy Comptroller, Financial & Statistical Reports Branch.
‡Total operating inventory accounts for only operational aircraft in the reporting and physical custody of the operating unit to which assigned. Figures drawn from the
Naval Aviation Summary reports (OPNAV Notice C3100).
*Figures not available.
**Date for 1988 is 30 June.
450 UNITED STATES NAVAL AVIATION 1910–1995