Heiman G. Basic Statistics for the Behavioral Sciences
Подождите немного. Документ загружается.


188 CHAPTER 9 / Using Probability to Make Decisions about Data
COMPUTING PROBABILITY
Computing the probability of an event is simple: We need only determine its relative
frequency in the population. When we know the relative frequency of all events, we
have a probability distribution. A probability distribution indicates the probability of
all events in a population.
Creating Probability Distributions
We have two ways to create a probability distribution. One way is to observe the rela-
tive frequency of the events, creating an empirical probability distribution. Typically,
we cannot observe the entire population, so we observe samples from the population.
We assume that the relative frequencies in the samples represent the relative frequen-
cies in the population.
For example, say that Dr. Fraud is sometimes very cranky, and apparently his cranki-
ness is random. We observe him on 18 days and he is cranky on 6 of them. Relative fre-
quency equals , so the relative frequency of Dr. Fraud’s crankiness is , or .33.
We expect him to continue to be cranky 33% of the time, so that he will be
cranky today. Conversely, he was not cranky on 12 of the 18 days, which is ,
or .67. Thus, that he will not be cranky today. Because his cranky days plus
his noncranky days constitute all possibilities here, we have the complete probability
distribution for his crankiness.
Statistical procedures usually rely on the other way to create a probability distribu-
tion. A theoretical probability distribution is a theoretical model of the relative frequen-
cies of events in a population, based on how we assume nature distributes the events.
From such a model, we determine the expected relative frequency of each event, which
is then the probability of each event.
For example, when tossing a coin, we assume that nature has no bias toward heads
or tails, so over the long run we expect the relative frequency of heads to be .50 and the
relative frequency of tails to be .50. Because relative frequency in the population is
probability, we have a theoretical probability distribution for coin tosses: The probabil-
ity of a head on any toss is , and the probability of a tail is
Or, consider a deck of 52 playing cards. The deck is actually the population, so each
card occurs once out of 52 draws. Therefore, the probability of you drawing any partic-
ular card from a full deck is Likewise, with 4 “Kings” in a full deck, the
probability of you selecting one is
Finally, if the numbers you select for your state’s lottery drawing have a 1 in 17 million
chance of winning, it’s because there are 17 million different possible combinations of
numbers to select from. We expect to draw all 17 million combinations equally often over
the long run. Therefore, we’ll draw your selection at a rate of once out of every 17 million
draws, so your chance of winning on today’s draw is 1 in 17 million.
And that is the logic of probability. First, we either theoretically or empirically
devise a model of the expected relative frequency of each event in the population. Then,
an event’s relative frequency equals its probability (our confidence) that it will occur in
a particular sample.
Factors Affecting the Probability of an Event
Not all random events are the same, and their characteristics influence their probability.
First, events may be either independent or dependent. Two events are independent
events when the probability of one is not influenced by the occurrence of the other.
4>52 5 .077.
1>52 5 .019.
p 5 .50.p 5 .50
p 5 .67
12>18
p 5 .33
6>18f>N
Obtaining Probability from the Standard Normal Curve 189
For example, contrary to popular belief, washing your car does not make it rain. These
are independent events, so the probability of rain does not change when you wash your
car. On the other hand, two events are dependent events when the probability of one is
influenced by the occurrence of the other. For example, whether you pass an exam usu-
ally depends on whether you study: The probability of passing increases or decreases
depending on whether studying occurs.
An event’s probability is also affected by the type of sampling we perform. When
sampling with replacement, any previously selected individuals or events are
replaced back into the population before drawing additional ones. For example, say
we will select two playing cards. Sampling with replacement occurs if, after drawing
the first card, we return it to the deck before drawing the second card. Notice that the
probabilities on each draw are based on 52 possible outcomes, and so they stay con-
stant. On the other hand, when sampling without replacement, previously selected
individuals or events are not replaced into the population before selecting again. Thus,
sampling without replacement occurs if, after a card is drawn, it is discarded. Now the
probability of selecting a particular card on the first draw is based on 52 possible out-
comes, but the probability of selecting a card on the second draw is different because
it is based on only 51 outcomes.
■
An event’s probability equals its relative frequency
in the population.
■
A probability distribution indicates all probabilities
for a population, and is influenced by whether the
events are independent or dependent and whether
sampling is with or without replacement.
MORE EXAMPLES
One hundred raffle tickets are sold each week.
Assuming that all tickets are equally likely to be
drawn, each should be selected at a rate of 1 out of
100 draws over the long run. Therefore, the probabil-
ity that you hold the winning ticket this week is
p 5 1>100 5 .01.
For Practice
1. The probability of any event equals its ____ in
the ____.
2. As the of an event decreases, the event’s relative
frequency in this situation ____.
3. As the of an event increases, our confidence that
the event will occur ____.
4. Tossing a coin (heads or tails) is sampling ____
replacement.
Answers
1. relative frequency; population.
2. decreases
3. increases
4. with
p
p
A QUICK REVIEW
OBTAINING PROBABILITY FROM THE STANDARD NORMAL CURVE
The reason we discuss probability is not because we have an uncontrollable urge to flip
coins and draw cards. In research, the random events that we are interested in are
scores. For our discussions, pretend that we’ve already measured everyone’s score in a
particular situation so that we can randomly select directly from the population of
scores. Further, we will assume that scores are independent (whether someone else
scores high on a test does not influence the that you’ll score high) and sampled with
replacement (the selection of a particular score does not remove it from the population).
Then our theoretical probability distribution is usually based on the standard normal
curve. Here’s how it works.
p
190 CHAPTER 9 / Using Probability to Make Decisions about Data
μ
f
.3413
.50
29
–3
59
0
69
+1
79
+2
89
+3
39
–2
49
–1
Raw scores
z-scores
.0228
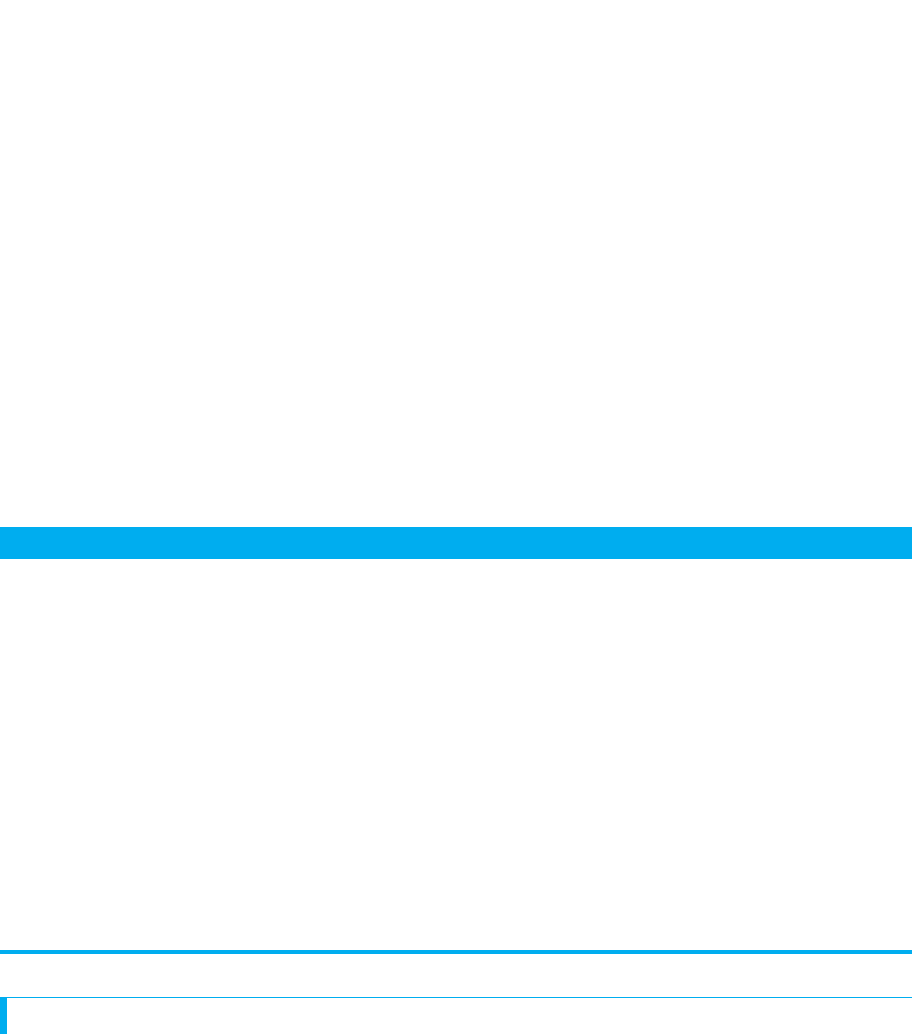
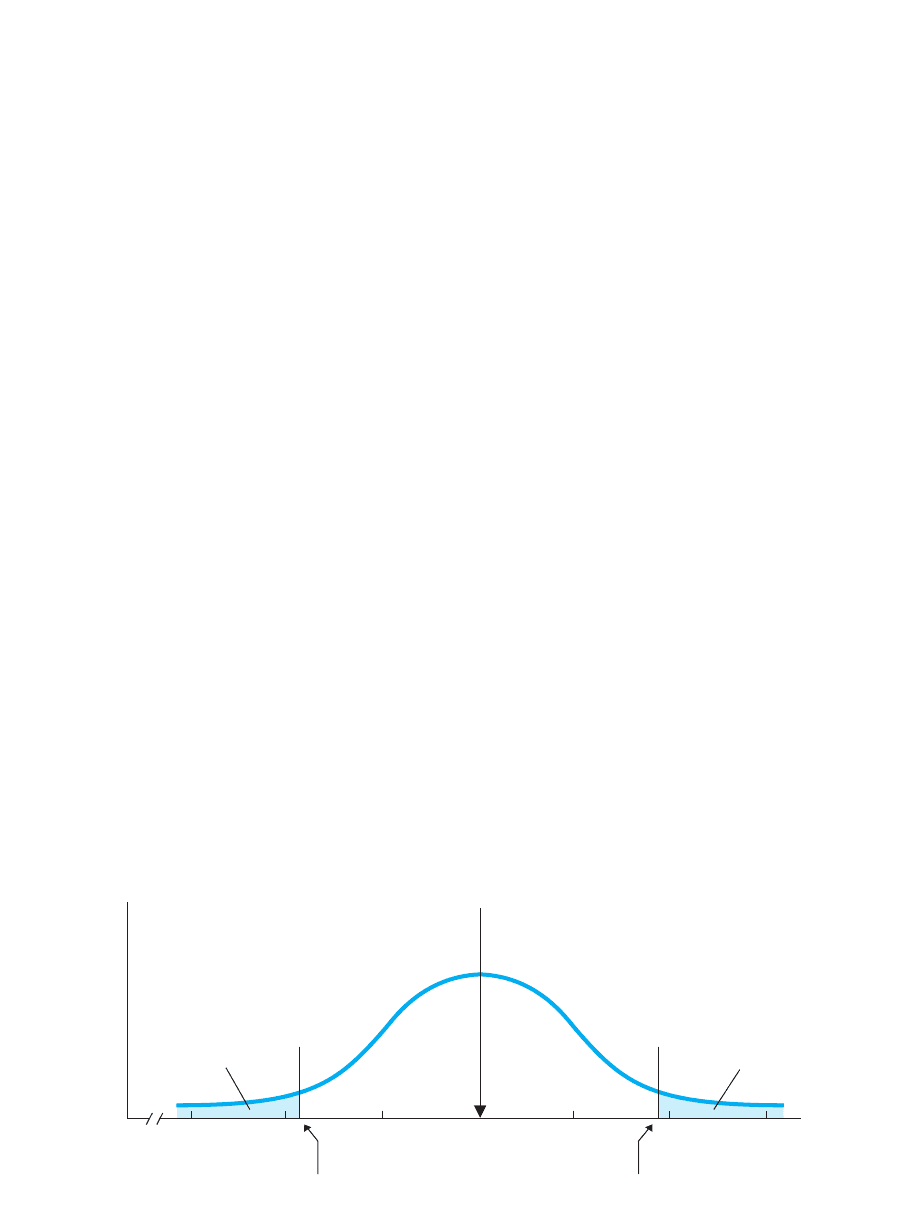
FIGURE 9.1
z-distribution showing
the area for scores below
the mean, between the
mean and , and
above z 512
z 511
Determining the Probability of Individual Scores
In Chapter 6, you used z-scores to find the proportion of the total area under the
normal curve in any part of a distribution. This proportion corresponds to the relative
frequency of the scores in that part of the population. Now, however, you know that
the relative frequency of scores in the population is their probability. Therefore, the
proportion of the total area under the curve for particular scores equals the probability
of those scores.
For example, Figure 9.1 shows the distribution for a set of scores. Say that we seek
the probability of randomly selecting a score below the mean of 59. To answer this,
think first in terms of z-scores. Raw scores below the mean produce negative z-scores,
so the question becomes “What is the probability of randomly selecting a negative
z-score?” Negative z-scores constitute 50% of the area under the curve and thus have a
relative frequency of .50. Therefore, the probability is .50 that we will select a negative
z-score. (Using our “parking lot” view of the curve, 50% of the parking lot holds
people with negative z-scores. If we put the names of everyone in the lot in a hat and
started selecting, we’d expect to draw someone with a negative z-score 50% of
the time: therefore, of getting one on a single draw.) Now think raw scores:
Because negative z-scores correspond to raw scores below 59, the probability is also .50
that we will select a raw score below 59.
Likewise, say that we seek the of selecting a score between 59 and 69. In Figure 9.1,
a raw score of 69 has a From column B of the z-tables in Appendix C, z-scores
between the mean and a of occur .3413 of the time. Thus, the probability is .3413
that we will select one of these z-scores, so the probability is also .3413 that we will
select a raw score between 59 and 69.
Or, say that we seek the probability of selecting a raw score above 79. Figure 9.1
shows that a raw score of 79 is at a z-score of From column C of the z-table, the rel-
ative frequency of scores beyond a is .0228. Therefore, the probability is .0228
that we will select a raw score above 79.
Finally, understand what we mean when a score is beyond a of plus or minus some
amount. For example, beyond z-scores of means that we seek scores in the tail
above or in the tail below We saw that beyond is .0228 of the curve
and so, beyond is also .0228. The word or indicates that we don’t distinguish
between the tails, so we add the two areas together. In total, , or .0456,
of the area under the curve contains the scores we seek. In Figure 9.1, a raw score of
39 is at , and 79 is at Thus, that we will select a raw score
below 39 or above 79.
Researchers seldom determine the probability of an individual score. However, by
understanding the preceding, you can understand a major part of inferential statistics,
which is to determine the probability of obtaining particular sample means.
p 5 .0456z 512.z 522
.0228 1 .0228
z 522
z 51222.12
;2
z
z of 12
12.
11z
z 511.
p
p 5 .5
Obtaining Probability from the Standard Normal Curve 191
μ
f
.3413
440
–3
500
0
520
+1
540
+2
560
+3
460
–2
480
–1
Sample means
z-scores
.0228
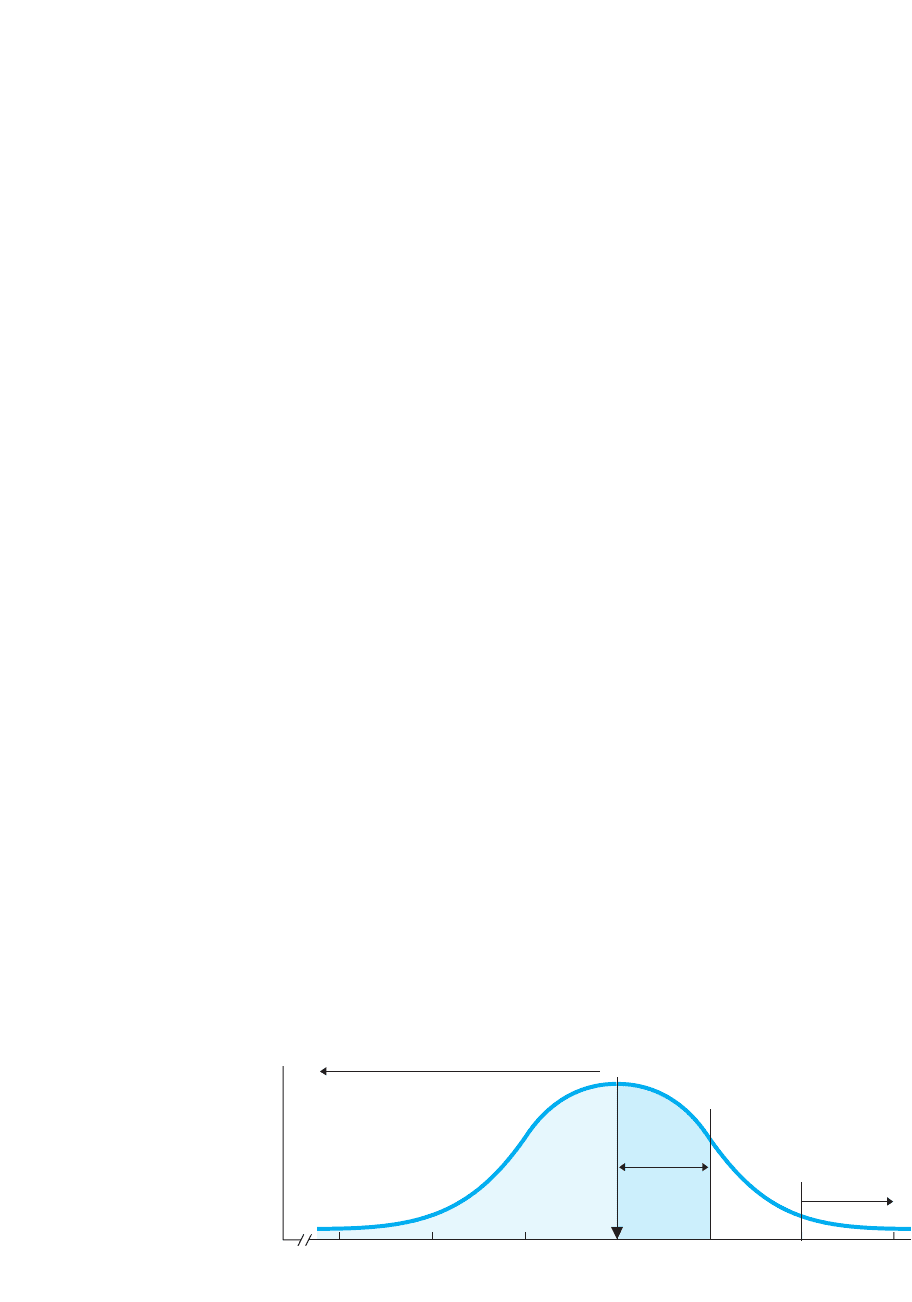
FIGURE 9.2
Sampling distribution of
SAT means when N 5 25
Determining the Probability of Sample Means
In Chapter 6, we conceptualized the sampling distribution of means as the frequency dis-
tribution of all possible sample means—the population—that would result if our bored
statistician randomly sampled a raw score population an infinite number of times using a
particular For example, Figure 9.2 shows the sampling distribution of means produced
from the population of SAT scores when Recognize that the different values
of occur here simply because of the luck of the draw of which scores are selected for a
sample. Because many raw scores are near 500, the bored statistician frequently selects
samples with means at 500. But sometimes a sample mean somewhat higher than 500
occurs because, by chance, she happened to select scores that are predominantly above
500. Sample means that are far above 500, however, occur less frequently because chance
seldom produces only scores very far above 500. Likewise, sometimes she obtains scores
that produce means somewhat below 500, while less frequently will luck produce means
far below 500. Thus, the sampling distribution provides a picture of how often different
sample means occur due to chance when sampling this underlying SAT raw score popula-
tion. Therefore, the sampling distribution is a theoretical probability distribution.
We use the sampling distribution to determine the probability of sample means in the
same way that we previously determined the probability of raw scores. First, as in
Chapter 6, we compute the mean’s z-score. To do this, recall that we first compute the
standard error of the mean using the formula
Then we compute a z-score for the sample mean using the formula
Then, by applying the standard normal curve model and z-table, we can determine the
probability of particular sample means.
For example, in Figure 9.2, our and , so the standard error of the
mean is 20. Say that we’re interested in the sample means between the of 500 and the
of 520. First, the mean’s z-score is Thus, in other words,
we’re interested in means having z-scores between 0 and The relative frequency of
such z-scores is .3413. Therefore, that we will randomly select a sample
mean with a z-score between 0 and Likewise, the probability is .3413 that we will
select a sample mean that is between 500 and 520.
Think about this: Randomly selecting a sample mean is the same as selecting a sample
of raw scores that produce that mean. Also, randomly selecting a sample of raw scores is
the same as selecting a sample of participants who then produce these scores. Therefore,
when we use the sampling distribution to determine the probability of selecting particular
11.
p 5 .3413
11.
1520 2 5002>20 511.X
σ
X
5 100N 5 25
z 5
X 2
σ
X
σ
X
5
σ
X
2N
X
5 500.
N.
192 CHAPTER 9 / Using Probability to Make Decisions about Data
sample means, we are actually finding the probability that we will select a sample of par-
ticipants whose scores will produce those means. Thus, we can rephrase our finding above:
When we randomly select 25 participants from the SAT population, the probability is
.3413 that we will select a sample that produces a mean between 500 and 520.
Likewise, we can find probabilities in other parts of the sampling distribution. For
example, back in Figure 9.2, a mean of 540 has , and we’ve seen that the rela-
tive frequency of scores beyond this is .0228. Therefore, that we will select
a sample of SAT scores that produce a mean above 540. Or, we might seek the proba-
bility of means below 460 or above 540. In Figure 9.2, these means translate into
z-scores of With .0228 of the area under the curve beyond each z, a total of .0456
of the curve is beyond Thus, the probability is only .0456 that we will select a sam-
ple that produces a mean below 460 or above 540.
REMEMBER Determine the probability of particular sample means by com-
puting their z-score on the sampling distribution.
As with individual raw scores, computing the exact probability of sample means will
not be a big part of what we do. Instead, you should understand the general logic of how
z-scores and a sampling distribution indicate the likelihood of various sample means. In
particular, as in Figure 9.2, see how a small z-score indicates that we are generally close
to the center of the sampling distribution, where samples having such means are rela-
tively frequent. Therefore, samples that produce means near are relatively likely to
occur. Conversely, the larger a z-score, the farther into the tail of the sampling distribu-
tion we are, so samples having these means are relatively infrequent. Samples that
produce means in the tails of the sampling distribution are unlikely to occur. Thus, for
example, an SAT mean of 560 has a z-score of We—or the bored statistician—are
extremely unlikely to randomly select a sample having such a mean because such
samples (and means) hardly ever occur, even over the long run.
REMEMBER The larger the z-score, the less likely the corresponding sample
mean is to occur.
13.
;2.
;2.
p 5 .0228z
z 512
■
To find the probability of particular sample means,
we envision the sampling distribution, compute the
z-score, and apply the z-tables.
■
The farther into the tail of the sampling distribution
that a sample mean falls, the less likely it is to
occur.
MORE EXAMPLES
In a population, and What is the proba-
bility of obtaining a sample with a mean
above ? To compute the z-score, first compute
the standard error of the mean:
Then
The means above 38.3 are in the upper tail
of the distribution, so from column C of the z-table, sam-
ple means above 38.3 have a p 5 .0495.
511.65.
z 5 1X
2 2>σ
X
5 138.3 2 352>28>116 5 2.
σ
X
5 σ
X˛˛˛˛˛
>1N 5
X 5 38.3
1N 5 162
σ
X
5 8. 5 35
For Practice
1. With , , and , what is the
probability of selecting a above 530?
2. Approximately, what is the probability of selecting
an SAT sample mean having a z-score between ?
3. If , are we more likely to obtain a sample
mean that is close to 100 or a mean that is very
different from 100?
4. The farther that sample means are into the tail of
the sampling distribution, the lower/higher their
probability.
Answers
1. ;
2. With about 68% of the distribution,
3. A mean close to 100 is more likely.
4. lower
p 5 .68.
p 5 .0668
z 5 1530 2 5002>20 511.5;σ
X
5 100>125 5 20
5 100
;1
X
N 5 25σ
X
5 100 5 500
A QUICK REVIEW

Random Sampling and Sampling Error 193
RANDOM SAMPLING AND SAMPLING ERROR
Computing the probability of sample means as we’ve described forms the basis for
all inferential statistics. Why do we need such procedures? Recall that in research
we want to conclude that the way our sample behaves is also the way the entire pop-
ulation would behave. However, we need inferential statistics because there is no
guarantee that the sample accurately reflects the population. In other words, we are
never certain that a sample is representative. In a representative sample, the char-
acteristics of the individuals and scores in the sample accurately reflect the charac-
teristics of individuals and scores found in the population. Thus, if 55% of the
population is female, then a sample will be representative if it is also 55% female. If
20% of the population scored 475, then a sample is representative if 20% of the
sample’s scores are 475. And so on, so that the proportions of the sample made up
by the various individuals and their scores equal the proportions found in the popu-
lation. Thus, to put it simply, a representative sample is a miniature version of the
population. This is why, if the in the SAT population is 500, then the in a repre-
sentative sample will be 500.
To produce representative samples, researchers select participants using random
sampling. A random sample should be representative because, by being unselective in
choosing participants, we allow the characteristics of the population to occur naturally
in the sample, in the same ways that they occur in the population. Thus, if 55% of the
population is female, then 55% of a random sample should be female because that is
how often we will encounter females. In the same way, random sampling should pro-
duce a sample having all of the characteristics of the population.
At least we hope it works that way! A random sample “should” be representative, but
nothing forces this to occur. The problem is that, just by the luck of the draw, we can
obtain a sample whose characteristics do not match those of the population. However,
representativeness is not all or nothing. Depending on the individuals and scores
selected, a sample can be somewhat representative, only somewhat matching the popu-
lation. For example, 20% of the population may score at 475, but simply through the
luck of who is selected, this score might occur 10% or 30% of the time in our sample.
If so, the sample will have characteristics that are only somewhat similar to those of the
population, and although may be 500, the sample mean will not be 500. In the same
way, depending on the scores we happen to select, any sample may not be perfectly
representative of the population from which it is selected, so the sample mean will not
equal the population mean it is representing.
The statistical term for communicating that chance produced an unrepresentative
sample is to say that the sample reflects sampling error. Sampling error occurs when
random chance produces a sample statistic (such as ) that is not equal to the popula-
tion parameter it represents (such as ). Sampling error conveys that the reason a sam-
ple mean is different from is because, by chance, the sample is unrepresentative of
the population. That is, because of the luck of the draw, the sample contains too many
high scores or too many low scores relative to the population, so the sample is in error
in representing the population.
REMEMBER Sampling error results when, by chance, the scores that are
selected produce a sample statistic that is different from the population
parameter it represents.
Here then, is the central problem for researchers and the reason for inferential
statistics: When sampling error produces a sample that is different from the
X
X

194 CHAPTER 9 / Using Probability to Make Decisions about Data
population that it comes from and represents, it has the characteristics of some
other population. The problem is that then the sample appears to come from and
represent that other population. Thus, although a sample always represents some
population, we are never sure which population it represents: Through sampling
error the sample may poorly represent one population although it doesn’t look like
it represents that one, or the sample may accurately represent some other popula-
tion altogether.
REMEMBER Any sample may poorly represent one population, or it may
accurately represent a different population.
For example, say that we return to the SAT scores of Prunepit University and find
that a random sample obtains a mean score of 550. This is surprising because the
ordinary, national population of SAT scores has a of 500. Therefore, we should
have obtained a sample mean of 500 if our sample was perfectly representative of
this population. How do we explain a sample mean of 550? On the one hand, maybe
we simply have sampling error. Maybe because of the luck of the draw, we selected
too many students with high scores and not enough with low scores so that the sam-
ple mean came out to be 550 instead of 500. Thus, it’s possible that chance produced
a less than perfectly representative sample, but the population being represented is
still that ordinary population where is 500. On the other hand, perhaps the sample
does not come from and represent the ordinary population of SAT scores. After
all, these are Prunepit students, so they may belong to a very different population
of students, having some other For example, maybe Prunepit students belong
to the population where is 550, and their sample is perfectly representing this
population.
The solution to this dilemma is to use inferential statistics to make a decision about
the population being represented by our sample. The next chapter puts all of this into a
research context, but in the following sections we’ll examine the basics of deciding
whether a sample represents a particular population.
DECIDING WHETHER A SAMPLE REPRESENTS A POPULATION
We deal with the possibility of sampling error in this way: Because we rely on random
sampling, how representative a sample is depends on random chance—the luck of the
draw of which individuals and scores are selected. Therefore, we can determine
whether our sample is likely to come from and thus represent a particular population.
If chance is likely to produce our sample from the population, then we decide that
our sample does come from and represent that population, although maybe with a
little sampling error. However, if chance is unlikely to produce our sample from the
population, then we decide that the sample does not represent that population, and
instead represents some other population.
Here’s a non-math example. You obtain a paragraph of someone’s typing, but you
don’t know whose. Is it mine? Does it represent the population of my typing? Say there
are zero typos in the paragraph. It’s possible that some quirk of chance produced such
an unrepresentative sample, but it’s not likely: I type errorless words only 20% of the
time, so the probability of an errorless paragraph is extremely small. Thus, because
chance is unlikely to produce such a sample from the population of my typing, you
should conclude that the sample represents the population of a competent typist where
such a sample is more likely.
.
Deciding Whether a Sample Represents a Population 195
X X X X X X X X X X X X X X X X X
f
μ
= 500
Less than 500 Greater than 500
BA
Sample means
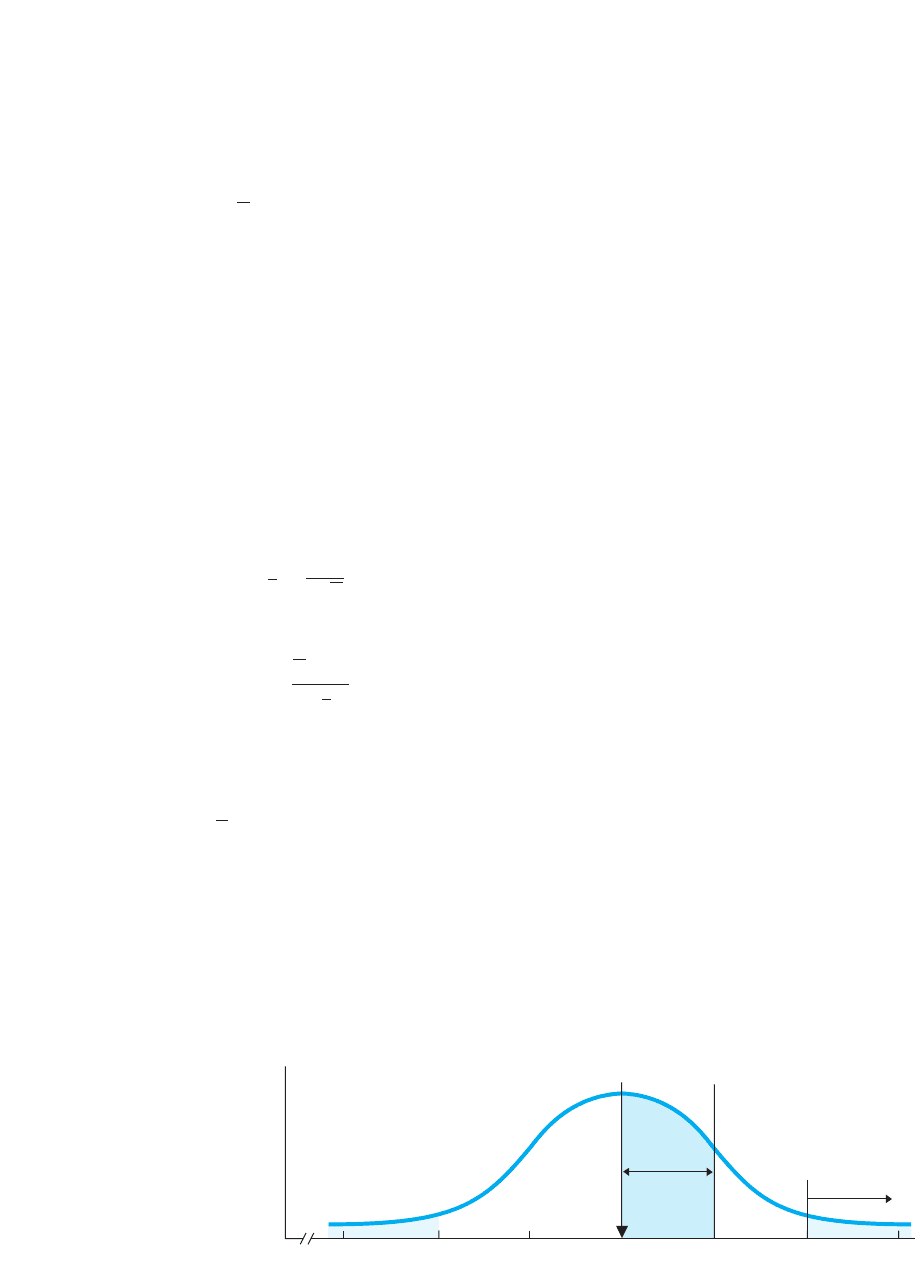
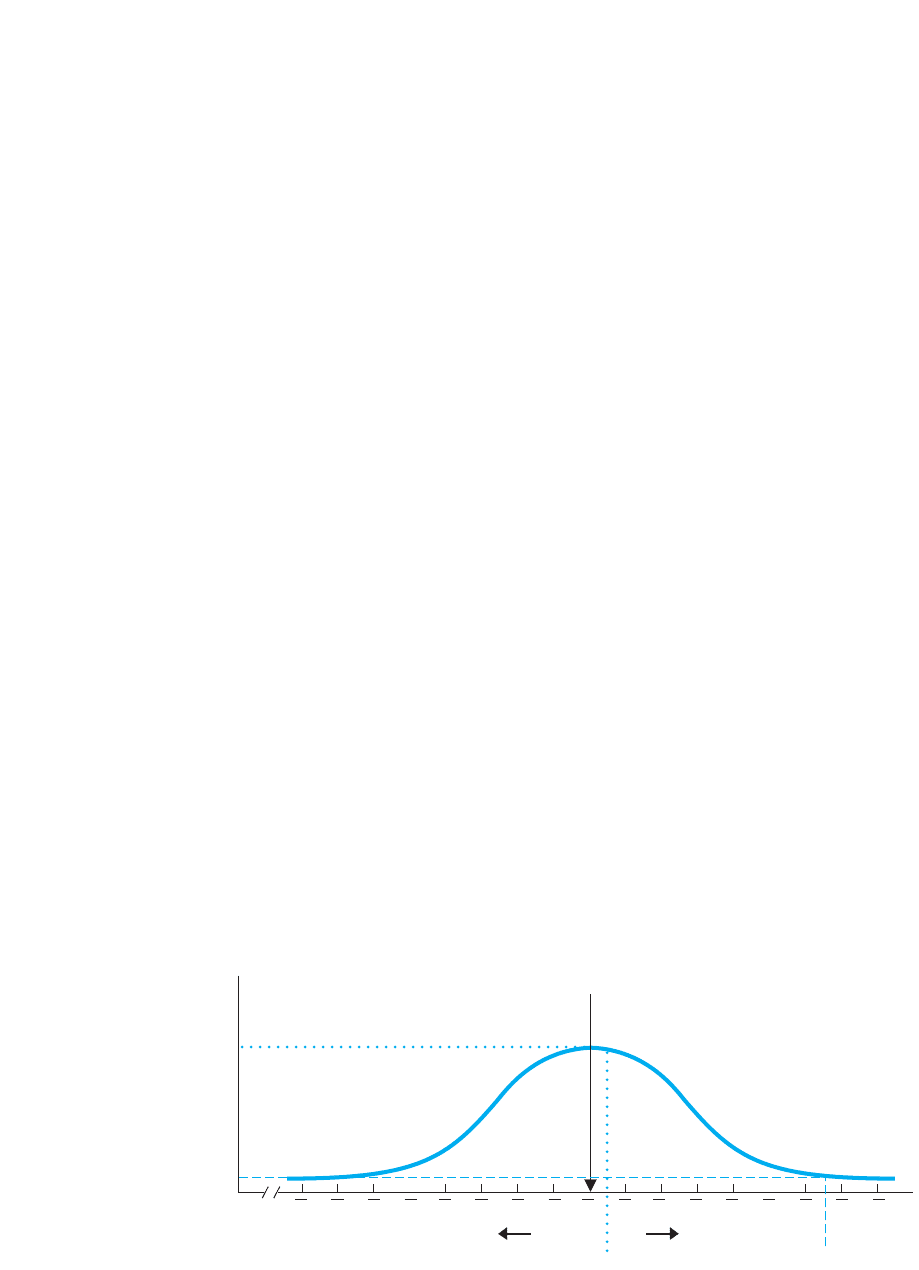
FIGURE 9.3
Sampling distribution of
SAT means showing two
possible locations of our
sample mean
On the other hand, say that there are typos in 75% of the words in the paragraph.
This is consistent with what you would expect if the sample represents my typing, but
we have a little sampling error. Although you expect 80% typos from me over the long
run, you would not expect precisely 80% typos in every sample. Rather, a sample with
75% errors seems likely to occur simply by chance when the population of my typing
is sampled. Therefore, you can accept that this paragraph represents my typing, albeit
somewhat poorly.
We will use the same logic to decide whether our Prunepit sample represents the
population of SAT scores where is 500: we will determine the probability of
obtaining a sample mean of 550 from this population. As you’ve seen, we determine
the probability of a sample mean by computing its z-score on the sampling distribu-
tion of means. Thus, we first envision the sampling distribution showing the differ-
ent means that the bored statistician would obtain if, using our , she randomly
sampled the ordinary SAT population an infinite number of times. This is shown in
Figure 9.3.
Notice, the statistician is definitely representing the SAT population where is 500,
so whether she obtained a particular mean that was high, low, or in-between depends
purely on the luck of the draw of which scores she happened to select. Therefore, think
of a sampling distribution as a “picture of chance,” showing how often chance produces
different sample means when we sample a particular raw score population. Essentially,
it shows how often different degrees of sampling error occur.
The next step is to calculate the z-score for our sample mean of 550 so that we can
determine its likelihood. In reality we would not always expect a perfectly represen-
tative sample, so we would not expect a sample mean of precisely 500 every time.
Instead, if our sample is representing this population, then the sample mean should
be close to 500. For example, say that the z-score for our mean is at location A in
Figure 9.3. Read what the frequency distribution indicates by following the dotted
line: This mean has a very high relative frequency and thus is very likely when we are
drawing a sample from the ordinary SAT population. By being “close” to , this tells
us that samples are often unrepresentative to this extent, and so the bored statistician
frequently encountered this mean when she was representing the SAT population.
Thus, this is a mean that we’d expect to see if we are representing this population. In
fact, to put it simply, we obtained an expected mean that happens often with this pop-
ulation. Therefore, we will conclude it is a good bet that our sample comes from and
represents the ordinary SAT population, even though it doesn’t look like it represents
N
196 CHAPTER 9 / Using Probability to Make Decisions about Data
that population. We assume the discrepancy is due to sampling error where, by
chance, we obtained a few too many high scores so our turned out to equal 550
instead of 500.
However, say that, instead, our sample has a z-score at location B back in Figure 9.3.
Following the dashed line shows that this is a very infrequent and unlikely mean. By
being “far” from , this tells us that samples are seldom unrepresentative to this
extent, and so the bored statistician almost never encountered such an extreme case
of sampling error when she was representing this SAT population. Thus, this is a
mean we would not expect to see if we are representing this population. To put it
simply, we obtained an unexpected mean that almost never happens with this
population! Therefore, because it is a bad bet that our sample comes from and rep-
resents the ordinary SAT population, we will reject that we are representing this
population, rejecting that the discrepancy between our and 500 reflects sampling
error. Instead, it makes more sense to conclude that the sample represents and comes
from some other raw score population (having some other ), where this sample is
more likely.
Be sure you understand the above logic before proceeding, because it is used in
all inferential procedures. We will always have a known, underlying raw score
population that a sample may or may not represent. From that raw score population
we envision the sampling distribution of means that would be produced. Then we
determine the location of our sample mean on the sampling distribution. The
farther into the tail of the sampling distribution the sample mean is, the less likely
that the sample comes from and represents the original underlying raw score
population.
X
X
■
If the z-score shows that a sample mean is unlikely
in the sampling distribution, reject that the sample
is merely poorly representing the underlying raw
score population.
■
If the z-score shows that a sample mean is likely in
the sampling distribution, conclude that the sample
represents the underlying raw score population,
albeit somewhat poorly.
MORE EXAMPLES
On the sampling distribution created from body
weights in the United States, an produces !
Such a mean is so unlikely when representing this
population that we reject that our sample represents
this population. However, another produced
Such a mean is close to and thus very
likely, so this sample is likely to represent this
population.
z 52.02.
X
z 515X
For Practice
1. ____ communicates that a sample mean is differ-
ent from the it represents.
2. Sampling error occurs because of ____.
3. A sample mean has on the sampling
distribution created from the population of
psychology majors. Is this likely to be a sample
of psychology majors?
4. A sample mean has on the above
sampling distribution. Is this likely to be a sample
of psychology majors?
Answers
1. Sampling error
2. Random chance
3. Yes
4. No
z 524.0
z 511
A QUICK REVIEW
Deciding Whether a Sample Represents a Population 197
f
μ
440
–3
460
–2
480
–1
500
0
520
+1
540
+2
560
+3
Region of rejection
equals 2.5%
Region of rejection
equals 2.5%
–1.96
Critical value
+1.96
Critical value
Sample means
z-scores
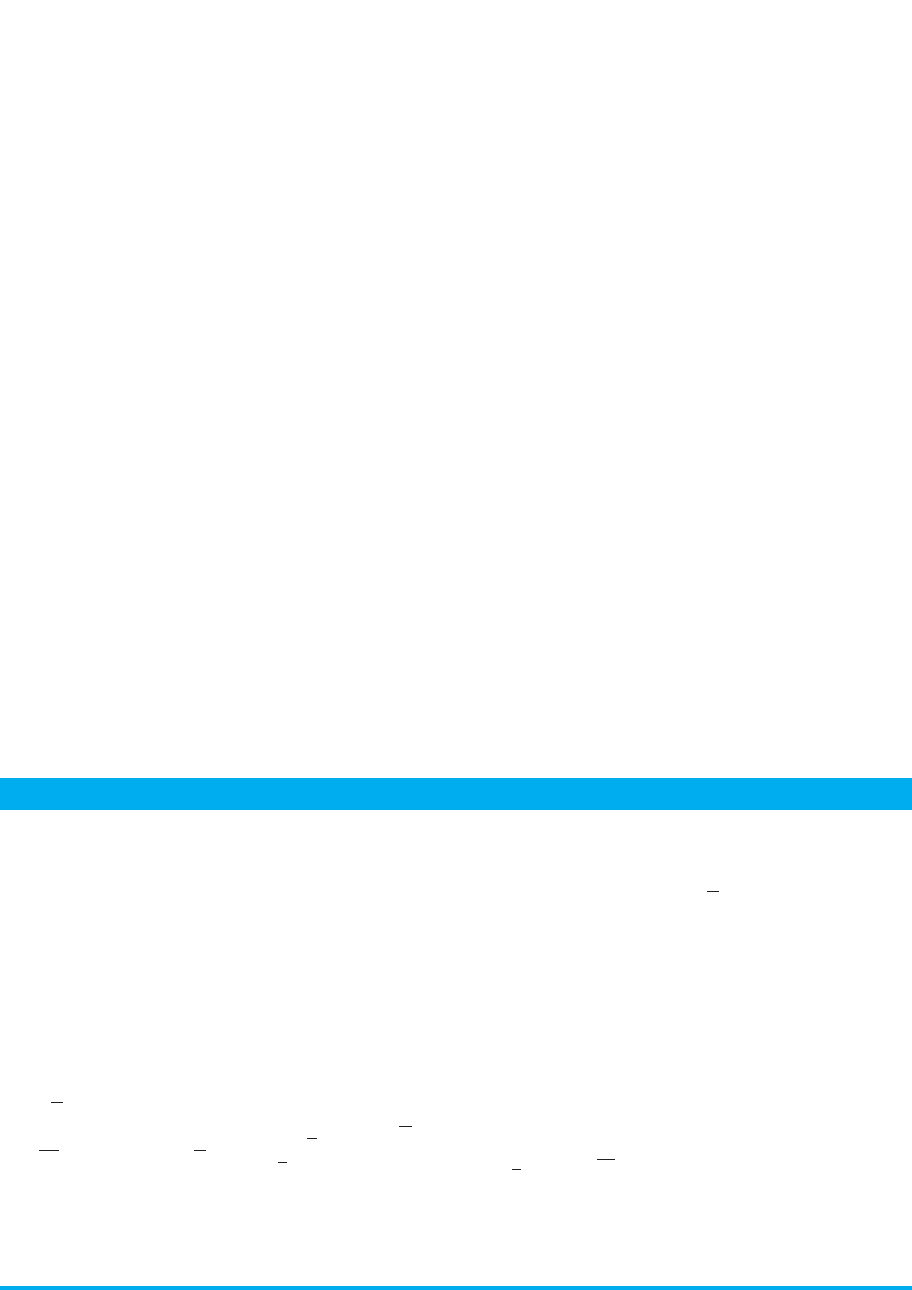
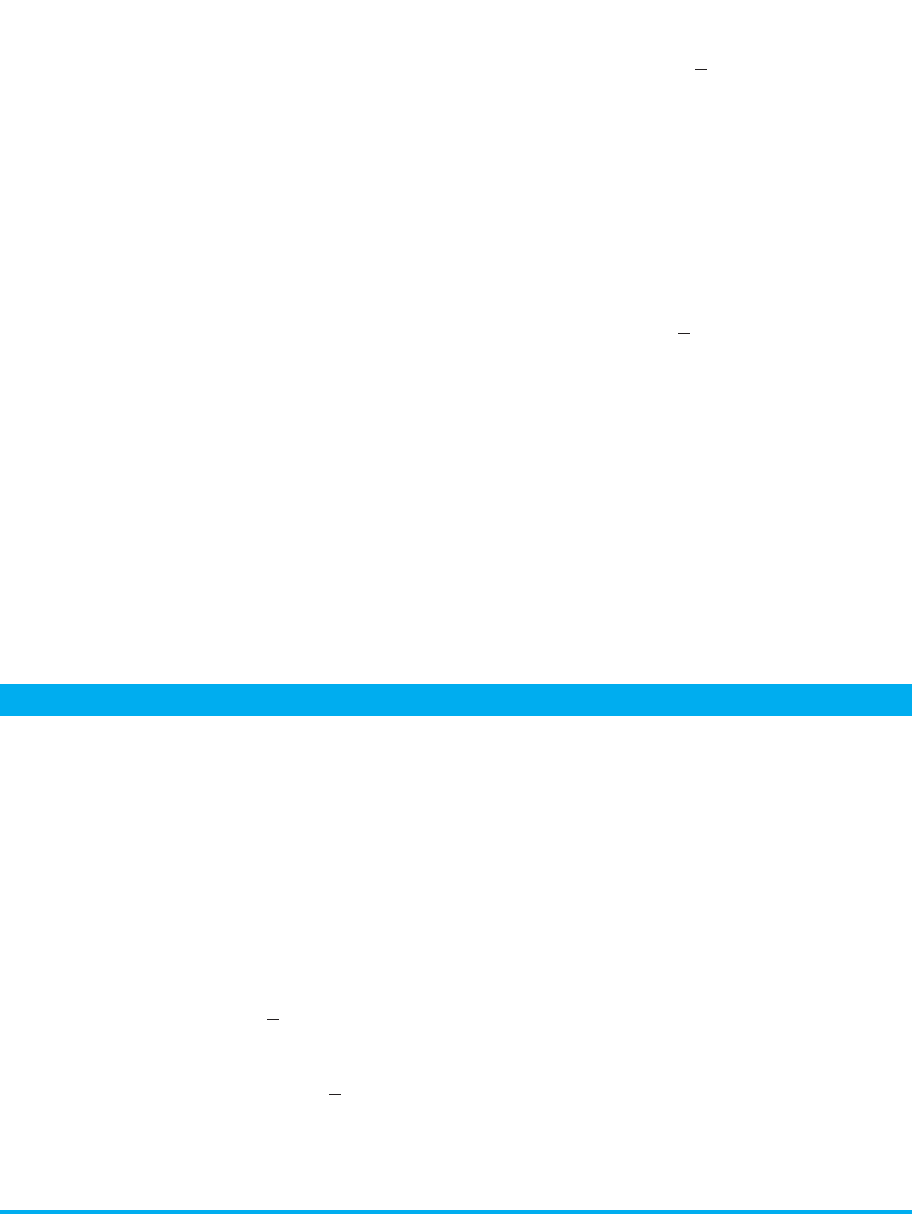
FIGURE 9.4
Setup of sampling distribution of SAT means showing the region of rejection and critical values
Setting Up the Sampling Distribution
To decide if our Prunepit sample represents the ordinary SAT population (with 500),
we must perform two tasks: (1) Determine the probability of obtaining our sample from
the ordinary SAT population and (2) decide whether the sample is unlikely to be repre-
senting this population. We perform both tasks simultaneously by setting up the sampling
distribution.
In Figure 9.4, we have the sampling distribution of means from the ordinary SAT pop-
ulation. (The axis is labeled twice, showing the sample means and their corresponding
-scores.) The first step in setting up the sampling distribution is to create the shaded
areas in the tails of the distribution. We saw in the previous section that, at some point,
an SAT sample mean could be so far above 500 in the upper tail of the sampling distri-
bution that we could not believe that it represents the underlying raw score population.
Recognize that any sample mean lying beyond that point, farther into the tail, would also
be unbelievable. Therefore, we will draw a line in the upper tail of the sampling distri-
bution creating the shaded area that encompasses all of these means. Likewise, an SAT
sample mean could be so far below 500 in the lower tail of the sampling distribution that
we would also not believe that it represents the underlying population. And, any sam-
ples beyond that point, farther into the tail, would also be unbelievable. We draw a line
in the lower tail of the distribution to create the shaded area that encompasses these
means. In statistical terms, the shaded areas are each called the region of rejection. As
shown, very infrequently are samples so poor at representing the SAT population that
they have means lying in the region of rejection. In fact,
Samples with means in the region of rejection are so unrepresentative of the
underlying raw score population that it’s a better bet they represent some
other population.
Thus, the region of rejection contains means that are so unlikely to be representing
the underlying population, that if ours is one of them, we reject that it represents that
population. Essentially, we “shouldn’t” get an SAT sample mean that lies in the
region of rejection if we’re representing the ordinary SAT population because such
z
X
5