Heiman G. Basic Statistics for the Behavioral Sciences
Подождите немного. Документ загружается.

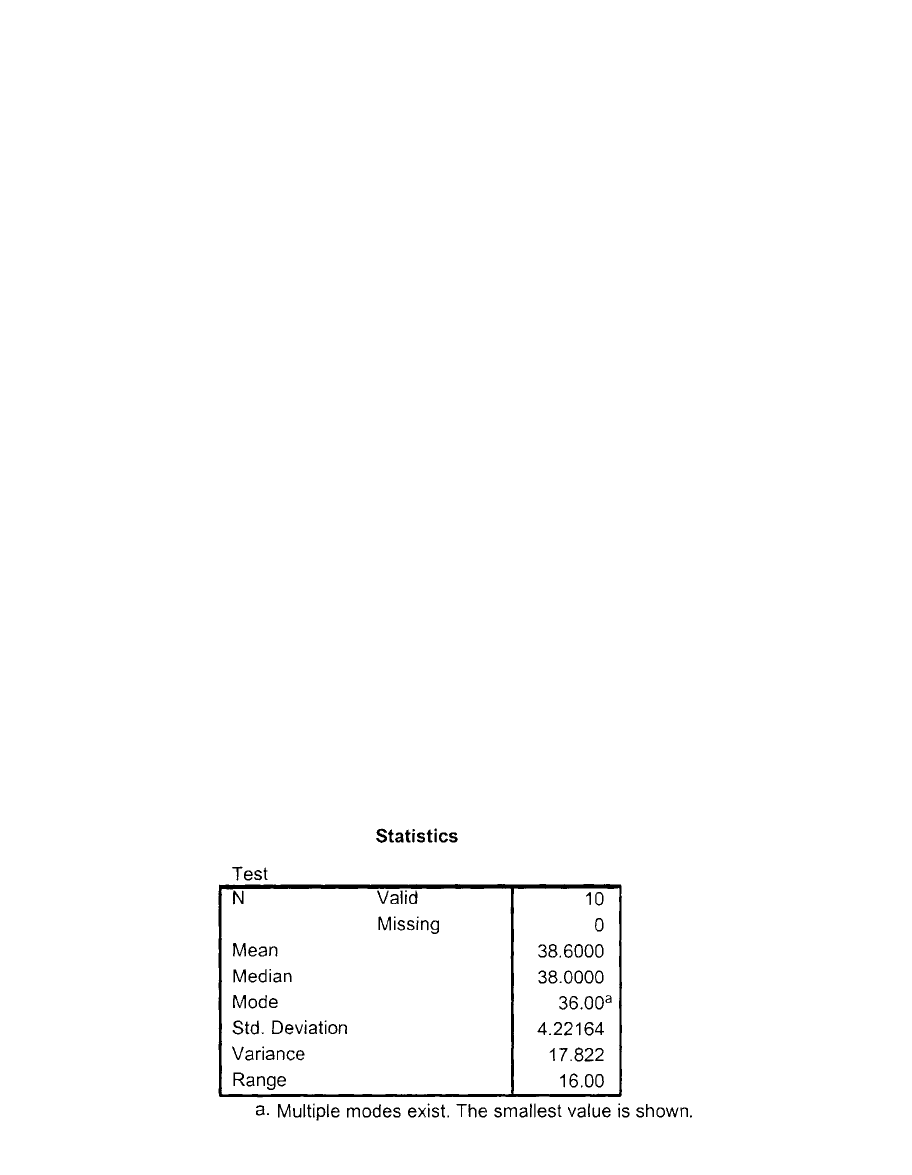
compute the mean, median, and/or mode, as well as the standard deviation, variance,
and/or range. For example, say we have these ten test scores:
40 33 36 38 49 39 40 38 36 37
Enter the data: Name the variable and enter the scores into the Data Editor as usual.
Select a frequency table: Repeat the previous steps for a frequency table: On the
Menu Bar, select Analyze, Descriptive Statistics, and Frequencies. Then move each
variable to “Variables(s).”
Select statistics: Click Statistics. The “Frequencies: Statistics” box appears. Under
Central Tendency, click to place a checkmark at each measure that you seek. Disper-
sion means variability, so check these measures that you seek.
Note: The standard (std.) deviation and variance given here are the estimated popu-
lation versions, what we called and , in which the final division involves .
Also, the “S.E. mean” is the standard error of the mean introduced in Chapter 6.
The output: Click Continue and click OK. You’ll see Screen B.6.
Transforming a Sample to z-Scores
Enter the data: Enter the data as above. (Let’s use the previous scores.)
Select Descriptives: On the Menu Bar click Analyze, Descriptive Statistics, and
Descriptives. The “Descriptives” box appears.
Select the variable(s): Move each variable to “Variable(s).”
Select z-scores: Check Save standardized values as variables.
The output: Click OK. The output includes the mean and standard deviation of the
raw scores. But back in your Data Editor, a new variable (a new column) will appear
containing the z-score for each raw score.
For Practice
Using the data in questions 14 and 15 in Chapter 5, determine the mean, median, mode,
estimated standard deviation and variance, and range.
N 2 1s
2
X
s
X
398 APPENDIX B / Using SPSS
SCREEN B.6
Output for Central
Tendency and Variability
Answer
B.4 Correlation Coefficients and the Linear Regression Equation 399
USING SPSS
B.4 CORRELATION COEFFICIENTS AND THE LINEAR REGRESSION EQUATION
This section describes how to compute the Pearson and the Spearman (as in
Chapter 7) and the linear regression equation (as in Chapter 8).
Computing the Pearson Correlation Coefficient
SPSS computes , as well as the mean and estimated standard deviation of the and
. (You may have more than two variables and correlate all pairs of variables.) As an
example, say that we wonder if a person’s extroversion level is correlated with his or
her aggression level. We obtain these scores:
Participant Extroversion Aggression
11423
21210
31011
41318
51920
62018
7910
849
Enter the data: Name the two variables and enter the scores in the two columns.
(Save the file for use later with regression.)
Select the correlation: On the Menu Bar, select Analyze, Correlate, and Bivariate.
The “Bivariate Correlations” box appears. Be sure Pearson is checked. (Anything refer-
ring to “significant” will make sense after you’ve read Chapter 11.)
Select the variable(s): Move the two variables you want to correlate to “Variables.”
Select Descriptives: Click Options and then check Means and standard deviations.
Click Continue.
The output: Click OK. In the “Descriptive Statistics” table are the and for
each variable. In the “Correlations” table is the “correlation matrix,” shown in
Screen B.7.
s
X
X
Ys
Xsr
r
S
r
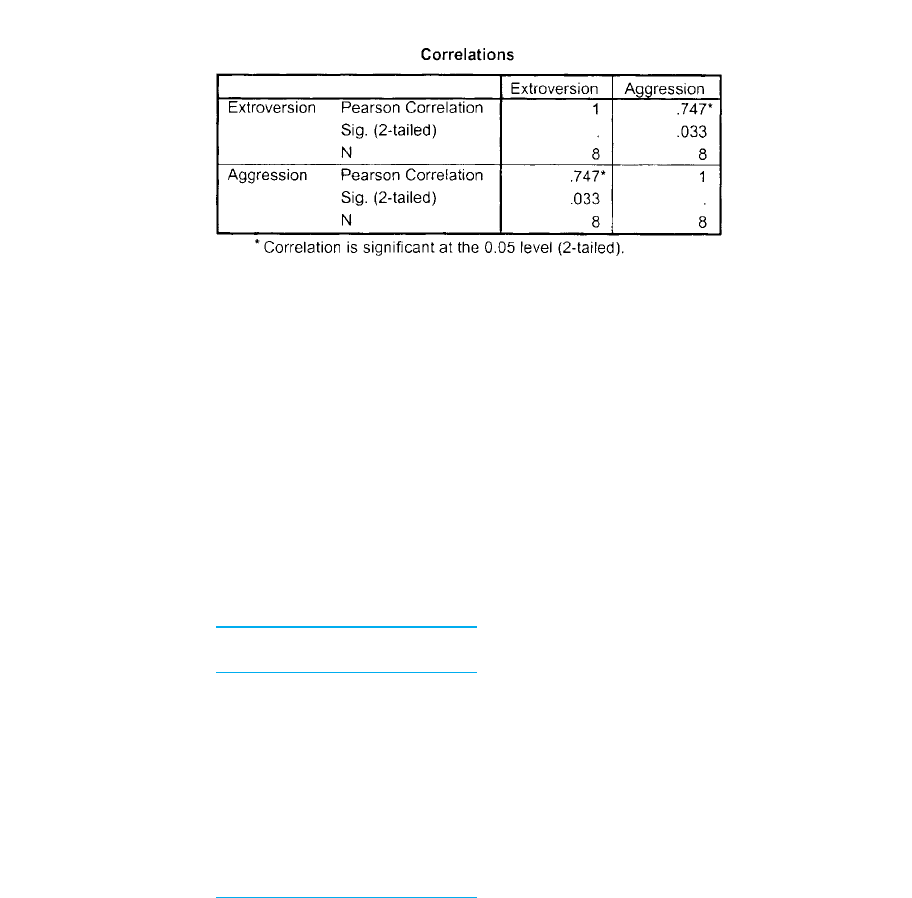
The matrix contains the correlation coefficients produced when the variable in every
row is correlated with the variable in every column. Thus, in the first row, the (mean-
ingless) between extroversion scores and extroversion scores is . However, the
that we seek between extroversion and aggression is . (If it were negative, a
minus sign would appear.) If we had a third variable, we’d also see the between it
and extroversion and between it and aggression.
Computing the Spearman Correlation Coefficient
Say that we rank-ordered ten participants in terms of their attractiveness and their
apparent honesty and we wish to correlate these ranks.
Participant Attractive Honest
187
268
354
476
533
612
7109
822
941
10 9 5
Enter the data: Enter the scores as we did for . SPSS automatically resolves tied
ranks as discussed in Chapter 15. Also, you may enter interval or ratio scores, and
SPSS will transform them to ranks.
Select the correlation: On the Menu Bar, select Analyze, Correlate, and Bivariate.
The “Bivariate Correlations” box appears.
Select the variable(s): Move the variables you want to correlate to “Variables.”
Select Spearman: Check Spearman; uncheck Pearson.
The output: Click OK. A correlation matrix again appears. Notice that is called
“rho” here. Our between attractiveness and honesty is .1.815r
S
r
S
r
r
obt
1.747r
obt
11r
obt
400 APPENDIX B / Using SPSS
SCREEN B.7
Output for the Pearson r

Computing the Linear Regression Equation
SPSS computes the components of the linear regression equation. For example, in the
Pearson above, we correlated extroversion and aggression. To perform linear regres-
sion on these data, retrieve the file (or re-enter the scores).
Identify X and Y: First decide which variable is the predictor variable (your ) and
which is the criterion variable (your ). Say that we want to use extroversion scores to
predict aggression scores.
Select Regression: On the Menu Bar, select Analyze, Regression, and Linear. The
“Linear Regression” box appears.
Select the variable(s): Move your predictor or variable (here “Extroversion”)
under “Independent(s).” Move your criterion or variable (here “Aggression”) under
“Dependent(s).”
Select Descriptives: Click Statistics and, in the box check Descriptives to compute
the and for each variable and the between them. Click Continue.
The output: Click OK. Considerable information is provided, but the basic material
is shown in Screen B.8.
In the “Model Summary” table is (called R), (called R Square), and the
standard error of the estimate. (This is computed differently than our , because ours
describes the standard error for our sample, but in SPSS it is an estimate of the stan-
dard error that would be found in the population. You’ll get the same answer if, in
our defining formula for you divide by instead of .) The components of the
regression equation are in the “Coefficients” table. Locate the column under B. In the
row at “Constant” is the intercept (our a). Here, a is 5.030. In the row at our predictor
variable’s name (here, “Extroversion”) is the slope (our b). Here, b is . Thus, the
linear equation here is
For Practice
1. Compute the Pearson in Application Question 19 in Chapter 7. Compare your
output to the answers in Appendix D.
2. As in Application Question 21 in Chapter 8, compute the linear regression equa-
tion when using Burnout to predict Absences. Compare your output to the
answers in Appendix D.
3. Compute the Spearman Application Question 21 in Chapter 7. Compare your
output to the answers in Appendix D.
r
S
r
Y
¿
5 .780X 1 5.030.
.780
Y
NN 2 2S
Y
¿
S
Y
¿
r
2
r
obt
rs
X
X
Y
X
Y
X
r
B.4 Correlation Coefficients and the Linear Regression Equation 401
USING SPSS
SCREEN B.8
Output for Linear
Regression
B.5 THE ONE-SAMPLE t-TEST AND SIGNIFICANCE TESTING
OF CORRELATION COEFFICIENTS
As discussed in Chapter 11, this section describes how to (1) perform the one-sample
t-test and compute the confidence interval for , and (2) perform significance testing
of the Pearson and Spearman coefficients.
The One-Sample t-Test
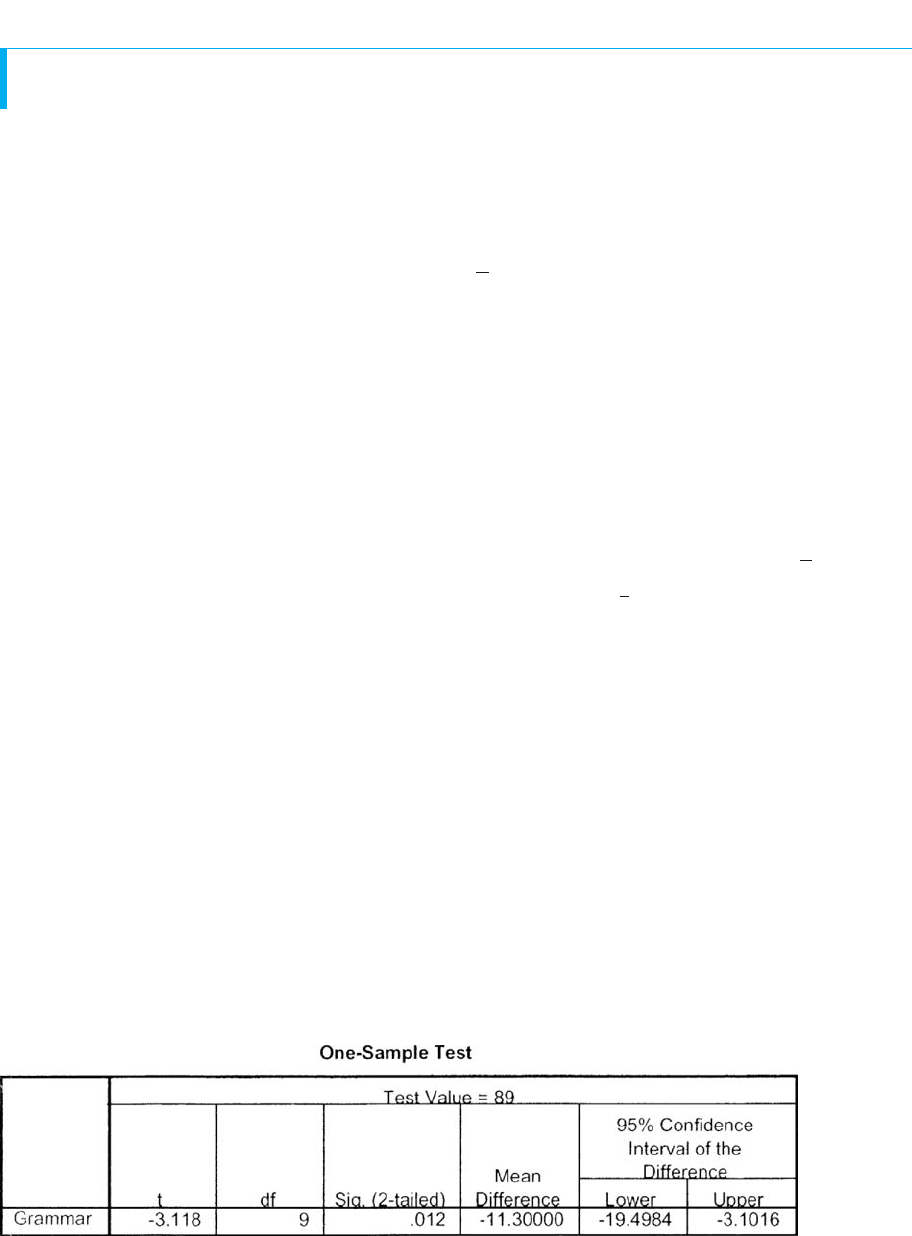
SPSS simultaneously computes and for the sample, performs the t-test, and com-
putes the confidence interval. For example, we want to test if poor readers score differ-
ently on a grammar test than the national population of readers (where so
). Our dependent (grammar) scores are
72 67 59 76 93 90 75 81 71 93
Enter the data: Name the variable and enter the scores as usual.
Select the t-Test: On the Menu Bar, select Analyze, Compare Means, and One-sample
T Test. The “One-Sample T Test” box appears.
Select the variable: Move your dependent variable to “Test Variable(s).”
Enter : Click the space at Test Value and enter your value of . (For the example,
enter 89.)
The output: Click OK. The “One-Sample Statistics” table shows the and
for our data. The “Std. Error Mean” is . The t-test results are in Screen B.9.
Deciding if a Result Is Significant
In Screen B.9, the is with . For a two-tailed test you do not need to look
up . Under “Sig. (2-tailed)” is the smallest possible value of that is needed for the
results to be significant. This must be less than or equal to your for the results to be sig-
nificant. In the example is , indicating that is significant if the region of rejection
is the extreme of the sampling distribution. Thus, is in a region that is smaller than
our usual of the curve. Therefore, this would be beyond our , so it is significant.
If the “Sig. (2-tailed)” value is .000, it means that —and —is less than .
On the other hand, if “Sig. (2-tailed)” had been, say, , then this is beyond
only when the region of rejection is of the curve. This is larger than our region,
so is not beyond our , and is not significant.t
crit
t
obt
.05.06
t
crit
t
obt
.06
.001p␣
t
crit
t
obt
.05
t
obt
.012
t
obt
.012
␣
␣t
crit
df 5 923.424t
obt
s
X
s
X
111.4612
X 177.702
H
0
: 5 89
5 89;
s
X
X
402 APPENDIX B / Using SPSS
SCREEN B.9
Output for the One Sample t-Test

The Confidence Interval for
Also in Screen B.9 is a slightly different version of a confidence interval. It indicates
the minimum and maximum difference that is likely between the in and the rep-
resented by our sample. To convert this to our confidence interval, add the values
shown under “Lower” and “Upper” to the in your . Here we happen to be adding
negative numbers, so adding to 89 gives 69.5016; adding to 89
gives 85.8984. Thus, after rounding, the 95% confidence interval for the of poor
readers is .
Significance Testing of the Pearson Correlation Coefficient
SPSS performs significance testing when it calculates . For example, previously in
Section B.4, we correlated extroversion and aggression. Retrieve that file and on the
Menu Bar again select Analyze, Correlate, and Bivariate. In the “Bivariate Correla-
tions” box, be sure Flag significant correlations is checked. Also check whether you
want a one-tailed or a two-tailed test. Click OK. The relevant output is the “Correla-
tions” table in Screen B.10.
The . The second row shows “Sig. (2-tailed)” and to its right is .
This is interpreted as discussed previously in the one-sample t-test: is less than
so the is significant in a two-tailed test. In fact, notice the * at and the
footnote under the table. For a one-tailed test, we interpret “Sig. (1-tailed)” as above.
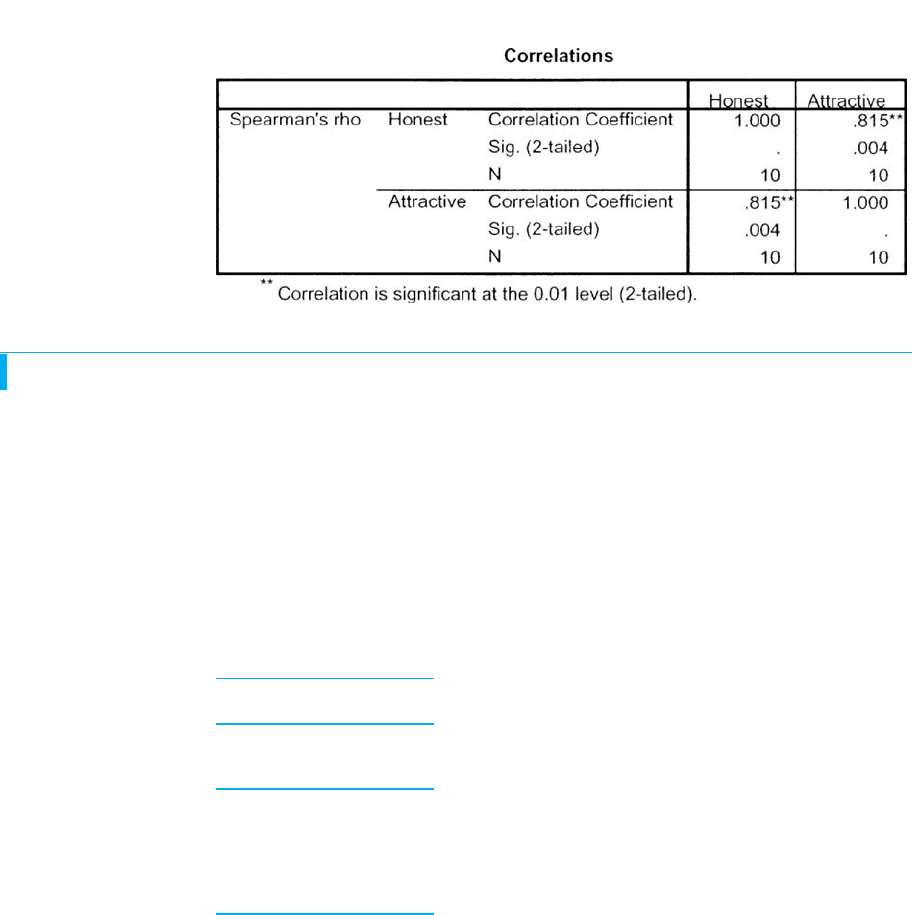
Significance Testing of the Spearman
Correlation Coefficient
Interpret the output for a Spearman like the Pearson r. For example, in Section B.4,
we correlated rankings that reflected attractiveness and honesty, producing Screen B.11.
The . The “Sig. (2-tailed)” is . Because is less than , this
is significant.
For Practice
1. Perform the t-test in Application Question 11 in Chapter 11.
2. For these SPSS results, determine whether each is significant .
(a) , Sig. (2-tailed) ; (b) ,
Sig. (2-tailed) ; (c) , Sig. (2-tailed)
Answers
1. Compare your output to the answers in Appendix D.
2. (a) Significant; (b) significant; (c) not significant.
5 .20t
obt
522.21, N 5 85 .000
r
obt
52.531, N 5 1805 .041N 5 28r
S
51.42,
1␣ 5 .052
r
S
.05.004.004r
S
51.815
r
S
.747r
obt
.05,
.033
.033r
obt
5 .747
r
69.50 # # 85.90
23.1016219.4984
H
0
H
0
B.5 The One-Sample t-Test and Significance Testing of Correlation Coefficients 403
USING SPSS
SCREEN B.10
Significance Test of r
B.6 TWO-SAMPLE t-TESTS
This section describes how to compute the independent-samples and related-samples
t-test (as in Chapter 12) along with the corresponding confidence intervals and descrip-
tive statistics.
Identifying the Conditions of the Independent Variable
First, we must tell SPSS the condition in which each participants’ dependent score
belongs. For example, say that we test the influence of the independent variable of the
color of a product’s label (Blue or Green) on the dependent variable of how desirable it
is, obtaining these scores:
Independent Variable: Color
Condition 1: Condition 2:
Blue Green
10 20
12 24
14 28
17 19
16 21
Name the variables: In the Data Editor, name one variable using the independent
variable (Color) and one using the dependent variable (Desire.)
Label the output: We will use a number to tell SPSS in which condition each score
belongs. So first, arbitrarily choose a number to identify each condition. Lets use “1”
for Blue and “2” for Green. However, it is very helpful to have output in which the con-
ditions are labeled with words and not 1s and 2s. Therefore, while in variable view in
the Data Editor, in the row for the independent variable, click on the rectangle under
“Values” and then in it click the gray square with the three dots. In the “Values Label”
box, at “Value,” enter the number for one condition (e.g., 1). At “Value Label,” enter
the name of the condition for the output (e.g., Blue). Click Add. Likewise, in the same
“Values Label” box, enter “2” and “Green,” and click Add. Click OK.
404 APPENDIX B / Using SPSS
SCREEN B.11
Significance Test of r
S
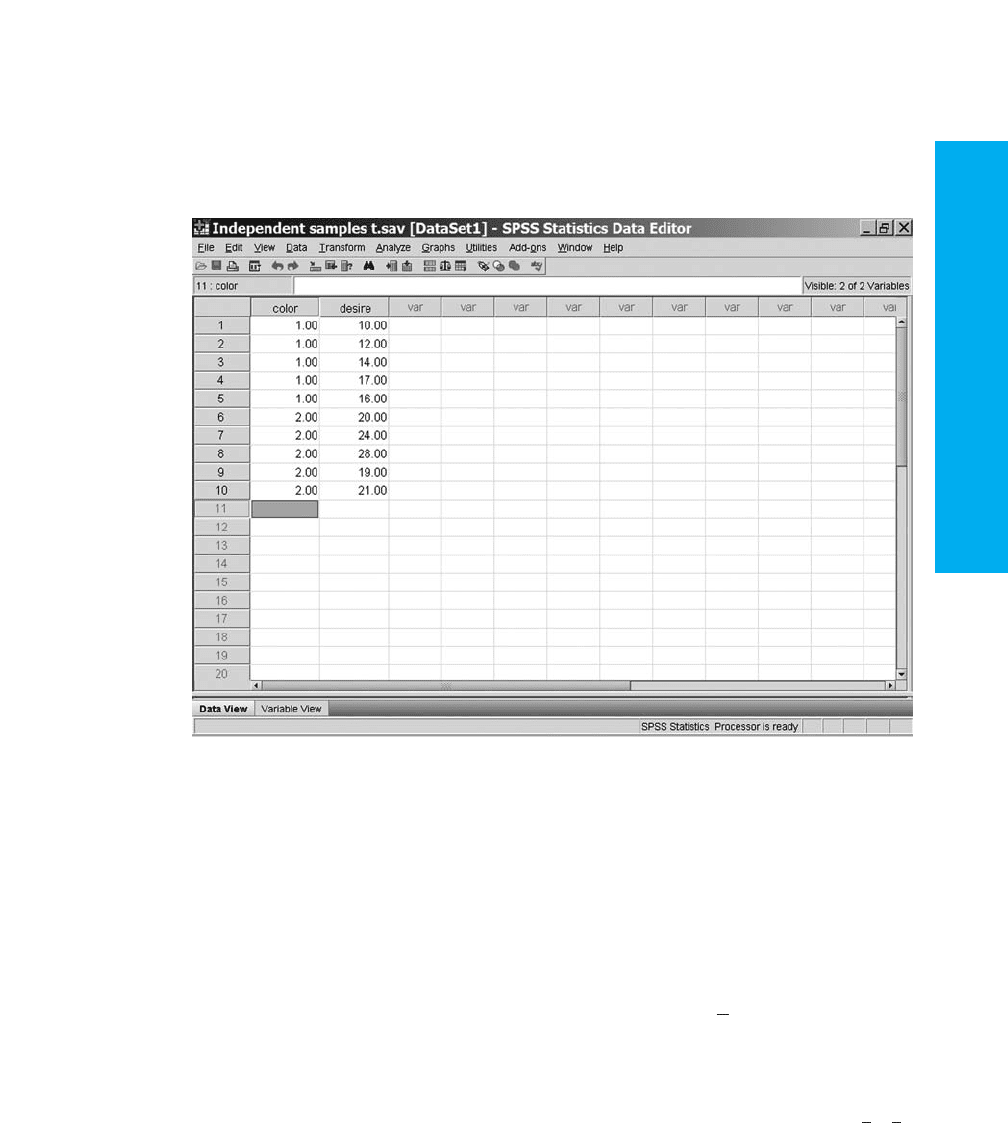
Enter the data: Return to data view. To enter each dependent score, first identify the
condition by entering the condition’s number under “color.” Then, while in the same
row, enter the score under “desire.” Thus, for the first participant in Blue who scored 10,
in the first row of the Data Editor, enter a 1 under “color” and a 10 under “desire.” Next
enter 1 and 12 and so on. In the sixth row, enter 2 (for Green) under “color,” with 20
under “desire,” and so on. The completed Data Editor is in Screen B.12.
B.6 Two-Sample t-Tests 405
USING SPSS
SCREEN B.12
Data Editor for the
Independent-Samples
t-Test
The Independent-Samples t-Test
Enter the data: Input the data as described above. Save this file. (The following
assumes that you have equal ns.)
Select the t-test: On the Menu Bar, select Analyze, Compare Means, and Independent-
Samples T-test. The “Independent-Samples T-test” box appears.
Select the variables: Move your dependent variable (Desire) to “Test variable(s).”
Move your independent variable to “Grouping Variable.”
Identify the conditions: Click Define groups. In the “Define Groups” box, enter the
number used to identify each condition. (We used 1 and 2.) Click Continue.
The output: Click OK. In the “Group Statistics” box is the and for each condi-
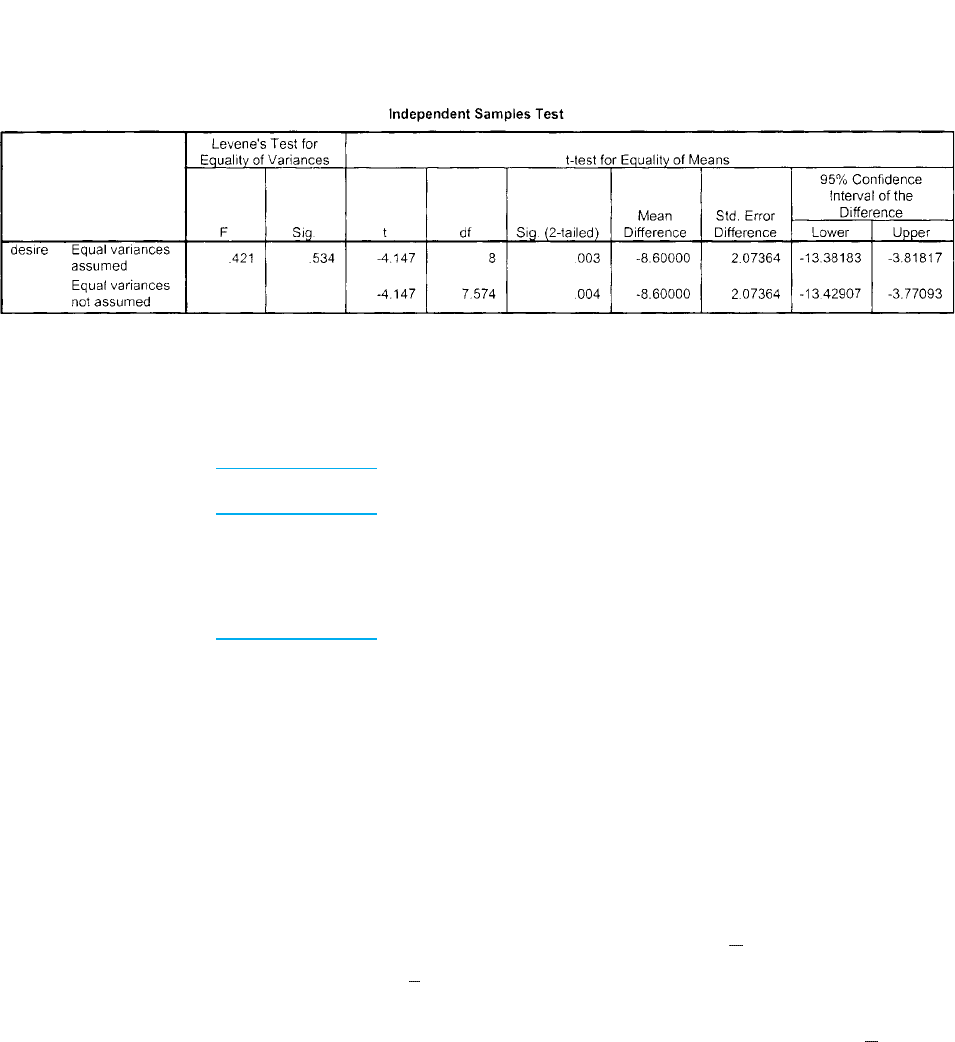
tion. The t-test is in the “Independent Samples Test” box, as in Screen B.13.
Read the row for “Equal variances assumed”: The is , with . The
“Sig. (2-tailed)” is , so is significant. The “Mean Difference” is the difference
between the means of the two conditions. The “Std. Error Difference” is our .
The confidence interval is for the difference between the , so with rounding,
. You must compute the effect size using our formula
for .r
2
pb
213.38 #
1
2
2
#23.82
s
s
X
1
2X
2
t
obt
.003
df 5 824.147t
obt
s
X
X
The Related-Samples t-Test
For a related-samples t-test, we enter the data differently than above. For example, say
that we study the total errors made in estimating distance by the same people when
using one or both eyes. We obtain these data:
One Eye Two Eyes
10 2
12 4
92
61
83
Enter the data: In the Data Editor, create two variables, each the name of a condi-
tion of the independent variable (for example, One and Two). Then in each row of the
Data Editor, enter the two dependent scores from the same participant; for example, in
row 1, enter 10 under One and 2 under Two. (In a matched-samples design, each row
contains the two scores from a matched pair.)
Select the t-test: On the Menu Bar, select Analyze, Compare Means, and Paired-
Samples T-test. The “Paired-Samples T-test” box appears.
Select the variables: In the area under “Paired Variables,” drag and drop each of
your variables into the highlighted row labeled “1.” Drop one variable under “Variable
1” and the other under “Variable 2.”
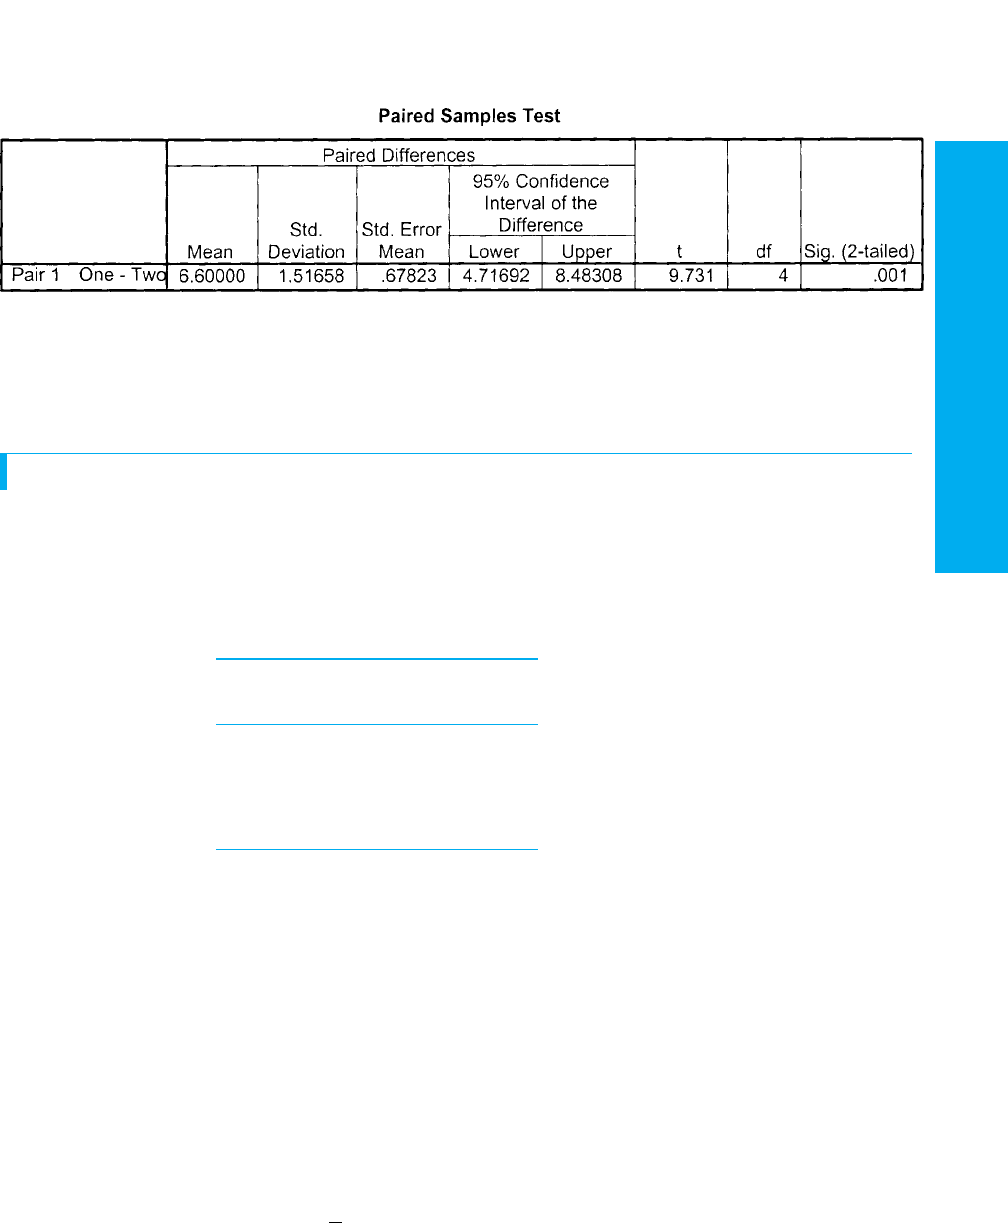
The output: Click OK. The output for the t-test is in the “Paired Samples Test” table
as in Screen B.14.
The “Mean” (6.6) and “Std. Deviation” (1.52) are our and . The “Std.
Error Mean” is our . The confidence interval is for , so with rounding,
. The is , with . The “Sig. (2-tailed)” is , so
the results are significant .
The output also includes the “Paired Samples Statistics” table, containing the and
in each condition. In the “Paired Samples Correlations” table is the Pearson
between the scores in the two conditions. This is not effect size! For that, you must use
our formula for .
For Practice
1. Perform the independent-samples t-test in Application Question 21 in Chapter 12.
Your answers should match those in Appendix D.
r
2
pb
rs
X
X
1p 5 .0012
.001df 5 419.731t
obt
4.72 #
D
# 8.48
D
s
D
s
D
D
406 APPENDIX B / Using SPSS
SCREEN B.13
Output for the Independent-Samples t-Test
2. Perform the related-samples t-test in Application Question 15 in Chapter 12.
Compare your answers to those in Appendix D.
B.7 THE ONE-WAY, BETWEEN-SUBJECTS ANOVA
This section describes how to perform the one-way, between-subjects ANOVA, as
described in Chapter 13. This includes Tukey’s HSD comparisons, descriptive statistics
for each level, and graphs. (These instructions assume equal ns.)
Say that we expand the study discussed with the independent-samples t-test, testing
the influence of three colors on a product’s desirability. We have these data:
Condition 1: Condition 2: Condition 3:
Blue Green Yellow
10 20 24
12 24 25
14 28 26
17 19 21
16 21 23
Enter the data: Enter the data as we did in the independent-samples t-test: Name
one variable for the independent variable (for example, Color) and one for the depend-
ent variable (Desire). Again identify a participant’s condition by entering the condi-
tion’s number in the Color column (either a 1, 2, or 3). In the same row, enter that
participant’s dependent score in the Desire column.
Label the output: Use words to label each level, as we did in the independent-
samples t-test.
Select the ANOVA: On the Menu Bar, select Analyze, Compare Means, and One-
way ANOVA. The “One-Way ANOVA” box appears.
Select the Variables: Move your dependent variable (Desire) to “Dependent list.”
Move your independent variable (Color) to “Factor.”
Select the post hoc test: Click Post Hoc and, in the box that appears, checkmark the
box with only the word Tukey. Click Continue.
Select Descriptive: Click Options and, in the “Options” box, checkmark Descrip-
tive to get the and of each level.s
X
X
B.7 The One-Way, Between-Subjects ANOVA 407
USING SPSS
SCREEN B.14
Output for the Related-Samples t-Test