Hill A.V. The Encyclopedia of Operations Management: A Field Manual and Glossary of Operations Management Terms and Concepts
Подождите немного. Документ загружается.


ptg6843605
S&OP – safety leadtime
The Encyclopedia of Operations Management Page 306
Is this process in control? If a process is in control, the performance variable will have a constant mean and
can be modeled as y
t
= μ + e
t
, where y
t
is the t-th observation, μ is the mean, and e
t
is the error term in period
t. If the sequence of errors is random, the errors should change signs fairly often, but not too often.
Is this model a good fit for the time series data? If the model is a good fit for the data, the errors should be
random and should change signs fairly often, but not too often.
Does this time series have serial correlation? If successive values are correlated (e.g., COR(x
t
, x
t−1
)) > 0),
the time series has serial correlation and is not serially (sequentially) independent.
Can we assume that values from two different sources come from the same underlying population? If
we have values from two different sources (locations, firms, subpopulations), are they from the same
distribution or are they different?
The above questions involve a sequence that can be coded (represented) as a sequence of 0 and 1 values. All
sequences can be coded as a binary variable using methods such as:
Code an increase from period to period as a 1 and a decrease as a 0.
Code a value greater than the mean (or median or mode) as a 1 and below as a 0.
Code a value greater than zero (or some other cut point value) as a 1 and below as a 0.
Combine the sequences from the two sources, rank them from lowest to highest values, and label the data
from the first source with a 0 and the second source with a 1.
A run is defined as a sequence of one or more binary variables (0 or 1) that have the same value. For
example, the sequence {0, 0, 1, 1, 1, 0, 0, 0, 1, 0, 0, 1, 1, 1, 0, 0} has seven runs. We can use probability theory
to calculate the probability that a sequence has exactly r runs given the number of 1’s and 0’s in the sequence. If
the number of runs in the sequence is far less or far more than expected, the sequence is judged to be not
sequentially independent. For example, when flipping a coin, the sequence HHHHHTTTTT would be
considered just as unexpected as HTHTHTHTHT. The runs test is called a “non-parametric” test, because it can
make inferences from the data without making any statements about the parameter values and requires no
assumptions about the distribution of the data.
See autocorrelation, Durbin-Watson Statistic, random number.
S
S&OP – See Sales & Operations Planning (S&OP).
SaaS – See Software as a Service (SaaS).
safety – Freedom from the occurrence or risk of injury, danger, or loss.
See DuPont STOP, error proofing, Occupational Safety and Health Administration (OSHA), risk
management, risk mitigation.
safety capacity – Capacity that is available in case of an emergency; sometimes called a capacity cushion.
Safety capacity is planned “extra” capacity and can be measured as the difference between the planned
capacity and planned demand. Examples include a medical doctor “on call,” a supervisor who can help in time
of need, or capacity for overtime. Safety capacity is not just having too much capacity; it is capacity that is not
actually working but can be called to work in case of emergency. Although safety capacity, safety stock, and
safety leadtime can both be used to protect a firm from uncertain demand and supply, they are not identical
concepts.
See capacity, safety leadtime, safety stock.
safety factor – See safety stock.
safety leadtime – The difference between the planned and average time required for a task or manufacturing order;
called safety time by Wallace and Stahl (2003).
Safety leadtime is the “extra” planned leadtime used in production planning and purchasing to protect against
fluctuations in leadtime. The same concept can be used in project scheduling. Safety leadtime should absorb the
variability in the leadtimes. Whereas safety stock should be used to absorb variability in the demand and yield,
safety leadtime should be used to protect against uncertainty in leadtimes or task times. Critical chain scheduling
uses a buffer time to protect tasks assigned to constrained resources so they are almost never starved for work.

ptg6843605
safety stock − safety stock
Page 307 The Encyclopedia of Operations Management
For example, if it takes a student an average of 30 minutes to get to school, and the student plans to leave 35
minutes before a class begins, the student will arrive 5 minutes early on average. This means that the student will
have a safety leadtime of 5 minutes.
See critical chain, Master Production Schedule (MPS), purchasing leadtime, safety capacity, safety stock,
sequence-dependent setup time, slack time.
safety stock – The planned or actual amount of “extra” inventory used to protect against fluctuations in demand or
supply; the planned or actual inventory position just before a replenishment order is received in inventory;
sometimes called buffer stock, reserve stock, or inventory buffer.
The business case for safety stock: Safety stock is management’s primary control variable for balancing
carrying cost and service levels. If the safety stock is set too high, the inventory carrying cost will be too high. If
safety stock is set too low, the shortage cost will be too high. Safety stock is needed in nearly all systems to
protect against uncertain demand, leadtime, and yield that affect demand, supply, or both demand and supply.
Definition of safety stock: Managers often confuse safety stock with related concepts, such as an order-up-
to level (for determining the lotsize), a reorder point (a “minimum” inventory for triggering a new order), or the
average inventory. Safety stock is the average inventory when a new order is received. It is not the minimum,
maximum, or average inventory. The figure below shows the safety stock as the lowest point on each of the
three order cycles. The actual safety stock over this time period is the average of these three values.
For stationary demand, the average inventory is the safety stock plus the average lotsize inventory. Given
that the average lotsize inventory is half the average lotsize, the average inventory is
/2I SS Q
units, where
SS is the safety stock and
Q
is the average lotsize. Therefore, safety stock can be estimated as
/2SS I Q
.
Safety stock in different types of systems: The reorder point system, the order-up-to (target) inventory
system, the Time Phased Order Point (TPOP) system, and MRP systems manage inventory with a planned (or
forecasted) demand during the replenishment leadtime. Safety stock protects the organization from demand
during the leadtime that is greater than planned. Therefore, safety stock should be based on the standard
deviation of demand during leadtime and not just the average demand during leadtime.
Safety stock and days supply: It is a common practice to define safety stock in terms of a constant days
supply. Although it is fine to communicate safety stocks in terms of days supply, it is a bad idea to use a
constant days supply to set safety stock, unless all items have the same leadtime, average demand, standard
deviation of demand, yield, and stockout cost.
The equation for safety stock: Define X as the demand during the replenishment leadtime. Safety stock is
then
X
SS z
, where z is the safety factor, which is usually between 1 and 4, and
X
is the estimated standard
deviation of demand during replenishment leadtime. Assuming that demand is serially independent, the standard
On-hand
Inventory
Time
s
3
s
2
s
1
Cycle inventory and safety stock inventory
Q
1
Q
2
Q
3
Order
cycle 1
Order
cycle 2
Order
cycle 3
Lotsize inventory
Safety stock inventory

ptg6843605
safety stock – safety stock
The Encyclopedia of Operations Management Page 308
deviation of demand during the leadtime is
X
D
L
, where L is the fixed planned replenishment leadtime
and
D
is the standard deviation of demand per period. Safety stock is then
D
SS z L
.
Safety stock and the leadtime parameter L: The basic safety stock model assumes that leadtime (L) is
constant. More complicated models treat leadtime as a random variable and use the average leadtime and the
standard deviation of the leadtime. Therefore, leadtime can be handled in the safety stock model in three ways:
(1) use a constant leadtime at the average, (2) use a constant leadtime at a value well above the average, or (3)
use the safety stock based on the standard deviation of the leadtime, e.g.,
2 2 2
X L D D L
. When the
review period P is greater than zero, the equation is
2 2 2
( )
X L D D L
P
(Silver, Pyke, and Peterson
1998).
Safety stock versus safety leadtime: As a general rule, safety stock should be used to absorb the variability
in the demand (or yield), and safety leadtime should be used to protect against uncertainty in leadtimes. Whereas
safety stock requires more inventory, safety leadtime requires that inventory arrive earlier.
The safety factor parameter z: The safety factor (z) determines the service level, where the service level
increases as z increases. Many academic textbooks are imprecise on this subject. At least three approaches can
be used to calculate the safety factor: (1) the order cycle service level approach, (2) the unit fill rate approach,
and (3) the economic approach. Each of these approaches is described briefly below.
The order cycle service level approach is commonly taught in texts and implemented in major software
systems (including SAP). This approach defines the service level as the probability of a shortage event on one
order cycle. An order cycle is defined as the time between placing orders, and the average number of order
cycles per year is A/Q, where A is the annual demand in units, and Q is the average order quantity. The safety
factor for this approach is based on the standard normal distribution (i.e.,
1
( )z F SL
). This z value can be
easily calculated in Excel using NORMSINV(SL). The order cycle service level approach does not consider how
many order cycles are expected per year or how many units might be short in a stockout event and is therefore
not recommended.
The unit fill rate service level approach for setting the safety factor defines the service level as the expected
percentage of units demanded that are immediately available from stock. This approach defines safety stock
closer to the actual economics; however, this approach is much more complicated than the order cycle service
level approach. No matter which service level approach is used, it is not clear how to set the best service level.
The economic approach for setting the safety factor z requires an estimate of the shortage or stockout cost
per unit short (stocked out). If management is able to estimate this cost, the newsvendor model can be used to
determine the safety factor that will minimize the expected total incremental cost (carrying cost plus shortage
cost). This model balances the cost of having to carry a unit in safety stock inventory and the cost of having a
unit shortage. Unfortunately, it is difficult to estimate the cost of a shortage (or a stockout) for one unit at the
retail level. It is even more difficult to translate a shortage (or a stockout) into a cost at a distribution center,
factory warehouse, or finished goods inventory.
The periodic review system: For a periodic review system with a time between reviews of P time periods,
L should be replaced with L + P in all equations. In other words, when ordering only every P time periods, the
safety stock is
D
SS z L P
. Note that P = 0 for a continuous review system.
The Time Phased Order Point (TPOP) system: If a firm places replenishment orders based on a TPOP
system (based on forecasts), the safety stock should be defined in terms of the standard deviation of the forecast
error rather than the standard deviation of demand. Unfortunately, many managers, systems designers,
professors, students, and textbooks do not understand this important concept.
See aggregate inventory management, autocorrelation, cycle stock, demand during leadtime, Economic
Order Quantity (EOQ), Everyday Low Pricing (EDLP), goodwill, inventory management, lotsizing methods,
marginal cost, newsvendor model, order cycle, partial expectation, periodic review system, purchasing leadtime,
reorder point, replenishment order, safety capacity, safety leadtime, service level, square root law for safety
stock, stockout, Time Phased Order Point (TPOP), warehouse.
ptg6843605
Sales & Operations Planning (S&OP)
−
Sales & Operations Planning (S&OP)
Page 309 The Encyclopedia of Operations Management
Sales & Operations Planning (S&OP) – A business process used to create
the Sales & Operations Plan, which is a consensus plan involving
Marketing/Sales, Operations/Logistics, and Finance that balances market
demand and resource capability; also called Sales, Inventory & Operations
Planning (SI&OP).
S&OP is an important process in virtually all firms, but it is particularly
critical in manufacturing firms. Fundamentally, S&OP is about finding the right balance between demand and
supply. If demand is greater than supply, customers will be disappointed, customer satisfaction will decline, and
sales will be lost. If supply is greater than demand, cost will be high.
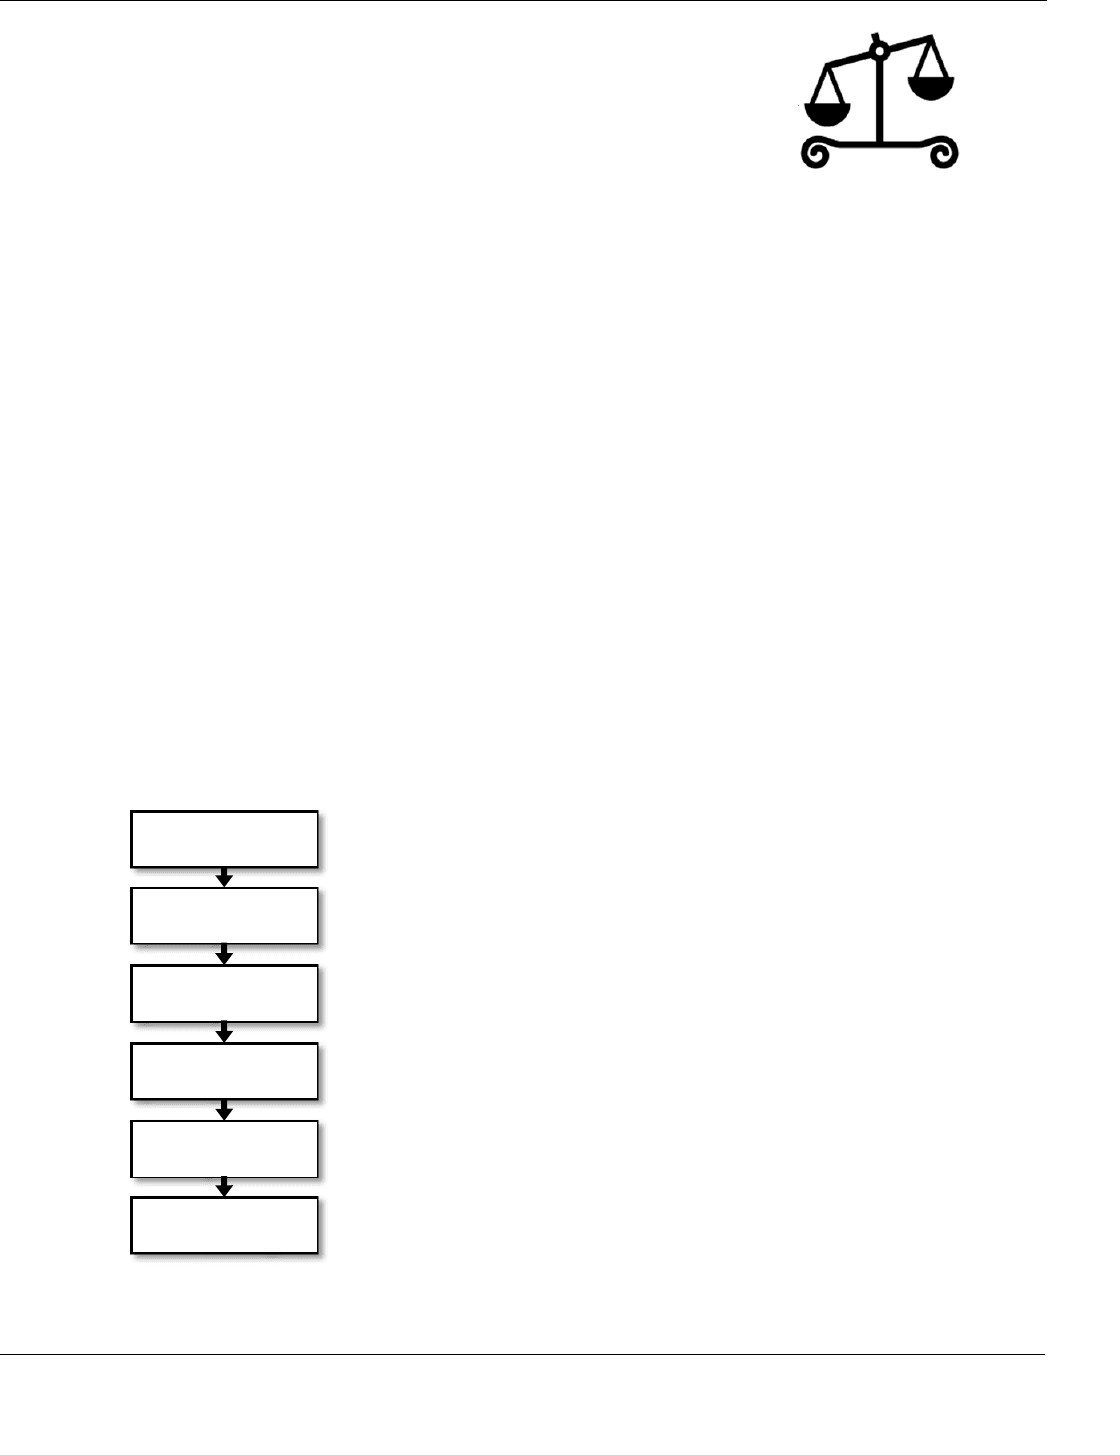
The diagram below presents an example of an S&OP process. This diagram is based on concepts found in
Wallace (2004) and Ling and Goddard (1995). However, it should be noted that each firm will implement S&OP
in a different way. Most experts recommend that the S&OP process be repeated each month. Step 1 usually
begins with statistical forecasts at either a product or product family level. These forecasts are then modified
with market intelligence from sales management, usually for each region. However, some experts argue that
providing statistical forecasts to sales management gives them an easy way out of doing the hard work of
creating the forecasts. Statistical forecasts are useful for the majority of products, and most experts consider it a
waste of time to not use the statistical forecasts as a starting point.
In step 2, the product management and the management of the Strategic Business Unit (SBU) work with the
demand management organization to convert the sales forecasts into an unconstrained demand plan, which
factors in higher-level issues, such as industry trends, pricing, and promotion strategy. The demand plan is
expressed in both units and dollars. In step 3, operations and logistics have the opportunity to check that the
supply (either new production or inventory) is sufficient to meet the proposed demand plan. If major changes
need to be made, they can be made in steps 4 or 5. In step 4 (parallel to step 3), finance reviews the demand plan
to ensure that it meets the firm’s financial objectives (revenues, margins, profits) and creates a financial plan in
dollars. In step 5, the demand management organization coordinates with the other organizations to put together
a proposed Sales & Operations Plan that is a consensus plan from the demand plan, supply plan, and financial
plan. Finally, in step 6, the executive team meets to finalize the S&OP plan. At every step in the process,
assumptions and issues are identified, prioritized, and passed along to the next step. These assumptions and
issues play important roles in steps 5 and 6.
See aggregate inventory management, Business Requirements Planning (BRP), Capacity Requirements
Planning (CRP), chase strategy, closed-loop MRP, demand management, forecasting, level strategy, Master
Week 1
Week 2
Week 3
Week 3
Week 4
Week 4
Step 1: Sales
forecast
Step 2: Demand
planning
Step 3: Supply
planning
Step 4: Financial
planning
Step 5: Pre-S&OP
meetings
Step 6: Executive
S&OP meeting
Sales management starts with a statistical forecast and then creates forecasts by
region for all product families.
Product management, SBU management, and Demand Management aggregate
sales forecasts and create unconstrained demand plans in units and dollars for
each product family.
Operations and logistics review the unconstrained demand plan and signal
p
roblems with supply (capacity, finished goods inventory, or materials).
Finance reviews the unconstrained demand plan and flags problems with
meeting financial objectives.
Demand management works with other stakeholders to create a report for the
senior executive team and identify unresolved issues.
The senior executive team creates the final consensus plans and makes decisions
regarding unresolved issues.
An example S&OP process
Source: Professor Arthur V. Hill
Supply
Demand

ptg6843605
Sales Inventory & Operations Planning (SI&OP) – sample size calculation
The Encyclopedia of Operations Management Page 310
Production Schedule (MPS), product family, production planning, Resource Requirements Planning (RRP),
Rough Cut Capacity Planning (RCCP), time fence.
Sales Inventory & Operations Planning (SI&OP) – See Sales & Operations Planning (S&OP).
salvage value – The value of an item when it is scrapped instead of sold; also known as scrap value.
Retailers and manufacturers can usually find salvage firms or discounters to buy obsolete inventory. Some
companies use salvage firms to buy unsold electronic parts. The salvage firm pays a low price (e.g., $0.01 per
pound) and keeps the parts in inventory for years. In the rare case of a demand, the salvage firm sells the parts
back at the original book value. Large retailers often discount older products in their stores, but if that strategy
does not work, they often turn to branded and unbranded Internet sales channels.
See scrap.
sample size calculation – A statistical method for estimating the number of observations that need to be collected
to create a confidence interval that meets the user’s requirements.
Managers and analysts often need to estimate the value of a parameter, such as an average time or cost.
However, with only a few observations, the estimates might not be very accurate. Therefore, it is necessary to
know both the estimated mean and a measure of the accuracy of that estimate.
Confidence intervals can help with this problem. A confidence interval is a statement about the reliability of
an estimate. For example, a confidence interval on the time required for a task might be expressed as “25 hours
plus or minus 2 hours with a 95% confidence level,” or more concisely “25 2 hours.” The first number (25) is
called the “sample mean.” The second number (2) is called the “half-width” of the confidence interval. The
“95% confidence” suggests that if we were to make this estimate many times, the true mean would be included
(“covered”) in the confidence interval about 95% of the time. It is sometimes stated as, “We are 95% sure that
the confidence interval contains the mean.”
Sometimes some observations have already been collected, and the goal is to develop a confidence interval
from these observations. At other times, the required half-width is known, and it is necessary to find the number
of observations needed to compute this half-width with a certain degree of confidence. It is also possible to
express the half-width as a percentage. The five most common problems related to confidence intervals are:
• Problem 1: Create a confidence interval given that n observations are available.
• Problem 2: Find the sample size needed to create the desired confidence interval with a prespecified half-
width.
• Problem 3: Find the sample size needed to create the desired confidence interval with a prespecified half-
width expressed as a decimal percentage.
• Problem 4: Find the sample size needed to create the desired confidence interval on a proportion with a
prespecified half-width percentage.
• Problem 5: Develop a confidence interval for a stratified random sample.
The entry in this encyclopedia on confidence intervals addresses Problem 1. For Problem 2, the goal is to
find the smallest sample size n that is necessary to achieve a two-tailed 100(1 – α)% confidence interval with a
prespecified half-width of h units.
Step 0. Define parameters – Specify the desired half-width h (in units), the estimated size of the population
N, and the confidence level parameter
. If the size of N is large but unknown, use an extremely large
number (e.g.,
10
10N
). Compute
/2
z
= NORMSINV(
1 / 2
).
Step 1. Take a preliminary sample to estimate the sample mean and standard deviation – Take a
preliminary sample of n
0
observations, where n
0
≥ 9 observations, and estimate the sample mean and
standard deviation (
x
and s) from this sample.
Step 2. Estimate the required sample size – Compute
2
/2
* ( / )n z s h
. Round up to be conservative. If the
sample size n is large relative to the total population N (i.e.,
* / 0.05n N
), use
2 2 2
/2 /2
* ( ) / ( ( ) /n z s h z s N
instead. (This assumes that n* ≥ 30, so it is appropriate to use a z
value; otherwise use the t value.)
Step 3. Take additional observations – If n* > n
0
, take
0
*n n
additional observations.

ptg6843605
sampling − sand cone model
Page 311 The Encyclopedia of Operations Management
Step 4. Recompute the sample mean and sample standard deviation – Recompute
x
and s from the entire
n observations.
Step 5. Compute the half-width and create the confidence interval – Compute the half-width
/2
' /h z s n
. If the sample size n is large relative to the total population N (i.e.,
/ 0.05n N
), use
/2
' / 1 /h z s n n N
instead. The confidence interval is then
'
x
h
.
Step 6. Check results – Make sure that
'h h
; if not, repeat steps 2 to 6.
The larger the number of observations (n), the smaller the confidence interval. The goal is to find the lowest
value of n that will create the desired confidence interval. If n observations are selected randomly many times
from the population, the confidence interval (
'
x
h
) will contain the true mean about 100(1 )%
of the time.
See central limit theorem, confidence interval, dollar unit sampling, sampling, standard deviation.
sampling – The selection of items from a population to help a decision maker make inferences about the population.
Sampling is frequently used when it is impossible, impractical, or too costly to evaluate every unit in the
population. Sampling allows decision makers to make inferences (statements) about the population from which
the sample is drawn. A random sample provides characteristics nearly identical to those of the population.
One major issue in developing a sampling plan is the determination of the number of observations in the
sample (the sample size) needed to achieve a desired confidence level and maximum allowable error. See the
sample size calculation entry for more details.
Probability sampling includes simple random sampling, systematic sampling, stratified sampling,
probability proportional to size sampling, and cluster or multistage sampling. Stratified sampling (also known
as stratification) defines groups or strata as independent subpopulations, conducts random samples in each of
these strata, and then uses information about the population to make statistical inferences about the overall
population. Stratified sampling has several advantages over simple random sampling. First, stratified sampling
makes it possible for researchers to draw inferences about groups that are particularly important. Second,
stratified sampling can significantly tighten the confidence interval on the mean and reduce the sample size to
achieve a predefined confidence interval. Finally, different sampling approaches can be applied to each stratum.
See acceptance sampling, Analysis of Variance (ANOVA), central limit theorem, confidence interval,
consumer’s risk, dollar unit sampling, hypergeometric distribution, Lot Tolerance Percent Defective (LTPD),
normal distribution, operating characteristic curve, producer’s risk, sample size calculation, sampling
distribution, standard deviation, t-test, work sampling.
sampling distribution – The probability distribution for a statistic, such as the sample mean, based on a set of
randomly selected units from a larger population; also called the finite-sample distribution.
A sampling distribution can be thought of as a relative frequency distribution from a number of samples
taken from a larger population. This relative frequency distribution approaches the sampling distribution as the
number of samples approaches infinity. For discrete (integer) variables, the heights of the distribution are
probabilities (also called the probability mass). For continuous variables, the intervals have a zero width, and the
height of the distribution at any point is called the probability density.
The standard deviation of the sampling distribution of the statistic is called the standard error. According
to the central limit theorem, the standard error for the sample mean is always / 1s n , where s is the standard
deviation for the sample. Other statistics, such as the sample median, sample maximum, sample minimum, and
the sample standard deviation, have different sampling distributions.
For example, an analyst is trying to develop a confidence internal on the average waiting time for a call
center where the waiting time follows an exponential distribution. The analyst collects n = 101 sample waiting
times and finds the sample mean and standard deviation are ( , )
x
s = (5.5, 1.2) minutes. According to the central
limit theorem, the sampling distribution for the sample mean is the normal distribution regardless of the
underlying distribution. The sampling distribution for the sample mean, therefore, is normal with mean and
standard deviation
( , / 1)x s n
= (5.5, 0.12) minutes with a 95% confidence interval of (5.26, 5.74) minutes.
See central limit theorem, confidence interval, probability density function, probability distribution,
probability mass function, sampling.

ptg6843605
sand cone model – scalability
The Encyclopedia of Operations Management Page 312
sand cone model – An operations strategy model that suggests a hierarchy for the operations capabilities of quality,
reliability, speed, and cost, where the quality is the base of the sand cone, followed by reliability, speed, and cost.
In the short-term, organizations
often have to make trade-offs
between cost, speed, reliability,
and quality. For example, speed
can sometimes be increased by
using premium freight, which adds
cost. However, Ferdows and De
Meyer (1990) argue that in the
longer run, firms can avoid trade-
offs and build cumulative
capabilities in all four areas. They
argue that management attention
and resources should first go toward
enhancing quality, then
dependability (reliability), then speed (flexibility), and finally cost (efficiency). They argue further that
capabilities are built one on top of the other like a sand cone, where each lower layer of sand must be extended to
support any increase for a higher layer. The drawing above depicts this relationship.
Pine (1993) makes a similar argument in his book on mass customization but changes the order to cost
quality flexibility. He argues that in the life cycle of a product, such as 3M’s Post-it Notes, the first priority
was to figure out a way to make it profitable. The first small batch of Post-it Notes probably cost 3M about
$50,000; but during the first year, 3M was able to find ways to automate production and bring the cost down
substantially. The second priority was then to increase conformance quality to ensure the process was reliable.
Some could argue that this was essentially a continuation of the effort to reduce cost. The third and last priority
was to increase variety from canary yellow
53
in three sizes to many colors and sizes.
See mass customization, operations strategy, premium freight.
SAP – A leading Enterprise Resources Planning (ERP) software vendor; the full name is SAP AG; SAP is the
German acronym for Systeme, Andwendungen, Produkte in der Datenverarbeitung, which translated to English
means Systems, Applications, Products in Data Processing.
SAP was founded in Germany in 1972 by five ex-IBM engineers. SAP is headquartered in Walldorf,
Germany, and has subsidiaries in more than 50 countries. SAP America, which has responsibility for North
America, South America, and Australia, is headquartered just outside Philadelphia.
See ABAP (Advanced Business Application Programming), Advanced Planning and Scheduling (APS),
Enterprise Resources Planning (ERP).
satisfaction – See service quality.
satisficing – The effort needed to obtain an outcome that is good enough but is not exceptional.
In contrast to satisficing action, maximizing action seeks the biggest and optimizing action seeks the best.
In recent decades, doubts have been expressed about the view that in all rational decision making the agent seeks
the best result. Instead, some argue it is often rational to seek to satisfice (i.e., to get a good result that is good
enough although not necessarily the best). The term was introduced by Simon (1957). (Adapted from The
Penguin Dictionary of Philosophy, ed. Thomas Mautner, found at www.utilitarianism.com/satisfice.htm, April
1, 2011.)
See bounded rationality, learning curve, learning organization.
SBU – See Strategic Business Unit (SBU).
scalability – The ability to increase capacity without adding significant cost, or the ability to grow with the
organization.
For example, software is said to be “scalable” if it can handle a significant increase in transaction volume.
See agile manufacturing, flexibility, resilience.
53
Humorous aside: 3M has a copyright on the color canary yellow.
Quality
Reliability
Speed
Cost
The sand cone model
Adapted from Ferdows, K. & A. De Meyer (1990).

ptg6843605
scale count − scope creep
Page 313 The Encyclopedia of Operations Management
scale count – An item count based on the weight determined by a scale.
A scale count is often more economical than performing an actual physical count. This is particularly true
for small inexpensive parts where slight inaccuracy is not important. Counting accuracy depends on the scale
accuracy, the variance of the unit weight, and the variance of the container tare weight. Of course, the container
tare weight should be subtracted from the total weight.
See cycle counting, tare weight.
scales of measurement – The theory of scale types.
According to Wikipedia, psychologist Stanley Smith Stevens developed what he called levels of
measurement that include:
Nominal scale – Categorical, labels (however, some critics claim that this is not a scale).
Ordinal scale – Rank order.
Interval scale – Any quantitative scale, such as temperature, that has an arbitrary zero point; although
differences between values are meaningful, ratios are not.
Ratio scale – Any quantitative scale, such as a weight, that does not have an arbitrary zero point; ratios are
meaningful.
See operations performance metrics.
scatter diagram – A graphical display of data showing the relationship between two variables; also called
scatterdiagram and scatterplot.
The scatter diagram is usually drawn as a set of points on a graph. When the points appear to fall along a
line (e.g., from bottom left to top right), the user might hypothesize a linear relationship.
See linear regression, Root Cause Analysis (RCA), run chart, seven tools of quality.
scheduled receipt – See open order.
scientific management – An approach to management and industrial organization developed by Frederick
Winslow Taylor (1856-1915) in his monograph The Principles of Scientific Management (Taylor 1911).
Taylor believed that every process had “one best way” and developed important industrial engineering and
operations management approaches, such as the time and motion studies, to find that best way. For example, in
one of Taylor’s most famous studies, he noticed that workers used the same shovel for all materials. His research
found that the most effective load was 21.5 pounds, which led him to design different shovels for each material
for that weight.
Taylor made many important contributions to the field of operations management, emphasizing time and
motion studies, division of labor, standardized work, planning, incentives, management of knowledge work, and
selection and training. Taylor also influenced many important thought leaders, including Carl Barth, H. L. Gantt,
Harrington Emerson, Morris Cooke, Hugo Münsterberg (who created industrial psychology), Frank and Lillian
Gilbreth, Harlow S. Person, and James O. McKinsey and many important organizations, such as Harvard
University’s Business School, Dartmouth’s Amos Tuck School, University of Chicago, Purdue University,
McKinsey (an international consulting firm), and the American Society of Mechanical Engineers. His work also
influenced industrial development in many other nations, including France, Switzerland, and the Soviet Union.
One criticism of scientific management is that it separated managerial work (e.g., planning) and direct labor.
This led to jobs where workers were not expected to think. In contrast, many successful Japanese firms stress the
need to gather suggestions from workers and require managers begin their careers on the shop floor.
See
best practices, division of labor, human resources, job design, standardized work, time study, work
measurement.
scope – See project management, scope creep.
scope creep – The tendency for project boundaries and requirements to expand over time, often resulting in large,
unmanageable, and never-finished projects.
Scope creep is reflected in subtle changes in project requirements over time. For example, a software project
might start out as a simple table that needs to be accessed by just a single type of user. However, as the user
group becomes engaged in the project, the “scope” increases to include a larger and more complicated database
with multiple tables and multiple types of users.

ptg6843605
scoping
–
scrum
The Encyclopedia of Operations Management Page 314
One of the main keys to successful project management is avoiding scope creep. If the users want to
increase the scope of a project, they should be required to either go back and change the charter (and get the
appropriate signed approvals) or defer the changes to a new project. If management does not manage scope
creep, the project will likely not be completed on time or within budget.
In a consulting context, scope creep is additional work outside the project charter that the client wants for no
additional charge. If the client is willing to change the charter and pay for the work, it is an “add-on sale” and is
not considered scope creep.
See focused factory, project charter, project management, project management triangle, scoping.
scoping – The process of defining the limits (boundaries) for a project.
Defining the project scope is a critical determinant of the success of a project. When scoping a project, it is
just as important to define what is not in scope as it is to define what is in scope.
See project charter, project management, scope creep.
SCOR Model – A process reference model that has
been developed and endorsed by the Supply-Chain
Council as the cross-industry, standard, diagnostic
tool for supply-chain management, spanning from
the supplier’s supplier to the customer’s customer;
acronym for Supply-Chain Operations Reference.
The SCOR Model allows users to address,
improve, and communicate supply chain
management practices within and between all
interested parties. The SCOR framework attempts to
combine elements of business process design, best practices, and benchmarking. The basic SCOR model is
shown above.
The SCOR Model was developed to describe the business activities associated with all phases of satisfying a
customer’s demand. It can be used to describe and improve both simple and complex supply chains using a
common set of definitions. An overview of the SCOR Model can be found on the Supply Chain Council
webpage http://supply-chain.org. Some of the benefits claimed for the SCOR Model include (1) standardized
terminology and process descriptions, (2) predefined performance measures, (3) best practices, and (4) basis for
benchmarking a wide variety of supply chain practices.
See benchmarking, bullwhip effect, Supply Chain Council, supply chain management, value chain.
scrap – Material judged to be defective and of little economic value.
Scrap is any material that is obsolete or outside specifications and cannot be reworked into a sellable product.
Scrap should be recycled or disposed of properly according to environmental laws. A
scrap factor
(or yield
rate) can be used to inflate the “quantity per” to allow for yield loss during a manufacturing process. The
scrap
value
(or
salvage value
) is credited to factory overhead or the job that produced the scrap.
See conformance quality, cost of quality, red tag, rework, salvage value, yield.
scree plot – See cluster analysis.
scrum – A method of implementing agile software development, where teams meet on a daily basis, and computer
code is delivered in two to four week “sprints.”
Scrum is similar to
lean thinking
in many ways. The fundamental concept of scrum is that the organization
produces computer code in small “chunks” (like small lotsizes) that can be quickly evaluated and used by others.
This allows for early detection of defects, a key operations management concept. This is consistent with the lean
concept of reducing lotsizes and “one-piece flow.” Scrum is also similar to lean in that it requires short stand-up
meetings and clear accountabilities for work. Scum defines three roles and three meetings:
The three roles:
1. Product owner
– This person manages the product’s requirements and divides the work among team
members and among sprints.
2. Scrum master
– This person runs the daily scrum meeting.
3. Team members
– These are the software developers responsible for delivering code that meets the
requirements.
Plan
Source Make Deliver
Return Return
The SCOR Model

ptg6843605
search cost − sentinel event
Page 315 The Encyclopedia of Operations Management
The three meetings:
1. Sprint Planning Meeting – The product owner and team members meet at the start of a sprint to plan this
period’s work and identify any issues that may impact the program.
2. Daily Scrum Meeting – This 15-minute meeting is led by the scrum master, and each team member is
expected to answer three questions: “What did you accomplish since yesterday’s scrum meeting?”, “What
will you accomplish before tomorrow’s scrum meeting?”, and “What roadblocks may impede your
progress?” The sprint burndown chart, a measure of the team’s progress, is updated during this meeting.
Attendees at scrum meetings are expected to stand, rather than sit, during the 15 minutes. This is to keep the
meeting concise and on time.
3. Sprint Review Meeting – The product owner holds this meeting at the conclusion of a sprint, to review the
state of the deliverables, and cross-check them against the stated requirements for that sprint.
See agile software development, deliverables, early detection, Fagan Defect-Free Process, lean thinking,
New Product Development (NPD), prototype, sprint burndown chart, waterfall scheduling.
search cost – The cost of finding a supplier that can provide a satisfactory product at an acceptable price.
See switching cost, total cost of ownership, transaction cost.
seasonal factor – See seasonality.
seasonality – A recurring pattern in a time series that is based on the calendar or a clock.
The demand for a product is said to have seasonality if it has a recurring pattern on an annual, monthly,
weekly, daily, or hourly cycle. For example, retail demand for toys in North America is significantly higher
during the Christmas season. The demand for access to major highways is much higher during the “rush hours”
at the beginning and end of a workday. For some firms, sales tend to increase at the end of the quarter due to
sales incentives. This is known as the “hockey stick effect.”
Most forecasting models apply a multiplicative seasonal factor to adjust the forecast for the seasonal pattern.
The forecast, therefore, is equal to the underlying average times the seasonal factor. For example, a toy retailer
might have a seasonal factor for the month of December (i.e., the Christmas season) of 4, whereas a low demand
month such as January, might have a seasonal factor of 0.6. Demand data can be “deseasonalized” by dividing
by the seasonal factor. Although it is not recommended, it is also possible to use an additive seasonal factor.
See anticipation inventory, Box-Jenkins forecasting, chase strategy, exponential smoothing, forecasting,
hockey stick effect, level strategy, newsvendor model, production planning, time series forecasting, trend.
self check – See inspection.
self-directed work team – Work groups that have significant decision rights and autonomy.
See High Performance Work Systems (HPWS), human resources, job design, organizational design.
sensei – A reverent Japanese term for a teacher or master.
In the lean manufacturing context, a sensei is a master of lean knowledge with many years of experience.
In traditional lean environments, it is important for the sensei to be a respected and inspirational figure. Toyota
uses a Japanese-trained sensei to provide technical assistance and management advice when it is trying
something for the first time or to help facilitate transformational activities.
See lean thinking.
sensitivity analysis – The process of estimating how much the results of a model will change if one or more of the
inputs to the model are changed slightly.
Although the concept of sensitivity analysis can be used with any model, it is a particularly powerful part of
linear programming analysis. For example, in linear programming, the analyst can determine the additional
profit for each unit of change in a constraint. The economic benefit of changing the constraint by one unit is
called the “shadow price” of the constraint.
See linear programming (LP), operations research (OR).
sentinel event – A healthcare term used to describe any unintended and undesirable occurrence that results in death
or serious injury not related to the natural course of a patient’s illness; sometimes called a “never event.”
A sentinel is a guard or a lookout. Serious adverse healthcare events are called sentinel events because
they signal the need for a “sentinel” or “guard” to avoid them in the future. Examples of sentinel healthcare
events include death resulting from a medication error, suicide of a patient in a setting with around-the-clock