Houze Robert A., Jr. Cloud Dynamics
Подождите немного. Документ загружается.

6.2 Nimbostratus with Shallow Embedded Convection Aloft
209
of the particles originating in the generating cells below the
ODC
level. The vertical
layering of the precipitation processes in this example is further illustrated by a
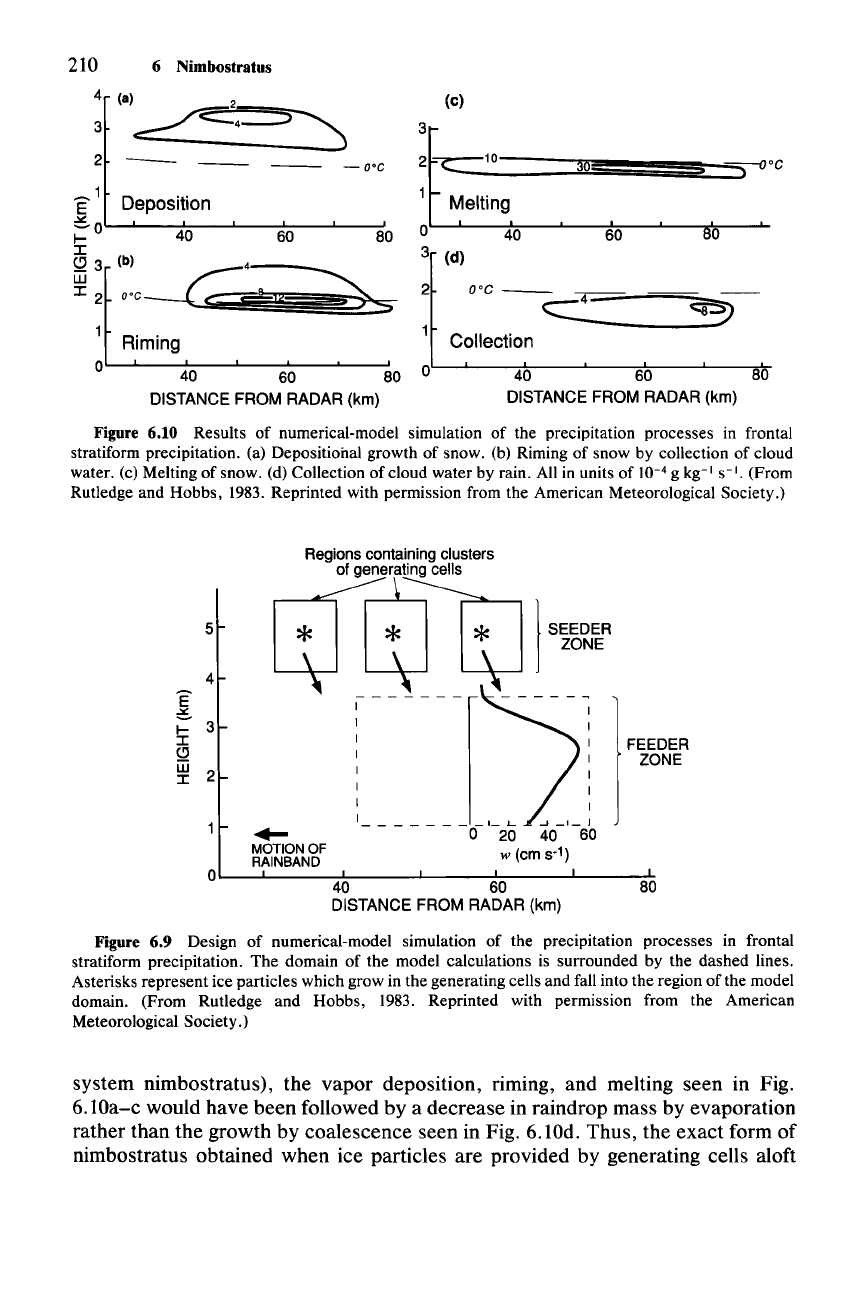
numerical simulation, whose design is indicated in Fig. 6.9. Calculations were
made for the feeder zone. Within this region the vertical and horizontal air mo-
tions were assumed to be those determined from Doppler radar measurements.
The vertical velocity, whose vertical profile is shown in the figure, ranged from
~20
to 50 em
S-I,
values ideal for the stratiform precipitation process. Ice parti-
cles were assumed to be entering the feeder zone from generating cells aloft. To
represent the source of ice particles from the generating cells, the mixing ratio of
falling snow was held at 1 g kg" at the top boundary of the feeder zone throughout
the calculation. As the snow continually fell into the region, two-dimensional (no
variation in the y-direction) versions of the mean-variable thermodynamic equa-
tion (2.78) and water-continuity equations (2.81) were integrated until steady-state
fields were obtained. The eddy-flux terms were omitted. The only diabatic heating
effects included in
'Ie
were those associated with latent heat of phase change of
water. Radiation was ignored. The categories of water substance assumed in the
water-continuity equations were those of the cold-cloud bulk water-continuity
model considered in Sec. 3.6.2: water vapor
(qv), cloud water
(qJ,
rain water (qr),
cloud ice
(q/),
and snow
(q.).
Higher-density snow (qg and qh) is ignored since
graupel and hail particles do not exist in any significant amount in this type of
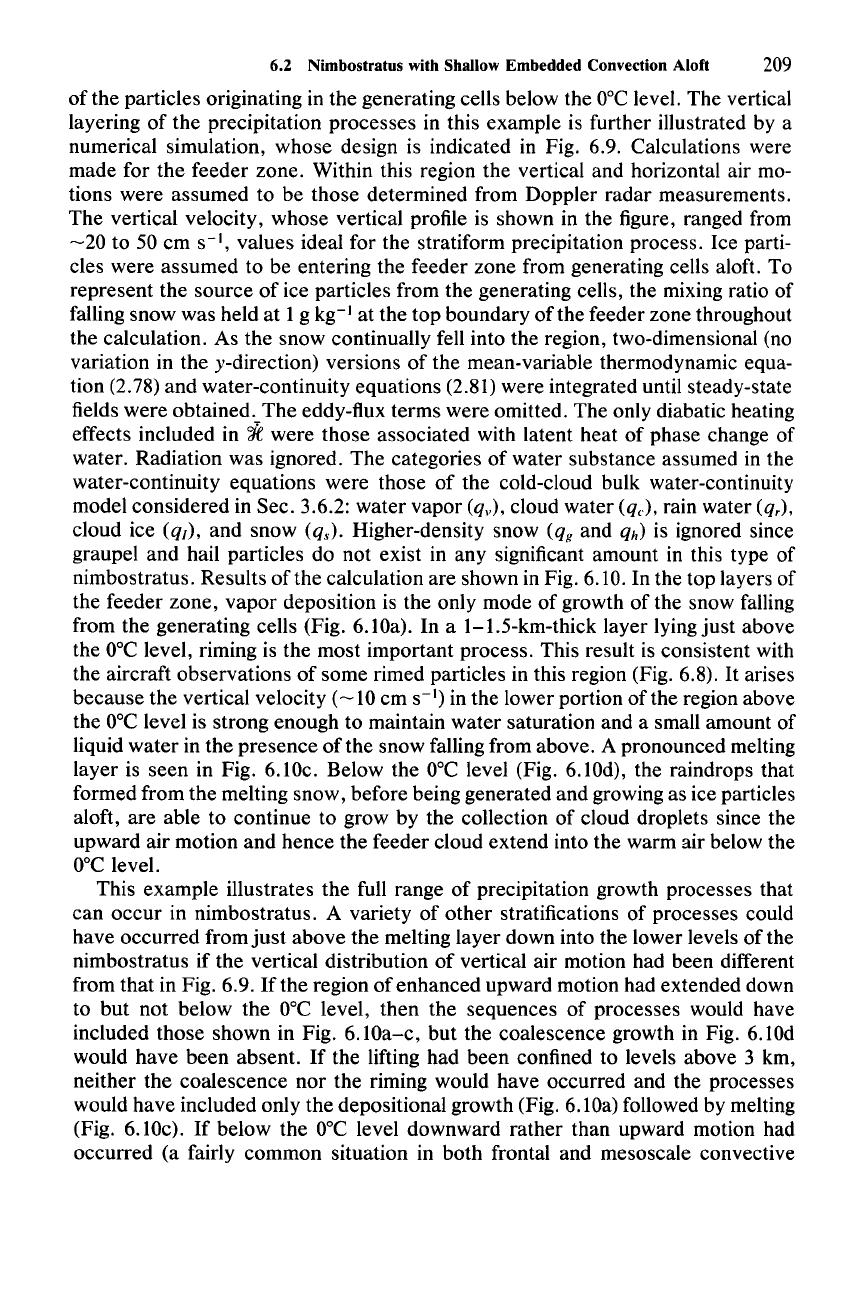
nimbostratus. Results of the calculation are shown in Fig. 6.10. In the top layers of
the feeder zone, vapor deposition is the only mode of growth of the snow falling
from the generating cells (Fig. 6. lOa). In a 1-1.5-km-thick layer lying just above
the
ODC
level, riming is the most important process. This result is consistent with
the aircraft observations of some rimed particles in this region (Fig. 6.8).
It
arises
because the vertical velocity
(-10
em
S-I)
in the lower portion
ofthe
region above
the
ODC
level is strong enough to maintain water saturation and a small amount of
liquid water in the presence of the snow falling from above. A pronounced melting
layer is seen in Fig. 6.lOc. Below the
ODC
level (Fig. 6.10d), the raindrops that
formed from the melting snow, before being generated and growing as ice particles
aloft, are able to continue to grow by the collection of cloud droplets since the
upward air motion and hence the feeder cloud extend into the warm air below the
ODC
level.
This example illustrates the full range of precipitation growth processes that
can occur in nimbostratus. A variety of other stratifications of processes could
have occurred from
just
above the melting layer down into the lower levels of the
nimbostratus if the vertical distribution of vertical air motion had been different
from that in Fig. 6.9.
lithe
region of enhanced upward motion had extended down
to but not below the
ODC
level, then the sequences of processes would have
included those shown in Fig. 6.10a-c, but the coalescence growth in Fig. 6.10d
would have been absent.
If
the lifting had been confined to levels above 3 km,
neither the coalescence nor the riming would have occurred and the processes
would have included only the depositional growth (Fig. 6.10a) followed by melting
(Fig. 6.lOc). If below the
ODC
level downward rather than upward motion had
occurred (a fairly common situation in both frontal and mesoscale convective
s'o
,
--,
O'C
60
30
O'C
--_
__-;::-;::
==;...,.
C-
Collection
o 40 60 80
DISTANCE FROM RADAR (km)
2
(c)
3~
2
=c:::--
10
1~ing,
o 40
3 (d)
80
-O'C
60
Deposition
40
2
~1
E
~
O'--
........
--t::--
........
-----=::--...L----:!
l-
I
(!)
3 (b) 4--_
~
~t
:::::'
"?:
o
'40
60 80
DISTANCE FROM RADAR (km)
210 6 Nimbostratus
4
(8) 2
3
~=4=:::5=~~
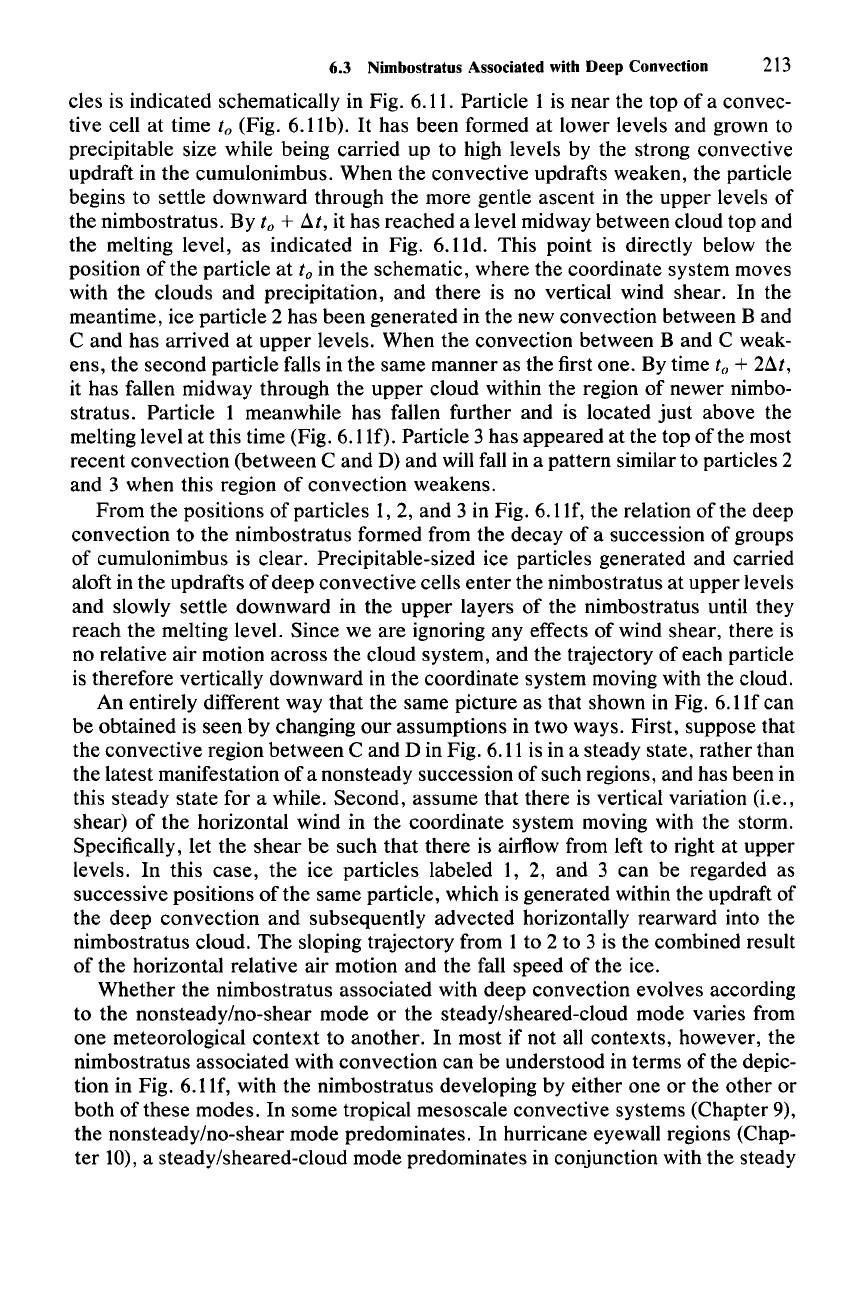
Figure 6.10 Results of numerical-model simulation of the precipitation processes in frontal
stratiform precipitation. (a) Depositional growth of snow. (b) Riming of snow by collection of cloud
water. (c) Melting of snow. (d) Collection
of
cloud
water
by rain. All in units of 10-
4
g kg-I
S-I.
(From
Rutledge and
Hobbs,
1983. Reprinted with permission from the American Meteorological Society.)
5
4
~
I-
3
I
~
~
2
...
MOTION
OF
RAINBAND
)
SEEDER
ZONE
I
I_L
...J_1_J
o 20 40 60
w (em s-1)
FEEDER
ZONE
80
40 60
DISTANCE FROM RADAR (km)
OL..----JL....---.,..L----..L------:l.:---....L...--~
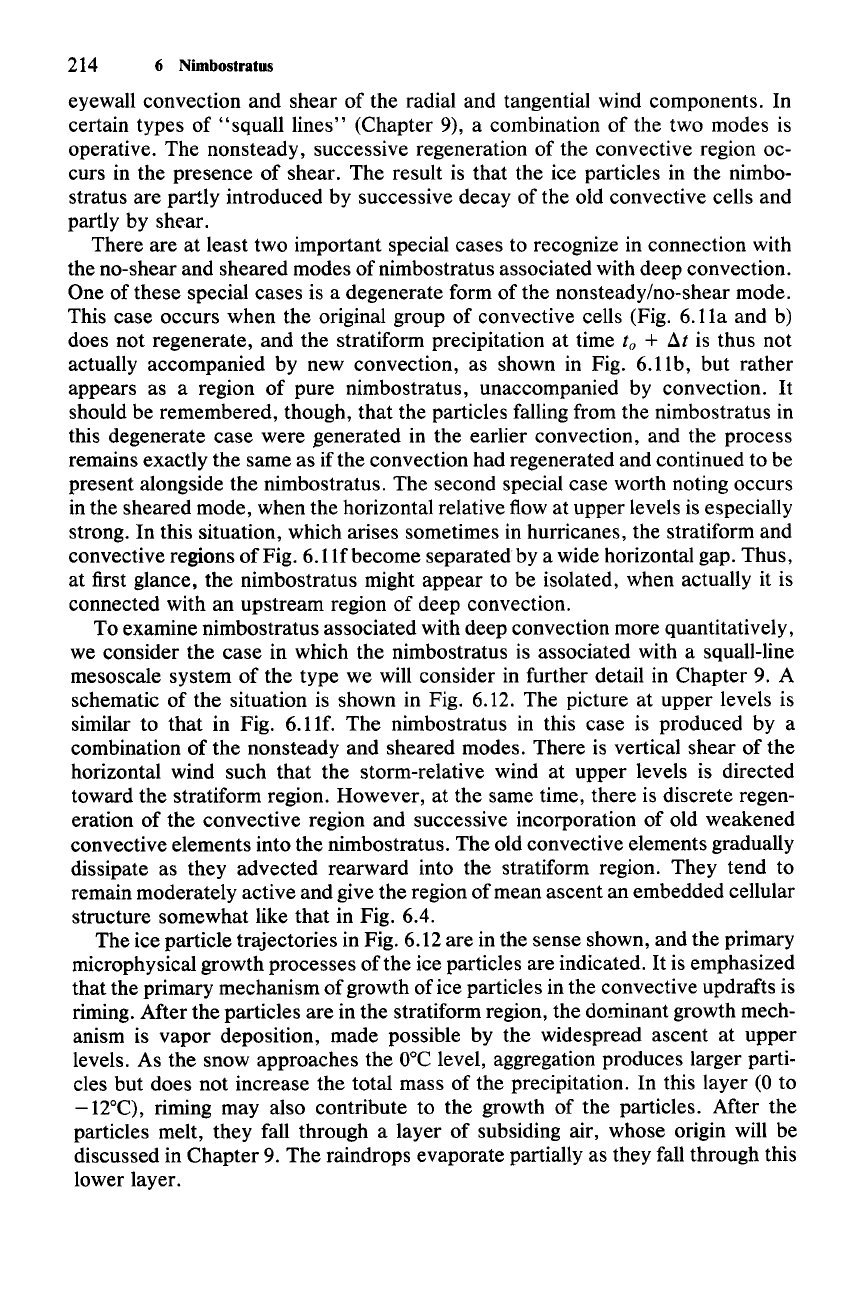
Figure 6.9 Design
of
numerical-model simulation of the precipitation processes in frontal
stratiform precipitation.
The
domain of the model calculations is surrounded by the
dashed
lines.
Asterisks
represent
ice particles which grow in the generating cells and fall into the region of the model
domain.
(From
Rutledge and
Hobbs,
1983. Reprinted with permission from the American
Meteorological Society.)
system nimbostratus), the vapor deposition, riming, and melting seen in Fig.
6.lOa-c would have been followed by a decrease in raindrop mass by evaporation
rather than the growth by coalescence seen in Fig. 6.10d. Thus, the exact form of
nimbostratus obtained when ice particles are provided by generating cells aloft
6.3 Nimbostratus Associated with Deep Convection
211
PLAN
VIEW
VERTICAL CROSS SECTION
»:
c (8)
B
,::,;S}
e A
I
~50
km I
Wli
B A
(b)
-o
stratiform
°0
e
I-Q"J.:
- - (c)
e / GlB A
new convection
(f)
t
o+2L1t
G
~I
-t---~
(e)
D
oo
c
BAD
e B A
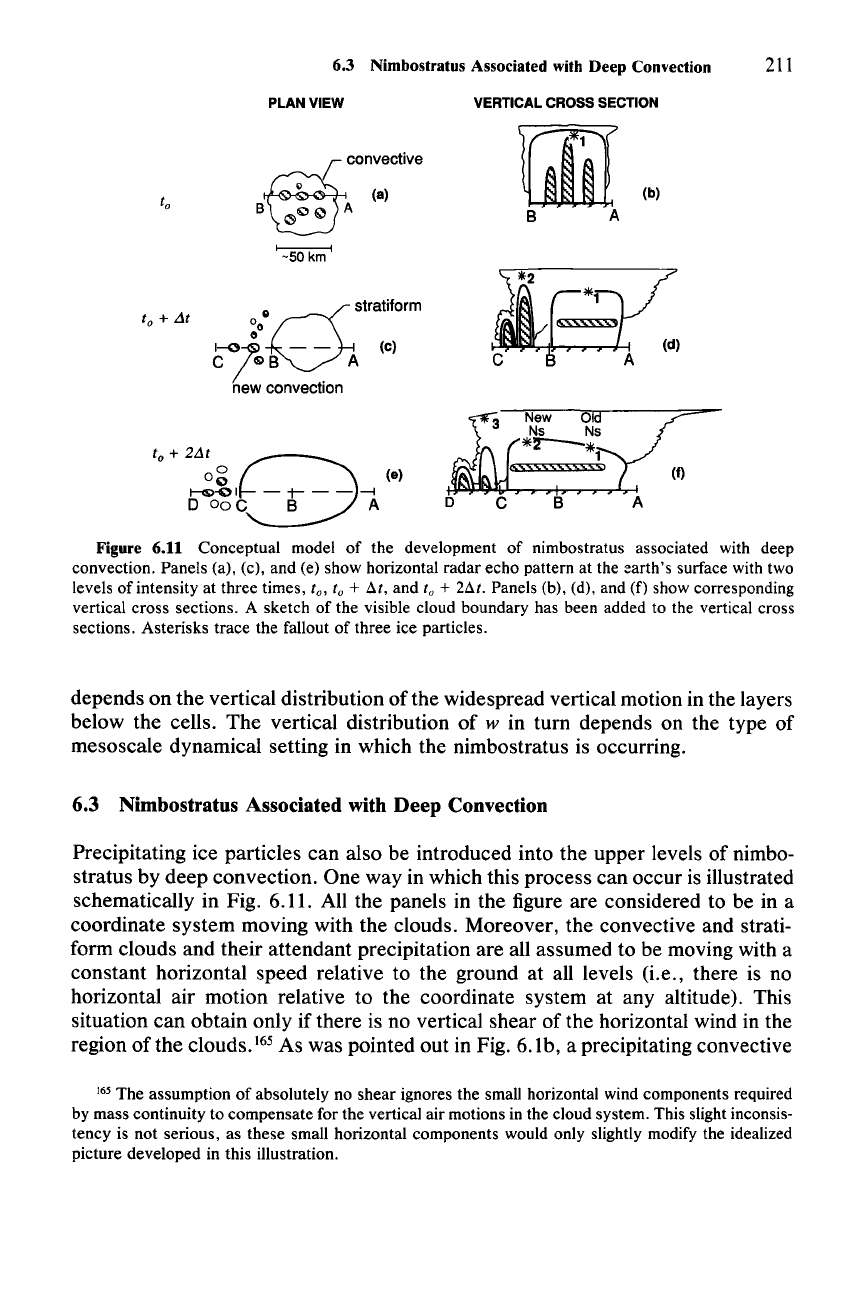
Figure 6.11 Conceptual model of the development of nimbostratus associated with deep
convection. Panels (a), (c), and (e) show horizontal radar echo pattern at the earth's surface with two
levels of intensity at three times,
to, to +
tu,
and to +
2/it.
Panels (b), (d), and
(0
show corresponding
vertical cross sections. A sketch of the visible cloud boundary has been added to the vertical cross
sections. Asterisks trace the fallout of three ice particles.
depends on the vertical distribution
ofthe
widespread vertical motion in the layers
below the cells. The vertical distribution of
w in turn depends on the type of
mesoscale dynamical setting in which the nimbostratus is occurring.
6.3 Nimbostratus Associated with Deep Convection
Precipitating ice particles can also be introduced into the upper levels of nimbo-
stratus by deep convection. One way in which this process can occur is illustrated
schematically in Fig. 6.11. All the panels in the figure are considered to be in a
coordinate system moving with the clouds. Moreover, the convective and strati-
form clouds and their attendant precipitation are all assumed to be moving with a
constant horizontal speed relative to the ground at all levels (i.e., there is no
horizontal air motion relative to the coordinate system at any altitude). This
situation can obtain only if there is no vertical shear of the horizontal wind in the
region of the clouds.
165 As was pointed out in Fig. 6.1b, a precipitating convective
165 The assumption of absolutely no shear ignores the small horizontal wind components required
by mass continuity to compensate for the vertical air motions in the cloud system. This slight inconsis-
tency is not serious, as these small horizontal components would only slightly modify the idealized
picture developed in this illustration.
212 6 Nimbostratus
cell, originally characterized as a local, intense, vertically oriented precipitation
core, evolves into a stratiform structure (indicated by a radar bright band) in its
later stages.
It
follows that if all
ofthe
convective cells initially arranged in a group
at a time
to (e.g., Fig. 6.11a and b) weaken more or less simultaneously, then by
some later time,
to +
at,
the whole region of convection turns into a stratiform
precipitation area composed of the dying remains of the earlier convective cells,
as shown in the right-hand portions of Fig. 6.11c and d. If during the same interval
of time a new group of convective cells forms as shown in the left-hand portions of
Fig. 6.11c and d, then the overall cloud structure becomes that depicted in Fig.
6.11d-a
combination of cumulonimbus and nimbostratus. The right-hand side of
the cloud (between A and B) is nimbostratus that has formed from the weakening
of the original convection, while the left-hand side (between B and C) is composed
of new cumulonimbus. If the new convection at
to +
at
subsequently weakens and
evolves into nimbostratus and another region of convection forms farther to the
left, then the cloud and precipitation structure at time
to +
2at
is that shown in
Fig. 6.11e and
f. The region on the far right (between A and B) is composed of the
old nimbostratus formed from the original convection, the middle region (between
B and C) is new nimbostratus formed from the weakening of the convection at
time
to +
at,
and the region on the far left (between C and D) consists of the
newest cumulonimbus.
In this way, a rather wide region of nimbostratus can form, as each successive
new group of convective cells weakens and becomes part of the stratiform zone.
The nimbostratus formed in this way is typically maintained for a long time by
widespread gentle ascent throughout the upper levels of the nimbostratus. The
widespread upward air motion that maintains the nimbostratus may be solely the
effect of the small but positive buoyancy of the air in the tops of the cumulonimbus
that weaken to form the stratiform cloud. This widespread ascent may also be part
of the mesoscale circulation of a squall line, cold front, or hurricane, if the clouds
under consideration are occurring in the context of one of these types of storms,
which will be considered in more detail in Chapters 9-11.
The widespread ascent in the nimbostratus is typically not uniform. Over most
of the region condition (6.1) is met, but the cloud is composed of old convective
cells. Some of these cells remain moderately active. Consequently, weak, dying
convective cells are typically found embedded within the generally stratiform
precipitation region.
The nimbostratus formed from the weakening of old cumulonimbus is charac-
terized, as is all nimbostratus, by ice particles drifting downward through the
gently ascending air, which rises rapidly enough to provide moisture for the
growth of the ice particles but slowly enough that the particles readily drift down-
ward toward the melting layer and the ground. In this case, though, the precipitat-
ing ice particles are generated and grow to precipitable size during the cumulonim-
bus phase of the cloud. When the cumulonimbus dies and takes on a stratiform
character, precipitating ice particles are already present. Since they thus exist at
the
onset of the nimbostratus phase, they do not need to be nucleated and grown
to precipitable size in the stratiform context itself. The history of three ice parti-
6.3 Nimbostratus Associated with Deep Convection
213
cles is indicated schematically in Fig. 6.11. Particle 1 is near the top of a convec-
tive cell at time
to (Fig. 6.11b).
It
has been formed at lower levels and grown to
precipitable size while being carried up to high levels by the strong convective
updraft in the cumulonimbus. When the convective updrafts weaken, the particle
begins to settle downward through the more gentle ascent in the upper levels of
the nimbostratus. By
to +
at,
it has reached a level midway between cloud top and
the melting level, as indicated in Fig. 6.11d. This point is directly below the
position of the particle at
to in the schematic, where the coordinate system moves
with the clouds and precipitation, and there is no vertical wind shear. In the
meantime, ice particle 2 has been generated in the new convection between
Band
C and has arrived at upper levels. When the convection between
Band
C weak-
ens, the second particle falls in the same manner as the first one. By time
to
+
2at,
it has fallen midway through the upper cloud within the region of newer nimbo-
stratus. Particle 1 meanwhile has fallen further and is located just above the
melting level at this time (Fig. 6.11f). Particle 3 has appeared at the top of the most
recent convection (between C and D) and will fall in a pattern similar to particles 2
and 3 when this region of convection weakens.
From the positions of particles 1, 2, and 3 in Fig. 6.11f, the relation of the deep
convection to the nimbostratus formed from the decay of a succession of groups
of cumulonimbus is clear. Precipitable-sized ice particles generated and carried
aloft in the updrafts of deep convective cells enter the nimbostratus at upper levels
and slowly settle downward in the upper layers of the nimbostratus until they
reach the melting level. Since we are ignoring any effects of wind shear, there is
no relative air motion across the cloud system, and the trajectory of each particle
is therefore vertically downward in the coordinate system moving with the cloud.
An entirely different way that the same picture as that shown in Fig. 6.11f can
be obtained is seen by changing our assumptions in two ways. First, suppose that
the convective region between C and D in Fig. 6.11 is in a steady state, rather than
the latest manifestation of a nonsteady succession of such regions, and has been in
this steady state for a while. Second, assume that there is vertical variation (i.e.,
shear) of the horizontal wind in the coordinate system moving with the storm.
Specifically, let the shear be such that there is airflow from left to right at upper
levels. In this case, the ice particles labeled 1, 2, and 3 can be regarded as
successive positions of the same particle, which is generated within the updraft of
the deep convection and subsequently advected horizontally rearward into the
nimbostratus cloud. The sloping trajectory from 1 to 2 to 3 is the combined result
of the horizontal relative air motion and the fall speed of the ice.
Whether the nimbostratus associated with deep convection evolves according
to the nonsteady/no-shear mode or the steady/sheared-cloud mode varies from
one meteorological context to another. In most if not all contexts, however, the
nimbostratus associated with convection can be understood in terms of the depic-
tion in Fig. 6.1lf, with the nimbostratus developing by either one or the other or
both of these modes. In some tropical mesoscale convective systems (Chapter 9),
the nonsteady/no-shear mode predominates. In hurricane eyewall regions (Chap-
ter 10), a steady/sheared-cloud mode predominates in conjunction with the steady
214 6 Nimbostratus
eyewall convection and shear of the radial and tangential wind components. In
certain types of "squall lines" (Chapter 9), a combination of the two modes is
operative. The nonsteady, successive regeneration of the convective region oc-
curs in the presence of shear. The result is that the ice particles in the nimbo-
stratus are partly introduced by successive decay of the old convective cells and
partly by shear.
There are at least two important special cases to recognize in connection with
the no-shear and sheared modes of nimbostratus associated with deep convection.
One of these special cases is a degenerate form of the nonsteady/no-shear mode.
This case occurs when the original group of convective cells (Fig. 6.11a and b)
does not regenerate, and the stratiform precipitation at time
to +
lit
is thus not
actually accompanied by new convection, as shown in Fig. 6.11b, but rather
appears as a region of pure nimbostratus, unaccompanied by convection.
It
should be remembered, though, that the particles falling from the nimbostratus in
this degenerate case were generated in the earlier convection, and the process
remains exactly the same as if the convection had regenerated and continued to be
present alongside the nimbostratus. The second special case worth noting occurs
in the sheared mode, when the horizontal relative flow at upper levels is especially
strong. In this situation, which arises sometimes in hurricanes, the stratiform and
convective regions of Fig.
6.1lfbecome
separated by a wide horizontal gap. Thus,
at first glance, the nimbostratus might appear to be isolated, when actually it is
connected with an upstream region of deep convection.
To examine nimbostratus associated with deep convection more quantitatively,
we consider the case in which the nimbostratus is associated with a squall-line
mesoscale system of the type we will consider in further detail in Chapter 9. A
schematic of the situation is shown in Fig. 6.12. The picture at upper levels is
similar to that in Fig. 6.1lf. The nimbostratus in this case is produced by a
combination of the nonsteady and sheared modes. There is vertical shear of the
horizontal wind such that the storm-relative wind at upper levels is directed
toward the stratiform region. However, at the same time, there is discrete regen-
eration of the convective region and successive incorporation of old weakened
convective elements into the nimbostratus. The old convective elements gradually
dissipate as they advected rearward into the stratiform region. They tend to
remain moderately active and give the region of mean ascent an embedded cellular
structure somewhat like that in Fig. 6.4.
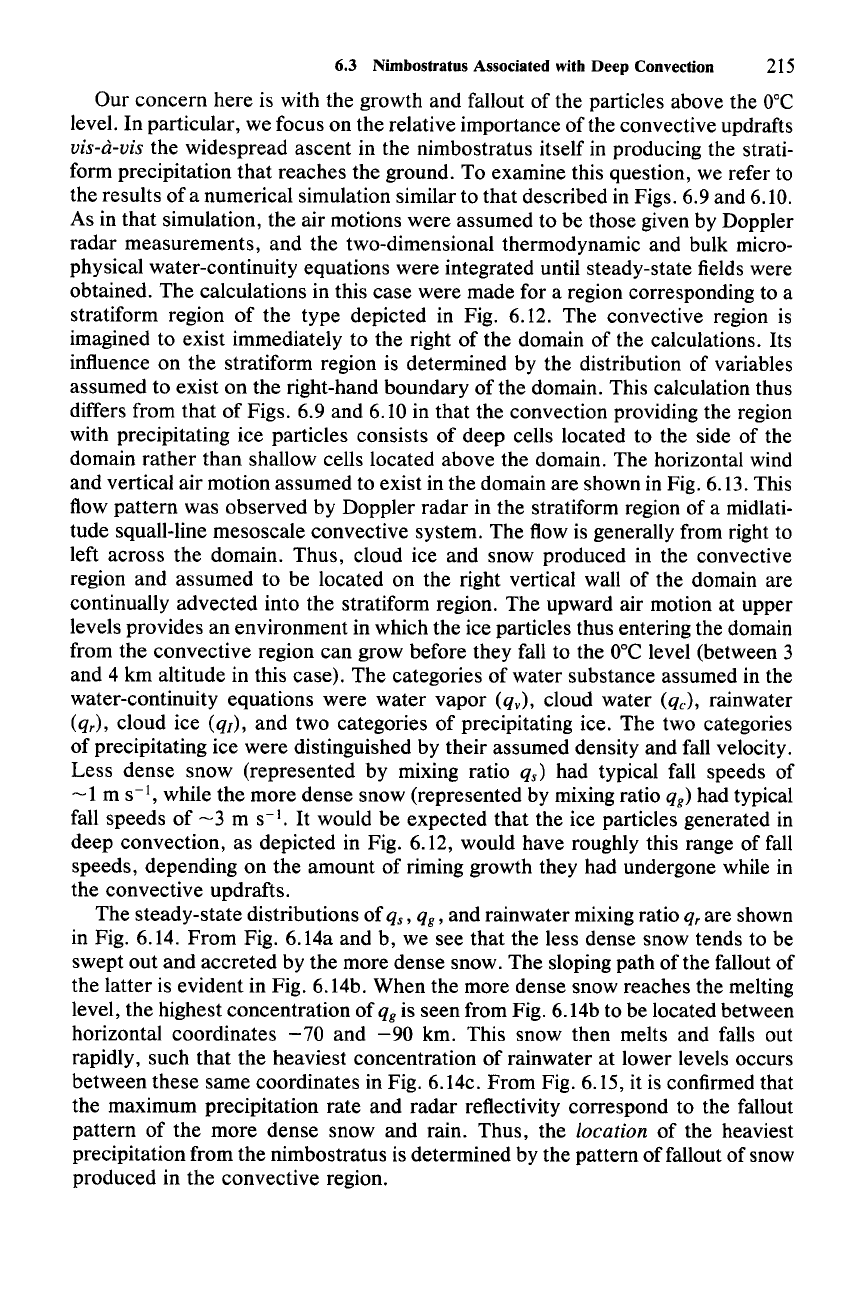
The ice particle trajectories in Fig. 6.12 are in the sense shown, and the primary
microphysical growth processes
ofthe
ice particles are indicated.
It
is emphasized
that the primary mechanism of growth of ice particles in the convective updrafts is
riming. After the particles are in the stratiform region, the dominant growth mech-
anism is vapor deposition, made possible by the widespread ascent at upper
levels. As the snow approaches the
O°C
level, aggregation produces larger parti-
cles but does not increase the total mass of the precipitation. In this layer (0 to
-12°C), riming may also contribute to the growth of the particles. After the
particles melt, they fall through a layer of subsiding air, whose origin will be
discussed in Chapter 9. The raindrops evaporate partially as they fall through this
lower layer.
6.3 Nimbostratus Associated with Deep Convection
215
Our concern here is with the growth and fallout of the particles above the
oce
level. In particular, we focus on the relative importance of the convective updrafts
vis-a-vis the widespread ascent in the nimbostratus itself in producing the strati-
form precipitation that reaches the ground. To examine this question, we refer to
the results of a numerical simulation similar to that described in Figs. 6.9 and 6.10.
As in that simulation, the air motions were assumed to be those given by Doppler
radar measurements, and the two-dimensional thermodynamic and bulk micro-
physical water-continuity equations were integrated until steady-state fields were
obtained. The calculations in this case were made for a region corresponding to a
stratiform region of the type depicted in Fig. 6.12. The convective region is
imagined to exist immediately to the right of the domain of the calculations. Its
influence on the stratiform region is determined by the distribution of variables
assumed to exist on the right-hand boundary of the domain. This calculation thus
differs from that of Figs. 6.9 and 6.10 in that the convection providing the region
with precipitating ice particles consists of deep cells located to the side of the
domain rather than shallow cells located above the domain. The horizontal wind
and vertical air motion assumed to exist in the domain are shown in Fig. 6.13. This
flow pattern was observed by Doppler radar in the stratiform region of a midlati-
tude squall-line mesoscale convective system. The flow is generally from right to
left across the domain. Thus, cloud ice and snow produced in the convective
region and assumed to be located on the right vertical wall of the domain are
continually advected into the stratiform region. The upward air motion at upper
levels provides an environment in which the ice particles thus entering the domain
from the convective region can grow before they fall to the
ooe
level (between 3
and 4 km altitude in this case). The categories of water substance assumed in the
water-continuity equations were water vapor
(qv), cloud water (qc), rainwater
(qr), cloud ice
(q/),
and two categories of precipitating ice. The two categories
of precipitating ice were distinguished by their assumed density and fall velocity.
Less dense snow (represented by mixing ratio
qs) had typical fall speeds of
~1
m
S-I,
while the more dense snow (represented by mixing ratio qg) had typical
fall speeds of
~3
m
S-I.
It would be expected that the ice particles generated in
deep convection, as depicted in Fig. 6.12, would have roughly this range of fall
speeds, depending on the amount of riming growth they had undergone while in
the convective updrafts.
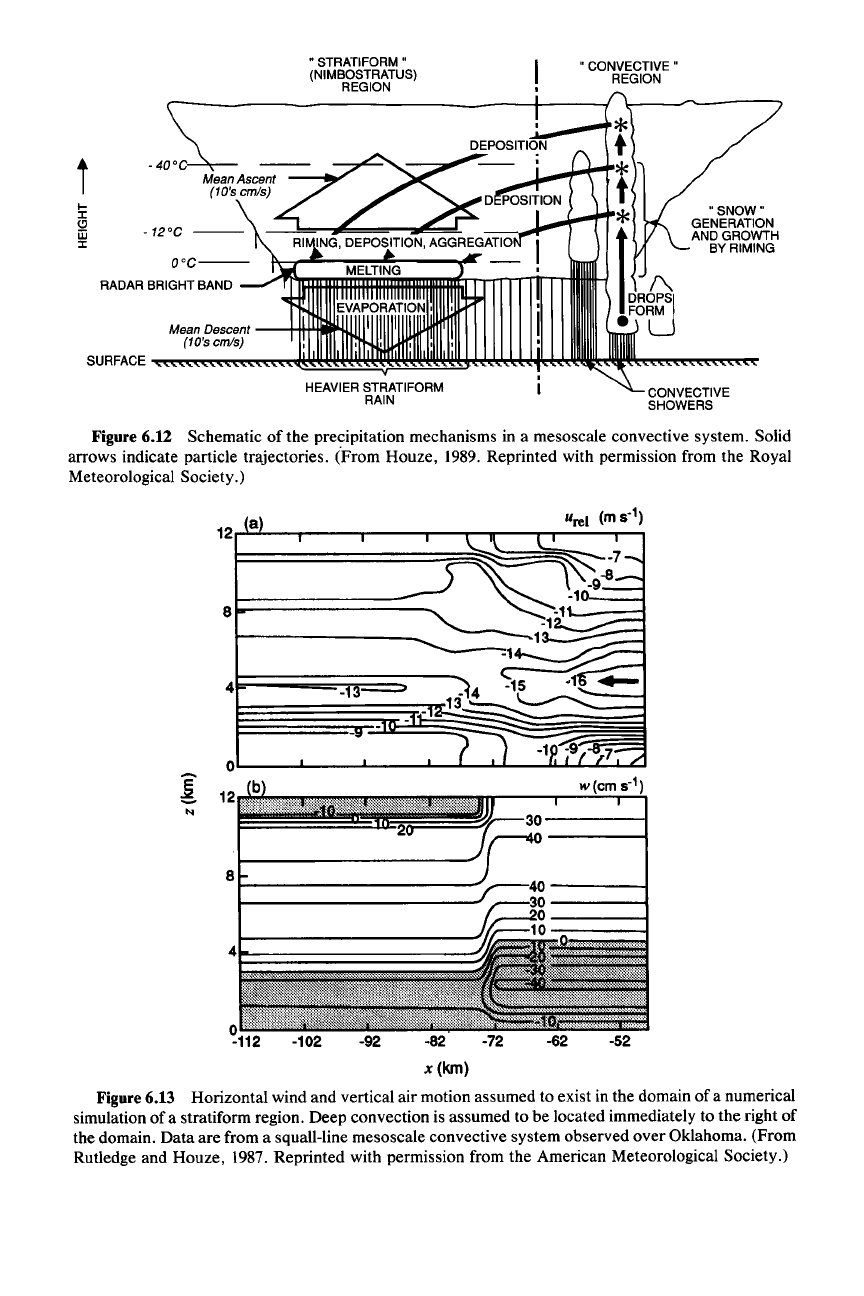
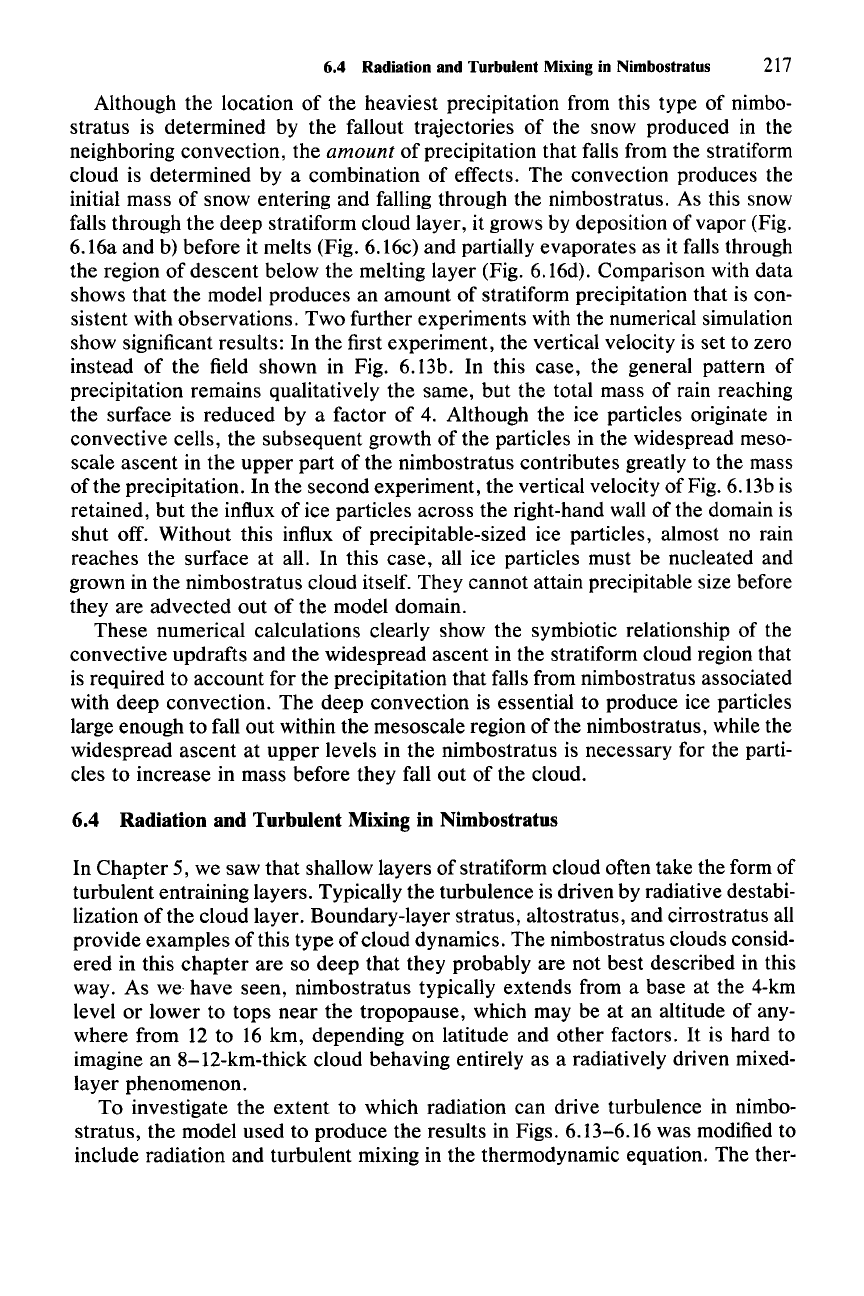
The steady-state distributions of
qs, qg, and rainwater mixing ratio qr are shown
in Fig. 6.14. From Fig. 6.14a and b, we see that the less dense snow tends to be
swept out and accreted by the more dense snow. The sloping path of the fallout of
the latter is evident in Fig. 6.14b. When the more dense snow reaches the melting
level, the highest concentration of
qg is seen from Fig. 6.14b to be located between
horizontal coordinates
-70
and
-90
km. This snow then melts and falls out
rapidly, such that the heaviest concentration of rainwater at lower levels occurs
between these same coordinates in Fig. 6.14c. From Fig. 6.15, it is confirmed that
the maximum precipitation rate and radar reflectivity correspond to the fallout
pattern of the more dense snow and rain. Thus, the
location of the heaviest
precipitation from the nimbostratus is determined by the pattern of fallout of snow
produced in the convective region.
" STRATIFORM"
(NIMBOSTRATUS)
REGION
" CONVECTIVE"
REGION
t
-40'0
0'0---
RADAR BRIGHT BAND
Mean Descent
(10'5 Cm/S)
"SNOW"
GENERATION
AND GROWTH
BY RIMING
CONVECTIVE
SHOWERS
Figure 6.12 Schematic of the precipitation mechanisms in a mesoscale convective system. Solid
arrows indicate particle trajectories. (From Houze,
1989. Reprinted with permission from the Royal
Meteorological Society.)
-52
-62-72
-92
-13
-102
4r=============~
2
8t-
_
OL.-_---JL...-_--'-
__
---L_.L-
........
.L-_..LL.J"-L....L-
........U
b
12
hTNn:
a~W~):~W~~:~~~t~lm::~;.l::::::~t~~~~:~~:~:Btk~~f~~~it~~tt~f:f'
..
12 a
-82
x(km)
Figure 6.13 Horizontal wind and vertical air motion assumed to exist in the domain of a numerical
simulation of a stratiform region. Deep convection is assumed to be located immediately to the right of
the domain. Data are from a squall-line mesoscale convective system observed
over
Oklahoma. (From
Rutledge and Houze,
1987. Reprinted with permission from the American Meteorological Society.)
6.4 Radiation and Turbulent Mixing in Nimbostratus
217
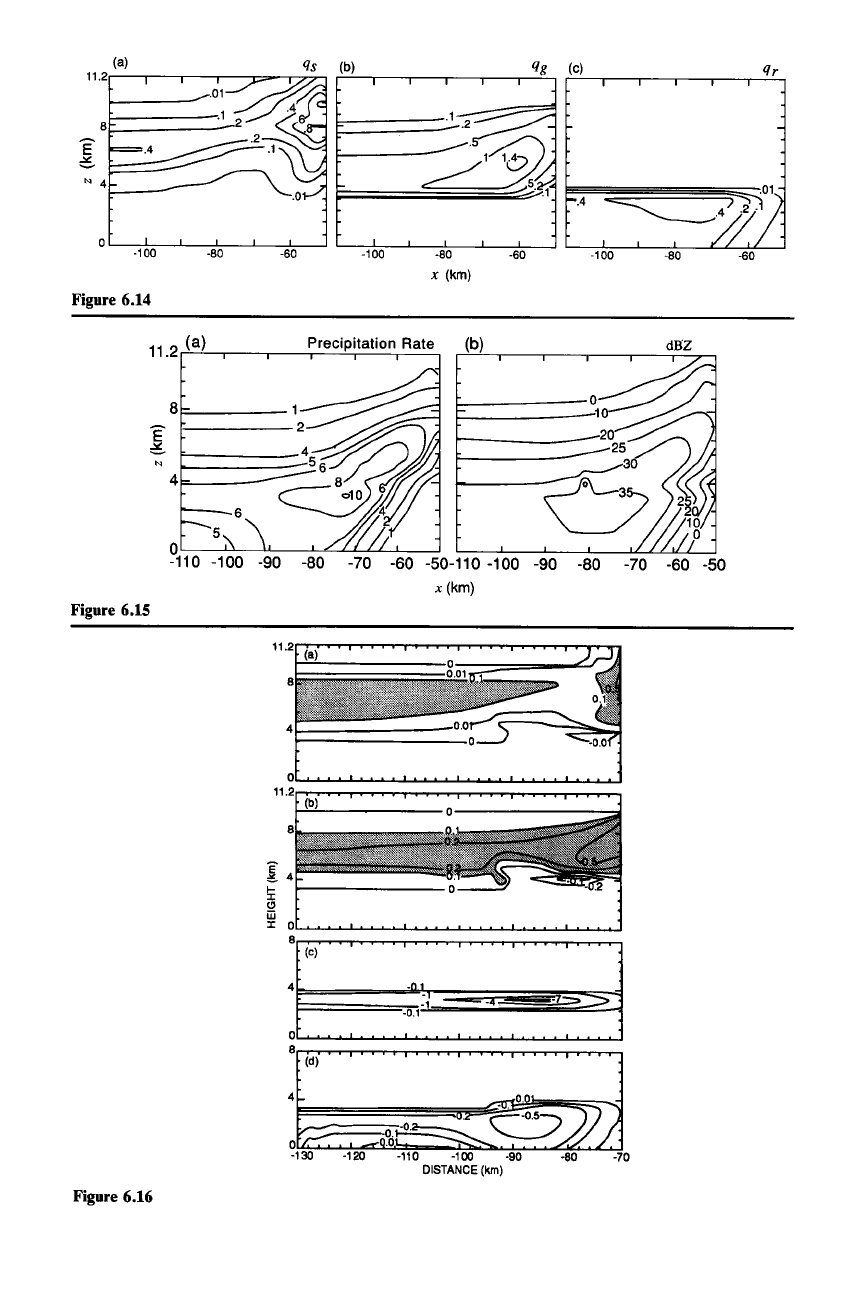
Although the location of the heaviest precipitation from this type of nimbo-
stratus is determined by the fallout trajectories of the snow produced in the
neighboring convection, the
amount
of precipitation that falls from the stratiform
cloud is determined by a combination of effects. The convection produces the
initial mass of snow entering and falling through the nimbostratus. As this snow
falls through the deep stratiform cloud layer, it grows by deposition of vapor (Fig.
6.l6a
and b) before it melts (Fig. 6.l6c) and partially evaporates as it falls through
the region of descent below the melting layer (Fig. 6.l6d). Comparison with data
shows that the model produces an amount of stratiform precipitation that is con-
sistent with observations. Two further experiments with the numerical simulation
show significant results: In the first experiment, the vertical velocity is set to zero
instead of the field shown in Fig. 6.13b. In this case, the general pattern of
precipitation remains qualitatively the same, but the total mass of rain reaching
the surface is reduced by a factor of 4. Although the ice particles originate in
convective cells, the subsequent growth of the particles in the widespread meso-
scale ascent in the upper part of the nimbostratus contributes greatly to the mass
ofthe
precipitation. In the second experiment, the vertical velocity of Fig. 6.13b is
retained, but the influx of ice particles across the right-hand wall of the domain is
shut off. Without this influx of precipitable-sized ice particles, almost no rain
reaches the surface at all. In this case, all ice particles must be nucleated and
grown in the nimbostratus cloud itself. They cannot attain precipitable size before
they are advected out of the model domain.
These numerical calculations clearly show the symbiotic relationship of the
convective updrafts and the widespread ascent in the stratiform cloud region that
is required to account for the precipitation that falls from nimbostratus associated
with deep convection. The deep convection is essential to produce ice particles
large enough to fall
out
within the mesoscale region of the nimbostratus, while the
widespread ascent at upper levels in the nimbostratus is necessary for the parti-
cles to increase in mass before they fall out of the cloud.
6.4 Radiation and Turbulent Mixing in Nimbostratus
In Chapter 5, we saw that shallow layers of stratiform cloud often take the form of
turbulent entraining layers. Typically the turbulence is driven by radiative destabi-
lization
ofthe
cloud layer. Boundary-layer stratus, altostratus, and cirrostratus all
provide examples of this type of cloud dynamics. The nimbostratus clouds consid-
ered in this chapter are so deep that they probably are not best described in this
way. As we have seen, nimbostratus typically extends from a base at the 4-km
level or lower to tops near the tropopause, which may be at an altitude of any-
where from 12 to 16 km, depending on latitude and other factors.
It
is hard to
imagine an 8-12-km-thick cloud behaving entirely as a radiatively driven mixed-
layer phenomenon.
To investigate the extent to which radiation can drive turbulence in nimbo-
stratus, the model used to produce the results in Figs. 6.13-6.16 was modified to
include radiation and turbulent mixing in the thermodynamic equation. The ther-
N
4c-_---
-100 -80 -60 -100 -80 -60
-100 -80
x (km)
Figure 6.14
11.2 (a)
Precipitation Rate
(b)
8
E
~
N
4
5
0
-110
-100 -90 -80
-70 -60 -50-110 -100 -90
-80
-70 -60
-50
x (km)
Figure 6.15
}'l::,,"
;;,'1,
;
:;~.;;
.~~
:~~2J
-130 -120 -110 -100 ·90 -80 -70
DISTANCE
(km)
Figure 6.16