International Commission on Large Dams (ICOLD) - The Physical Properties of Hardened Conventional concrete in Dams
Подождите немного. Документ загружается.


ICOLD Bulletin: The Physical Properties of Hardened Conventional Concrete in Dams
Section 2 (Strength properties)
As submitted for ICOLD review, march 2008 Section 2-15
Tab. 2.6 shows long-term core strengths from Austrian dams:
Tab. 2.6 – Core strength from Austrian dams [2.21]
Dam Age of
core in
years
Core
strength (φ
200 mm)
[MPa]
90 day’s
cube
strength
[MPa]
Schlegeis 12 32.0 20.0
Drossen 26 40.3 20.4
Mooser 26 41.1 20.4
Limberg 32 44.5 31.0
From Italian dams, more readily available [2.22] are ratios between 90 and 180 days
strength. Some are reported on Tab. 2.7:
Tab. 2.7 – Core strength from Italian dams [2.22]
Dam Strength 90 days
[MPa]
Strength 180 days
[MPa]
Strength ratio
180/90
Cignana n.1 15,2 16,2 1,06
Suviana 13,6 14,5 1,06
Goillet 15,7 20,3 1,29
Santa Giustina 44,1 46,6 1,06
Pian Telessio 28,7 30,4 1,06
Campo Moro n.1 37,3 40,8 1,09
Valle di Lei 41,7 44,2 1,06
ICOLD Bulletin: The Physical Properties of Hardened Conventional Concrete in Dams
Section 2 (Strength properties)
As submitted for ICOLD review, march 2008 Section 2-16
2.2.4 Test Equipment
The type of the testing machine (press) may have an effect on the obtained results.
These machines are classified as hard (rigid) and soft (less rigid) depending how the
head of the machine is following the deformation of the specimen. In a hard machine
the head has difficulties to follow rapid deformations; in a soft machine it will follow
without delay. The consequence is that in a soft machine the energy stored in the
machine is released and acts on the specimen when it starts to fail. This additional
energy will cause more extensive crack propagation and indicate failure at lower loads
than with a hard machine. In a stress-strain diagram this will result in lower peak stress
for a soft as compared to a hard machine.
Loading range of the testing machine shall not exceed 90 % of the maximum range
capacity applied during the verification test. Furthermore, in order to improve the
reliability of measured values a minimum level of 20% is preferable, as for example set
by the Japanese Industrial Standards (JIS). During the test, the compressive load
induces lateral tensile strains in both, the steel platens and the concrete specimen, due
to Poisson effect. The mismatch between the elastic modules of steel and concrete and
the friction between the two, results in lateral restraint forces in the concrete near the
platen. The concrete specimen is therefore locally in a triaxial stress state, with the
consequent effect on strength. This effect is larger for cubes and smaller for cylinders
or prisms.
Most compressive test machines in field laboratories are not free from friction between
specimen and platen. This restrains the lateral end-expansion of the specimens and
introduces shear stresses, demonstrated by a shear-type failure pattern. This end-effect
results in a higher strength than for specimen which are exposed to pure compression
(failure pattern parallel cracks). The effect is more pronounced for specimens with
lower l/d-ratios and it is also the reason why cube strength is higher than cylinder
strength.
Test machines should therefore be low in frictional resistance between platen and
specimen.
2.2.5 Evaluation of Strength Testing
Strength parameters of a composite material like concrete can never be defined without
uncertainty. Strength follows a statistical distribution and is not a deterministic value.
The factors contributing to variability are concrete constituents, production, testing and
ageing.
The literature of concrete testing has therefore developed a host of theories and
methodologies to evaluate scatter of test results and its application for dam concrete.
They are not discussed here. The reader is encouraged to consult the numerous
publications, among them the Bureau's of Reclamation Concrete Manual [2.4], ACI 214
[2.23], the corresponding ISO Standards 2859 [2.24], 3951 [2.25] and 5479 [2.26], CEB
– FIP Model Code [2.27] and reference [2.28].
Some particularities with respect to dam concrete testing are added.
• One is related to the strength gain with age. As mentioned, for dams the
characteristic age should be 180 days or, for larger dams (longer construction), one
year. This means that one-year strength data should be available when concrete
ICOLD Bulletin: The Physical Properties of Hardened Conventional Concrete in Dams
Section 2 (Strength properties)
As submitted for ICOLD review, march 2008 Section 2-17
placement starts. This is not always possible. In order to overcome the impasse, it is
often decided to take 28/90 day as characteristic strength or to conservatively
extrapolate these early strength data. In most cases, such decisions lead to
excessive cement content, which is uneconomic and, as aside effect, contributes to
unfavourable thermal conditions. Of course, the obvious remedy is to start early with
concrete testing. However, this needs planning, discipline and is often not done
because of unknown final concrete constituents.
However the characteristic age have to be always related to the specific dam under
examination, taking into account the scale of the structure and the times of
construction and service life.
This Bulletin would like to encourage the dam profession to also view the problem
from a more pragmatic standpoint. Research, published data from case histories,
and preliminary series with similar than the final mix design from the dam in question
provide a host of strength-gain values to judge strength gain up to the age of the
characteristic strength. Certainly, such a judgement has to be accompanied by
assessing the consequences of an anticipated error between assessed and later
measured characteristic strength: What, if the required strength is not met? Are the
stipulated factors of safety (FS) still acceptable? But: isn't FS=3 just an arbitrary
chosen number and FS=2.8 also acceptable? Can a local redistribution of stresses
be assumed beneficial in mitigating a lacking safety margin? How much is the gain
of strength between one year and the age when the calculated stresses are really
occur, e.g. during extreme temperatures, floods or an earthquake?
In many cases the limiting strength is not compression but shear or tension, mostly
along local zones, and shear/tensile strength is generally taken as a percentage of
compressive strength, not measured per se. This percentage is highly speculative
(particularly for dynamic loading) and uncertain in a similar order of magnitude than
speculating a particular strength gain between 90 days and one year.
What this all means is that engineering judgement and peer review, based on an
increasing data-base, often is a remedy to justify acceptance of uncertainties. This
can be beneficial for economy and safety. The shortcut of immediate conservative
solutions is not necessarily the only safe way to go.
• Evaluating strength data, the most common design criterion, is based on the
following formula [2.23]:
f
m
= f
c
+
k.σ
f
m
the mean required strength for which the mix has to be
designed
f
c
the characteristic strength (specified design strength to meet
required safety against stresses)
k a factor derived from the assumed strength distribution
which depends on a stipulated proportion of tests (fractile)
to fall below the level of f
c
, and on the number of tests carried out.
σ standard deviation of strength test series
The k-factor is derived from fractiles of a Normal distribution. Commonly used k
values (for high number of tests, generally n≥30) are reported in Tab. 2.8.

ICOLD Bulletin: The Physical Properties of Hardened Conventional Concrete in Dams
Section 2 (Strength properties)
As submitted for ICOLD review, march 2008 Section 2-18
Tab. 2.8 – Examples of k values
Percentage of tests
falling outside the
limits ± k.σ
σσ
σ
Percentage of tests
falling below fc
(fractile in %)
Chances of tests
falling below the
lower limit
k
20 10 1 in 10 1.28
10 5 1 in 20 1.65
5 2.5 1 in 40 1.96
2 1 1 in 100 2.33
When comparing laboratory with core strength, the choice of k should be different
for both types of tests because of the larger inherent variability of the latter. The
procedure have also to be adapted, in the case of concrete strength evaluation from
cores of existing structures.
• For statistical evaluation bounded or curtailed distributions (instead of an
unbounded Normal distribution) are actually the correct choice because they
represent more realistically the physics of statistical scatter. Although most codes
still refer to Normal distributions there is a tendency for a change [2.29] as the
influence on reliability indices, and thus on safety factors, is considerable [2.30].
• Reporting and archiving of test results is essential. Dams may show signs of
distress years and decades after construction. Then, resorting to test documents,
fallen into oblivion, should succeed to finding information about test conditions,
sources of constituents, details of the mix design, number of samples, the variability
of test results and the like.
2.2.6 Generic Uncertainty in Test Procedures
As mentioned previously, in setting up test programs one needs to first assess the
impact of a parameter on safety and its costs of testing and then decide if testing is
meaningful or if it suffices to rely on published values.
In a similar way goes the decision about the impact of parameters, which are
cumbersome to be tested or which are commonly not tested at all although their
influence of strength is significant.
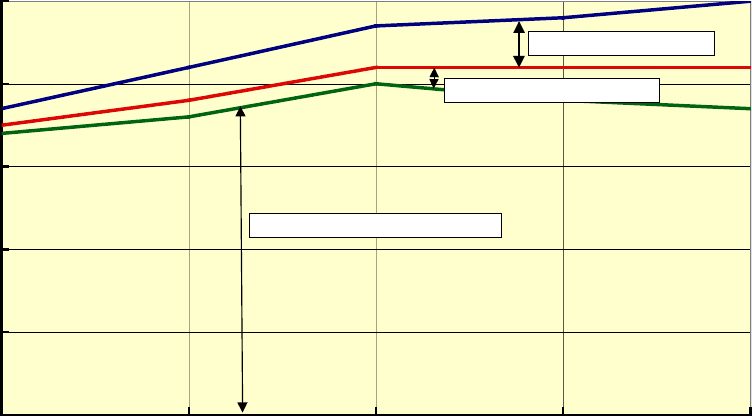
An example is the water-cement ratio (w/c ratio). In mass concrete field testing the w/c
ratio is, for good reasons, not measured. This is unfortunate, because its share on the
standard deviation for compressive strength is considerable (Fig. 2.4) and, were it
measured, the scatter of compressive strength could certainly be reduced [2.31].
ICOLD Bulletin: The Physical Properties of Hardened Conventional Concrete in Dams
Section 2 (Strength properties)
As submitted for ICOLD review, march 2008 Section 2-19
0,0
1,0
2,0
3,0
4,0
5,0
10 20 30 40 50
Compressive strength in MPa
Std. dev. in MPa
Share of test variation
Share of cement variation
Share of variation of W/C ratio
Fig. 2.4 - Shares of standard deviation during testing of compressive
strength: above without and below with control of w/c ratio [2.31]
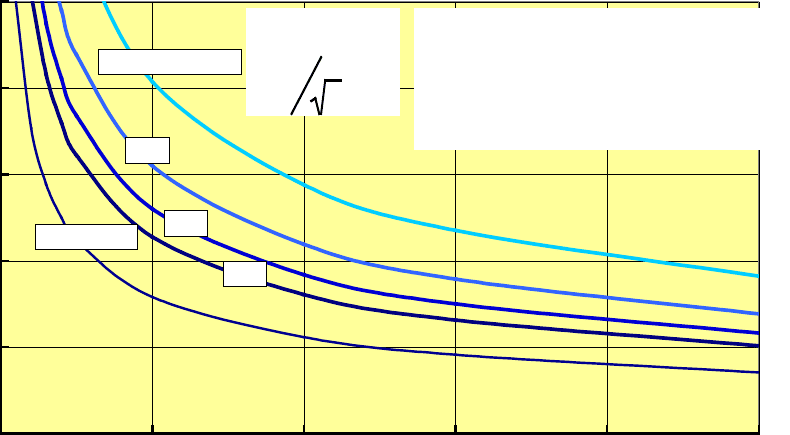
Then, there is the dichotomy of simple tests with high repeatability as against
complicated tests with high dependability. The first have their limitations in the declining
statistical effectiveness with increasing sample size (Fig. 2.5), the second are delicate
to execute and evaluate.
An example is the decision either to assess tensile strength from formulas relating
tensile to compressive strength or to rely on the more delicate (pure) tensile strength
testing. The latter, if carefully executed more closely approaches reality, however, with
the impediment of high scatter if n is small. Here, the conflict ensues either having to
deal with a high uncertainty of the mean value (formula-based assessment) or with a
high scatter around a more reliable mean (tensile testing). Certainly, the latter is
preferable. It is therefore suggested to incorporate tensile testing in the technical
specifications.
What this all means is that the true strength in the dam is a random variable affected by
many influencing factors, conditions and testing traditions. Any tested strength value
has therefore to be recognized as an interpreted estimate of the unknown true strength.
ICOLD Bulletin: The Physical Properties of Hardened Conventional Concrete in Dams
Section 2 (Strength properties)
As submitted for ICOLD review, march 2008 Section 2-20
0,0
0,2
0,4
0,6
0,8
1,0
0 10 20 30 40 50
Number of tests, n
Multiplier of std. deviation, m
€
f
t
= f
mean
+
σ
.m
m=
t
n
85%
95%
90%
99% confidence
50%(mean)
f
t
… strength of corresponding confidence limit
σ
σσ
σ
… std. deviation
t … constant depending on the required
confidence limit
n … number of tests/samples
m … multiplier of std. deviation
Fig. 2.5 - Reduction of uncertainty with increasing numbers of sampling
(inverse proportional to √n)
2.3 COMPRESSIVE STRENGTH
Compressive strength is the predominant property for dam concrete. Concrete dams
are designed to carry compressive stresses and to minimize tensile stresses. As
discussed in the following, compressive strength is influenced by a wealth of conditions
of fresh concrete, its placement and curing.
2.3.1 Effects of porosity and w/c-ratio on concrete strength
The strength of ordinary concrete is governed by the porosity of the cement paste,
which in turn depends on the water/cement ratio and on the degree of hydration. It is
primarily the porosity of the transition zone between the cement paste and the
aggregate, which influences strength, because this zone (about 50 µm wide) is the
weakest link in the matrix, as cracking initiates within it. Porosity and degree of
hydration have a fundamental relation to strength of concrete, but they are not easy to
measure. Hence, for practical engineering applications, these parameters are replaced
by the free water/cement ratio and the age of concrete when relating them to strength
measurement. Typical relations between the water/cement ratios for an age of 28 days,
using several theoretical formula and empirical evaluations are shown in Fig. 2.6.
For dam concrete w/c ratios are rarely specified and are predominantly determined
experimentally to achieve satisfactory workability. In this context, advantage is taken to
reduce the w/c-ratio by the use of water-reducing and plasticizing admixtures. The
ICOLD Bulletin: The Physical Properties of Hardened Conventional Concrete in Dams
Section 2 (Strength properties)
As submitted for ICOLD review, march 2008 Section 2-21
curves in Fig. 2.6 can be interpreted in this sense: the range with lower w/c ratios is
mainly for concrete in more recent dams where admixtures are more widely used,
whereby the higher w/c ratios are typical for older dams where admixtures are limited to
an air entraining agent.
One needs to recognise the beneficial effect of water-reducing, plasticizing or
superplasticizing agents as a potential means to reduce the water content in the mix.
To lower the water content has several advantages. Besides the basic goal of higher
strength (at equal content of cementitious material), these are a reduced permeability
and thus higher durability (less porosity of the hydrated cement paste), less shrinkage
and thus less shrinkage cracking and, if ice is used for cooling, a reduced peak
temperature and thus less thermal cracking.
0
10
20
30
40
50
60
70
0.3 0.4 0.5 0.6 0.7 0.8 0.9
w/c ratio
Abrams Swiss 1 Swiss 2 PCAmax PCAmin ACI 211 Popovics
Constant:
Age 28 days
Sample size 6"x12" (15x30cm) cylinders
Air entrained concrete
OPC (no blended cement)
Abrams: f
c
= 100/4
1.5
.w/c
Swiss 1: f
c
= 0.6(72-60.w/c), Ref.[2.32]
Swiss 2: f
c
= 0.6(84-72.w/c), Ref.[2.32]
PCA(max/min) see Ref. [2.20]
ACI see Ref. [2.33]
Popovics: equ.14 in [2.34] with
200kg/m
3
cement and 4% air
Fig. 2.6 – Compressive Strength vs water/cement ratio.
With respect to the denominator of the w/c-ratio, it is now common practice to use the
term "water-cementitious material ratio, (w/cm)", a clumsy term, however appropriate
because it makes sure that the denominator also includes all cementitious ingredients
such as fly ash, slag, pozzolans, or the like, which participate in strength development
together with Ordinary Portland Cement OPC.
French standards use the expression "liant équivalent" and even provide a factored
coefficient for “cm” which considers the amount of strength participation of cementitious
ingredients (e.g. by means of its pozzolanic activity index) [2.35].
ICOLD Bulletin: The Physical Properties of Hardened Conventional Concrete in Dams
Section 2 (Strength properties)
As submitted for ICOLD review, march 2008 Section 2-22
2.3.2 Effects of maximum size of aggregate (MSA)
For the main mass of interior concrete a MSA between 120 mm and 150 mm is
commonly used (80 mm for older dams). Larger or lower sizes are the exception for
large dams.
This rather small range is the result of a long lasting experience balancing to reduce
cement content and to achieve a good workability. The larger the aggregate size the
less cement is required for a given volume of concrete to produce enough cement
paste necessary to cover the aggregate surface.
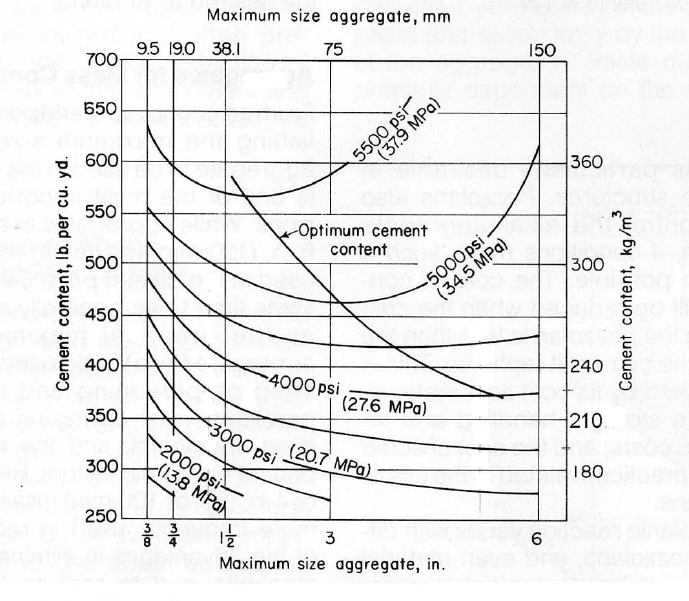
To achieve the greatest cement efficiency, an optimum maximum size for each
compressive strength level has to be obtained with a given MSA and cement content,
as shown in Fig. 2.7. The results in [2.36] are from test series for Grand Coulee and
Clear Creek dams by the Bureau of Reclamation (USA). For modern dams, however,
only the lower third of Fig. 2.7 is applicable because cement content rarely exceeds,
say, 250 kg/m
3
. Given the low gradient of the curves in the lower part of Fig. 2.7 and the
large scatter band of the Bureau's test series (not shown), the shown relations may
differ from dam to dam. Other investigations confirm the low gradients for cement
contents below 250 kg/m
3
[2.37].
Fig. 2.7 – Effect on Maximum Size Aggregates on Cement Content [2.36]
ICOLD Bulletin: The Physical Properties of Hardened Conventional Concrete in Dams
Section 2 (Strength properties)
As submitted for ICOLD review, march 2008 Section 2-23
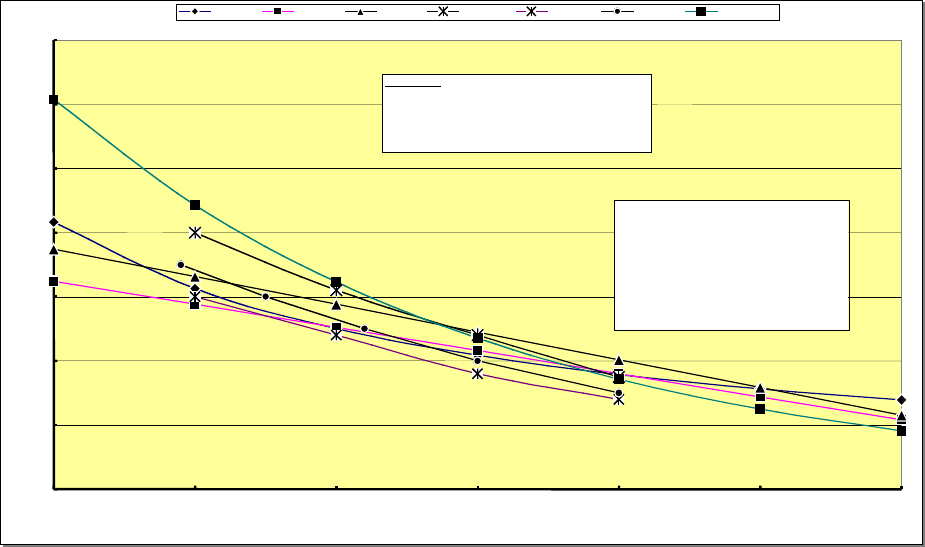
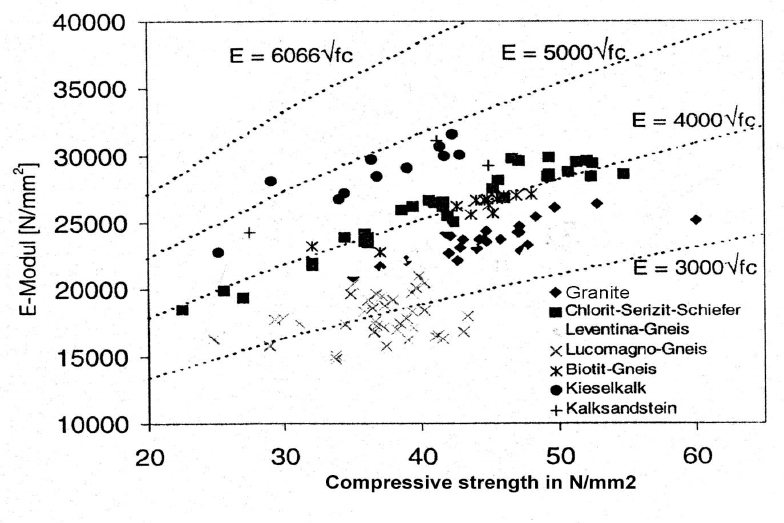
2.3.3 Effects of aggregate properties
Compressive strength is governed by the strength of the aggregates and their water
requirement for satisfactory workability. This influence can be large.
Lets take an example: reducing the MSA from 6" to 3" for a 200 kg/m
3
cement content
would – according to Fig. 2.7 - reduce the strength by roughly 5 MPa. The difference
between, say sandstone and limestone as source of aggregates can be in the same
range, even more, as shown in the examples of Fig. 2.8.
Due to the fact that aggregates of marginal qualification are used now more frequently,
e.g. for small gravity dams with a low stress level, to know the influence of aggregate
quality becomes increasingly important.
Fig. 2.8 – Compressive strength vs type of aggregates [2.38]
Essential for the acceptance of marginal aggregates is an extensive test program of
both the aggregate parameters and then the concrete.
A common detrimental constituent in the aggregates is schist, i.e. rocks with high mica
content. Austrian experience is that the content of schist in the sand fraction (0 to 4mm)
should be kept low, say less than 5 %. Experiments demonstrated that an increase of
schist by 10% in the sand required an increase of 0.05 in the w/c-ratio for equal
workability which, in turn, reduced the compressive strength by 12%. Aggregates with
15% content of schist for the concrete of the Kölnbrein dam resulted in an 18%
decrease of compressive strength as compared to aggregates free of schist [2.39].
ICOLD Bulletin: The Physical Properties of Hardened Conventional Concrete in Dams
Section 2 (Strength properties)
As submitted for ICOLD review, march 2008 Section 2-24
2.3.4 Effects of curing
Here we have to distinguish between curing of test specimens and curing during dam
construction.
Curing of test specimens is well defined in standards, e.g. in ACI 308 [2.40] or [2.4].
Given the many factors influencing strength results, strict adherence to curing as
stipulated in standardized test methods is mandatory in order not to add another source
of uncertainty.
Curing at site is unfortunately often taken less serious than laboratory curing.
It is essential for large dam projects that the contractor provides a fairly uniform product
with a specified strength of reasonable scatter as confirmed by periodic testing.
However, as soon as the product of this mechanized process leaves the mixer and is
placed, its stipulated quality and uniformity is at risk being impaired by deficient curing,
which is still labour intensive and therefore prone to lack of care. Dry dam and block
surfaces are a common view at construction sites although simple sprinkler devices
(such as hoses with holes) are easy to install and to operate. It is a pure matter of
discipline and site supervision to overcome this simple problem.
Curing requirements are treated in ICOLD Bulletins n° 47 (Quality Control of Concrete),
n° 76 (Conventional Methods in Dam Construction) and a recent Bulletin under
publication on “The Specification and Quality Control of Concrete for Dams”. This
Section therefore only covers some additional aspects to what is said in the above two
Bulletins.
Interrupted curing will largely affect the compressive strength development as indicated
by the test results of Fig. 2.9 (from [2.4] and [2.41]). Such test would seem to simulate
inadequate dam curing, generally caused by intermittent or no moistening of lift and
block surfaces.
Reference [2.41] reports of test results on 100x200mm cylinders comparing:
• exposure to environmental conditions (23,0°C+40% RH) for 1 day and fog room
curing for 7 days thereafter (23,0°C+95% RH), and
• exposure to environmental conditions throughout (no fog room exposure).
The loss of 28-days compressive strength for 7 types of concrete (with Ordinary
Portland Cement and blended cements) between the two curing conditions was
between 10% and 40%, the higher loss being for blended (fly ash) concrete.
One may argue now that for dam concrete such a loss of strength is less significant
than for structural concrete due to its limited impact on a large mass. However, what
counts is that the impact of inadequate curing hits the dam at the joints, its weakest
links. A loss of compressive strength also means a loss of shear and tensile strength at
lift joints. Lift joints are discontinuities in the concrete mass and they are exposed to
high temperature difference, prone to thermal cracking, and occasionally also exposed
to uplift. Therefore a loss of strength at this particular location can be particularly
detrimental for structural integrity and water tightness.
For the Zillergründl dam in Austria, a curing compound was successfully sprayed on the
lift surfaces, immediately after pouring, or after removing the formwork. This also
enhances adhesion between lifts.