Jackson S.L. Research Methods and Statistics: A Critical Thinking Approach
Подождите немного. Документ загружается.


372
■ ■
CHAPTER 14
Figure Caption
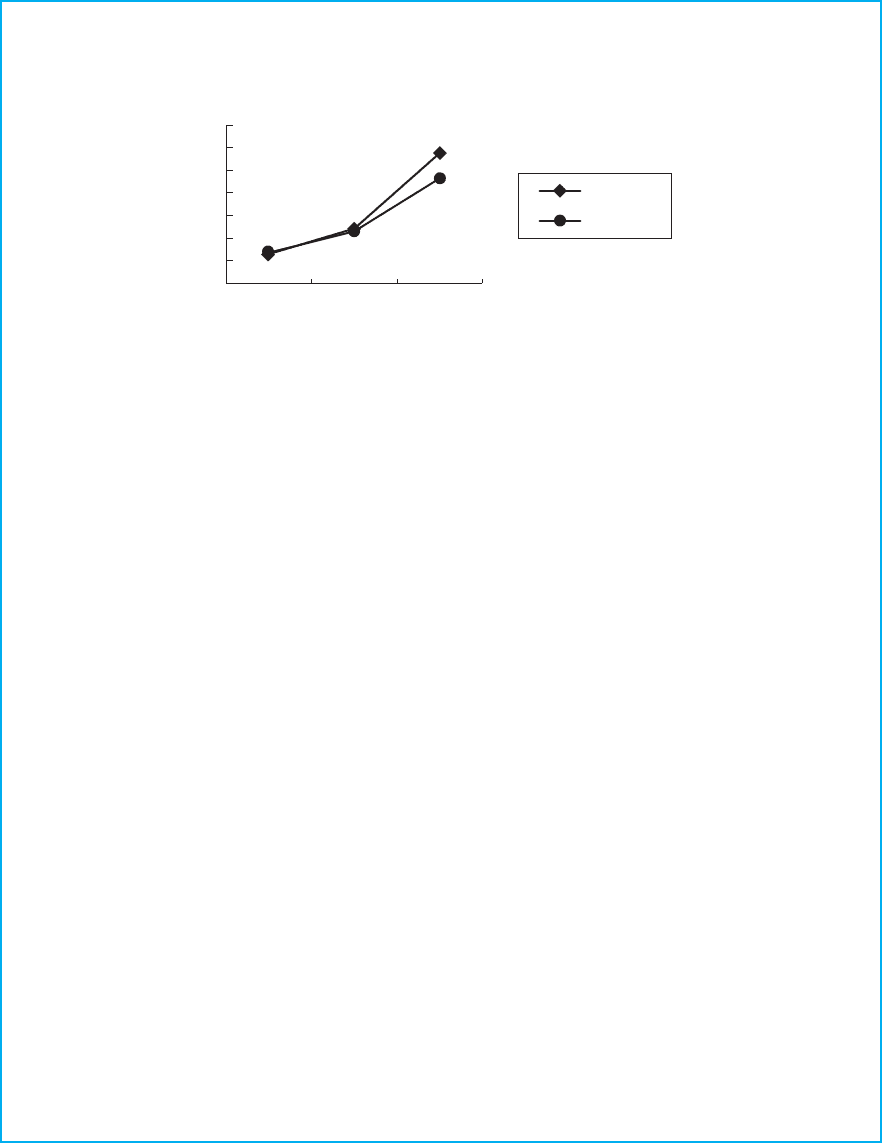
Figure 1. Mean rating of male and female participants for each condition
($20,000 $60,000, $100,000) on focus question (“How willing would you be
to go on a date with this person?”).
Effects of Salary 15
10017_14_ch14_p357-373.indd 372 2/1/08 1:37:59 PM
APA Sample Manuscript
■ ■
373
$100,000$60,000$20,000
Mean Rating of Focus
Question
Salar
y
Level
Women
Men
0
1
2
3
4
5
6
7
10017_14_ch14_p357-373.indd 373 2/1/08 1:38:00 PM

374
Statistical Tables
APPENDIX
A
A.1 Random Numbers
A.2 Areas Under the Normal Curve (z Table)
A.3 Critical Values for the Student’s t Distribution
A.4 Critical Values for the
2
Distribution
A.5 Critical Values of the Pearson r (Pearson Product-Moment
Correlation Coefficient)
A.6 Critical Values for W (Wilcoxon Rank-Sum Test)
A.7 Critical Values for the Wilcoxon Matched-Pairs Signed-Ranks
T Test
A.8 Critical Values for the F Distribution
A.9 Studentized Range Statistic
10017_15_appendixA.indd 374 2/1/08 1:39:04 PM

Statistical Tables
■ ■
375
10017_15_appendixA.indd 375 2/1/08 1:39:05 PM
Text not available due to copyright restrictions

376
■ ■
APPENDIX A
10017_15_appendixA.indd 376 2/1/08 1:39:06 PM
Text not available due to copyright restrictions

Statistical Tables
■ ■
377
10017_15_appendixA.indd 377 2/1/08 1:39:06 PM
Text not available due to copyright restrictions

378
■ ■
APPENDIX A
10017_15_appendixA.indd 378 2/1/08 1:39:06 PM
Text not available due to copyright restrictions

Statistical Tables
■ ■
379
10017_15_appendixA.indd 379 2/1/08 1:39:07 PM
Text not available due to copyright restrictions

380
■ ■
APPENDIX A
10017_15_appendixA.indd 380 2/1/08 1:39:07 PM
Text not available due to copyright restrictions

Statistical Tables
■ ■
381
10017_15_appendixA.indd 381 2/1/08 1:39:07 PM
Text not available due to copyright restrictions