Luiz A.M. (ed.) Superconductor
Подождите немного. Документ загружается.

Application of Optical Techniques in the Characterization of Thermal Stability and
Environmental Degradation in High Temperature Superconductors
181
deformations, which lead to a bulk movement on the speckle pattern, and changes in the
microscopic structure of the surface, which induce modifications in the speckle pattern or
decorrelation. Depending on the case, different techniques can be used (Vest, 1979).
Speckle Interferometry is a technique that determines displacements or deformations. An
initial image of the object is taken as the reference state. The object is imaged on the sensor
of a CCD camera where it is superimposed to a reference beam. New images are taken by
the camera after a change in the object is produced. The subtraction of both images produces
an image with bright and dark fringes which represent iso-lines of equal deformation. The
technique is sensitive to out of plane displacements. It has been used in solids to determine
the out of plane deformation (Jones & Wykes, 1989) and, in fluids, to determine velocities
(Andrés et al., 1999; Andrés et al., 2001).
Speckle photography is a technique that compares intensities of the speckle fields and
determines alterations on the surface through movements or changes of the speckle pattern.
No reference wave is used in these images. Thus, phase information is lost but the method is
very simple and easy to use. Traditionally, this technique has been applied to measure the
in-plane displacements in solids (Archbold & Ennos, 1972), deformations (Fricke-Begemann,
2003) and roughness (Yamaguchi et al., 2004).
2.2 The speckle
The image recorded when a rough surface is illuminated with white light is different from that
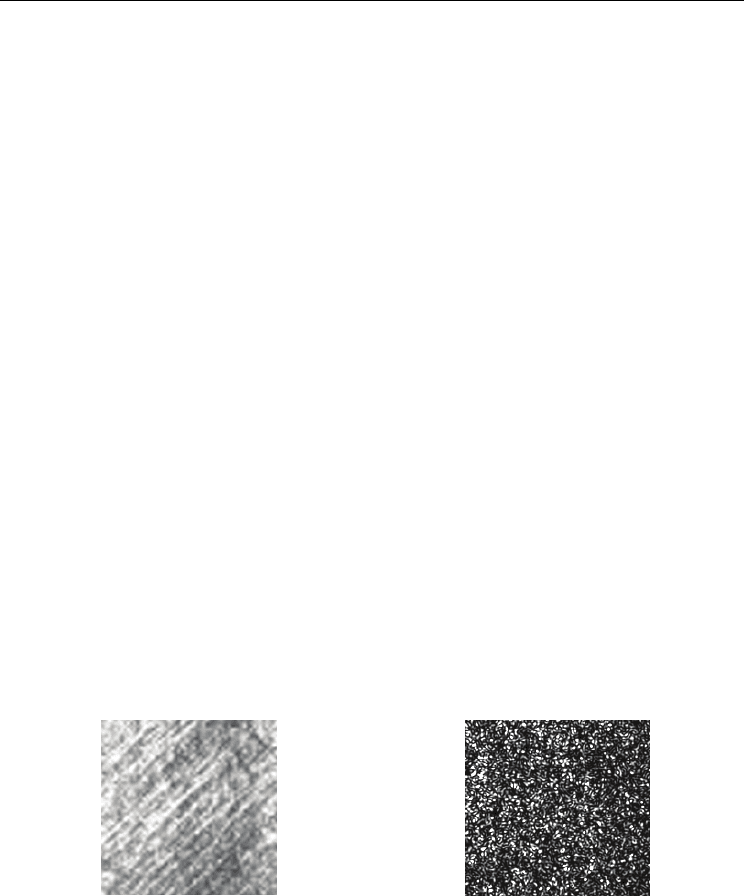
obtained when a coherent laser beam is used. An example of a metallic surface sanded with
emery paper of 400# is presented in Fig. 1. In the image obtained with white light (Fig. 1.a) the
scratched structure produced by sand paper is distinguished. When the same object is
illuminated with a laser beam the image presents a granularity called speckle (Fig. 1.b).
The origin of this granularity is the coherent superposition of many scattered waves with
random intensities and phases, coming from different points of the object surface. This process
takes place when the sample surface is optically rough, that is, if the surface height variations
are greater that the optical wavelength (in this case λ ~ 6 x 10
-7
m). Thus, a coherent addition
of the scattered waves from different object points is obtained. The intensity of each speckle
changes from 0 to a maximum value depending on the interference state.
Fig. 1. Recorded images of a metallic sample sanded with emery paper of 400# and
illuminated: (a) with white light and (b) with a coherent laser beam.
A statistical analysis (Goodman, 1975b) is done by assuming that the phases of the small
contributions are uniformly distributed over a complete 2π-interval, that the amplitude and
phases are statistically independent variables, and that the number of contributions is
sufficiently large. This analysis leads to probability density functions of the intensity I and of
the phase of a fully developed, polarized speckle field as follows:
(a)
(b)
Superconductor
182
() ()
11
2
I
I
pI e p
I
θ
π
−
== (1)
where p(I)dI is the probability for a speckle to have an intensity value between I and I+dI
and p(θ)d θ is the probability for the phase to have a value between θ and θ+dθ.
There are two main geometries to observe the speckles. A freely propagating field, called
objective speckle, and the imaged speckle, called subjective speckle, when the object is
recorded by means of a lens system. In the techniques described in this section, speckles are
recorded on the image plane (subjective speckle). Thus, the speckle mean size d
s
is
determined by the following equation:
(
)
1
1.22
s
M
f
d
D
λ
+
=
(2)
where f is the focal length, M the magnification, λ the wavelength and D the aperture
diameter of the recording system.
2.3 Digital speckle photography (DSP)
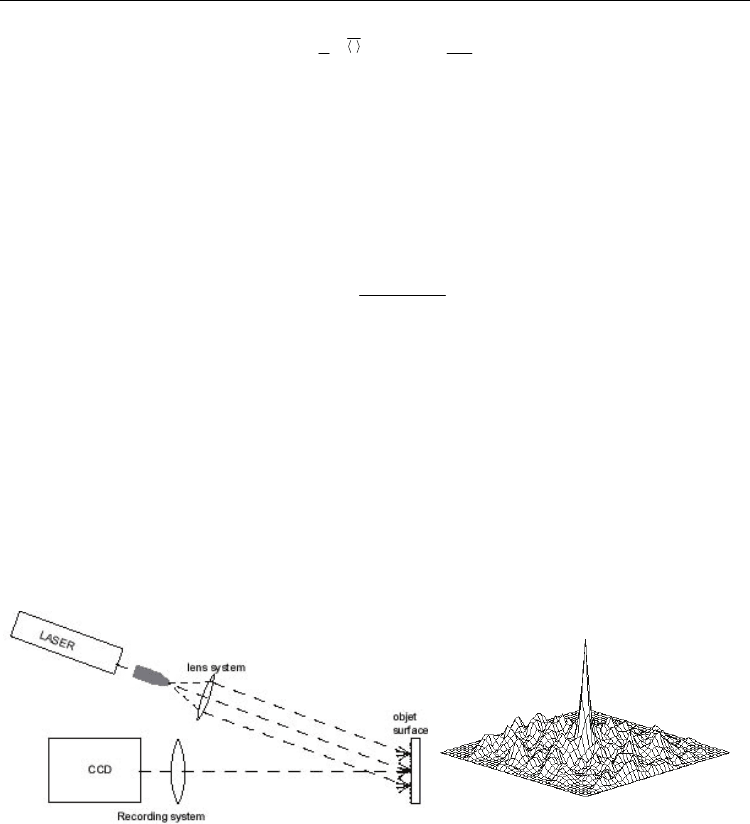
In digital speckle photography, the object is illuminated with a laser beam under an angle θ
and the scattered light is imaged onto a CCD sensor (Fig. 2.a). The lens of the recording
system is determined by the required magnification. The speckle size must be bigger than
the pixel dimensions. The purpose of this technique is the comparison of two different
speckle patterns, corresponding to two object states. The first one is considered as the
reference state, and is recorded before the object modification process starts, while the
second one is recorded after the surface has been modified.
Fig. 2. (a) Digital Speckle Photography recording setup. (b) Plot of a 2D cross correlation
function.
As it is a digital recording, each speckle image is a matrix of intensity values, I(r), associated
with the intensity of the interference at each point of the image. The characteristics of the
CCD camera determine the intensity level range and the matrix dimensions. Due to the
random nature of the speckle fields, changes in the object surface cannot be inferred from
each individual speckle. The information has to be extracted through an averaging process.
Correlation functions are used to quantify the variation between the intensity fields in two
speckle images. The normalized 2D cross correlation function has been used. It is defined
as:
Application of Optical Techniques in the Characterization of Thermal Stability and
Environmental Degradation in High Temperature Superconductors
183
()
(
)
(
)
(
)
(
)
() ()
(
)
() ()
(
)
12
12 12
22
221/2
11 22
II
IrIr r IrIr
CC r
Ir Ir Ir Ir
+Δ −
Δ=
⎡⎤
−−
⎢⎥
⎣⎦
G
GG G G
G
GG GG
(3)
where I
1
(r) and I
2
(r) are the intensity field of the first and second speckle images,
respectively. This function has a different value for each Δr=(Δx,Δy) (Fig. 2.b), and has a
maximum at a certain value. The peak position is proportional to the in-plane sample
displacement and its height is related to the surface modifications. Both contributions can be
analysed separately. The peak value, also known as the correlation coefficient, changes from
1, when the surface remains unchanged, to cero that corresponds to a total decorrelation.
The calculation of the 2D cross correlation function using eq. 3 is a time consuming process,
it is numerically implemented with Fast Fourier Transform algorithms (Takeda, 1982).
Then:
()
()
[][]
1
12 12
IrIr r I I
−
⎡
⎤
⎡
⎤
+Δ = ℑ ℑ ℑ
⎣
⎦
⎣
⎦
G
GG
(4)
where
ℑ means Fourier Transform. The correlation coefficient can be calculated over the
full image or using correlation windows of N
x
x N
y
pixels. In the first case, the evolution of
the correlation coefficient gives a global value of surface changes. As the value at each
interrogation area indicates the local changes, the second procedure allows obtaining a 2D
correlation map
, with information on where the surface modification process has taken
place. The size of the sub-regions has to be big enough for the statistical analysis to be
feasible but as small as the size of the defects to be identified.
2.4 Digital speckle pattern interferometry (DSPI)
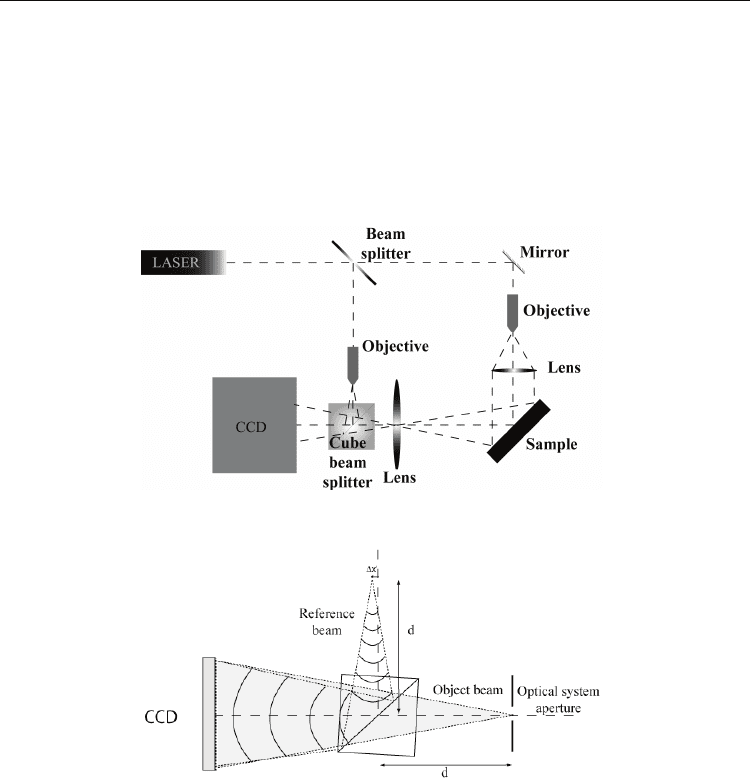
In digital speckle pattern interferometry, the light scattered by the object is made to interfere
with a reference beam (Fig. 3). This interference, called specklegram, is recorded on a CCD
camera at different time states. The reference wave is obtained by diverting a small amount of
the main laser beam. Due to the small spatial resolution of CCD cameras, the angle between
both beams has to be very small. Then, both beams are combined in front of the CCD camera
by means of a cube beam-splitter (Fig. 3). The sustration of two specklegrams, recorded for
different object states, produces an image, whose intensity in each point is proportional to:
I(x,y) ~ (1-cos
Δφ) (5)
where
Δφ is the phase difference in the object wave, which is related to the object local
displacement as:
Δφ=K·L (6)
with K=(k
o
-k
i
) the sensitivity vector, being k
i
and k
o
the wave vectors of the illumination
and observation beams and L the surface displacement vector.
Since the fringes are loci of constant phase difference, the deformation vector components
can be measured using appropriate configurations. In many cases, the visual aspect of the
fringes, that represent regions of equal displacement, can provide enough information in the
analysis of a given experiment.
In order to know the quantitative phase difference value, spatial phase shifting (SPS) can be
introduced (Burke et al., 1998; Creath, 1985). It is based on the addition of a known phase
Superconductor
184
function called phase carrier. A conventional DSPI setup can be turned into a SPS-DSPI
setup by shifting the origin of the smooth divergent reference wave with respect to the lens
centre an amount
Δx (Fig. 4). This generates a linear phase shift in the x-direction of the
sensor. The phase-shifted data are recorded simultaneously on adjacent pixels, in the same
speckle. To resolve this modulation frequency, a phase shift of 2
π (maximum-minimum-
maximum) must be recorded in each speckle instead of the constant phase in a standard
speckle of a DSPI specklegram. Thus, the speckle size is appropriately increased up to a
value of around 3 pixels.
Fig. 3. Digital Speckle Inteferometry setup
Fig. 4. Experimental setup used for introducing SPS in a DSPI system.
Phase maps are obtained using a global Fourier Transform method (FTM) (Takeda et al.,
1982; Lobera et al., 2004). This analysis is based on the calculation of the Fourier transform of
the specklegram. The positive frequency side lobe is isolated and translated to the origin to
eliminate the carrier frequency component. The inverse discrete Fourier transform is then
carried out, and the object phase at each pixel is obtained. A phase difference map, instead
of a intensity map, is retrieved by subtracting two object phase maps. For visualization, the
phase differences are mapped to grey levels such as that 0 is black and 2
π is white, given
that the phase differences are wrapped (only known in the range 0 to 2π).
Although this technique is more sensitive to out-of-plane displacements, if big changes take
place on the surface the correlation between images decreases and then the visibility of the
fringe pattern decreases and even disappears.

Application of Optical Techniques in the Characterization of Thermal Stability and
Environmental Degradation in High Temperature Superconductors
185
3. Analysis of quench generation in high temperature superconductors using
digital speckle pattern interferometry
In this section we show several examples on the use of DSPI for the analysis of the thermal
stability in High Temperature Superconductors. First, we present the experimental
modifications needed to apply this technique in cryogenic conditions, as required for the
study of superconducting materials, and then we show several examples of inhomogeneity
along the length in the transition from superconductor to normal state in different materials.
3.1 Experimental modifications required to apply DSPI in cryogenic conditions
In this application, DSPI has to be used while the superconducting material is in the
superconducting state, at temperatures close to 77 K. For this reason, it has been necessary
to build a new experimental set-up (Recuero et al., 2005). A glass dewar (height of 420 mm
and diameter of 200 mm) was designed with several 85 mm x 100 mm windows with optical
access for different optical techniques (Fig. 5.a). This window was heated with an external
manganin resistance to avoid any condensation on the external wall that could strongly
disturb the DSPI observations.
Two different DSPI configurations have been used in different works. In the first one the
sample was illuminated at an angle of
ϕ=45º (Recuero et al., 2005, Lera et al., 2005). The
angle between the illumination and the recording direction was 90º. With this set-up two
optical windows were required to illuminate and to observe the sample. The sensitivity of
the technique was 0.45
μm per fringe. As can be observed in Fig. 5.b, ϕ can be reduced. In
the case of the second configuration
ϕ =10º (Angurel et al., 2008, Angurel et al., 2009), only
one optical window was required and the sensitivity increased up to 0.28
μm/fringe. In
both cases, the size of this window can be adjusted to the sample size.
One of the difficulties to overcome is the need of a stable atmosphere around the sample.
In the initial experiments, the sample was fixed to an aluminium plate held at the centre
from the dewar top cover and it was cooled by a conduction system, thermally anchored
to the aluminium plate, which is partially immersed in liquid nitrogen. In these
conditions, the sample cannot be placed inside liquid nitrogen because liquid movements
induce some changes in the refraction index that create a random fringe pattern and hide
any observation related to the sample deformation. For this reason, the sample was
usually placed above the liquid surface and the pressure inside the dewar was reduced to
approximately 0.1 atm.
Obviously it is also interesting to obtain information about quench generation with samples
immersed in liquid nitrogen because in some applications these superconducting materials
have to work in these conditions. A new experimental configuration, with the sample placed
very close to the dewar window, was designed (Angurel et al., 2009) (Fig. 5.b). In this case,
the sample was placed closer to the dewar wall in order to reduce the light path inside the
liquid nitrogen from 20 cm to 1 cm. The measurement procedure consists on reducing the
pressure inside the dewar and wait for approximately 15 minutes. It has been observed that
during this time, the random fringe pattern transforms in a series of near horizontal fringes
whose number decreases with time (Fig. 6) and finally almost disappears. This means that
liquid nitrogen movement changes from a random state to a still stratified one and finally it
stabilizes. In these conditions, there is a time window of approximately 10-15 minutes where
the sample displacements can be visualized. The sample temperature can be controlled by
changing the gas pressure inside the dewar.
Superconductor
186
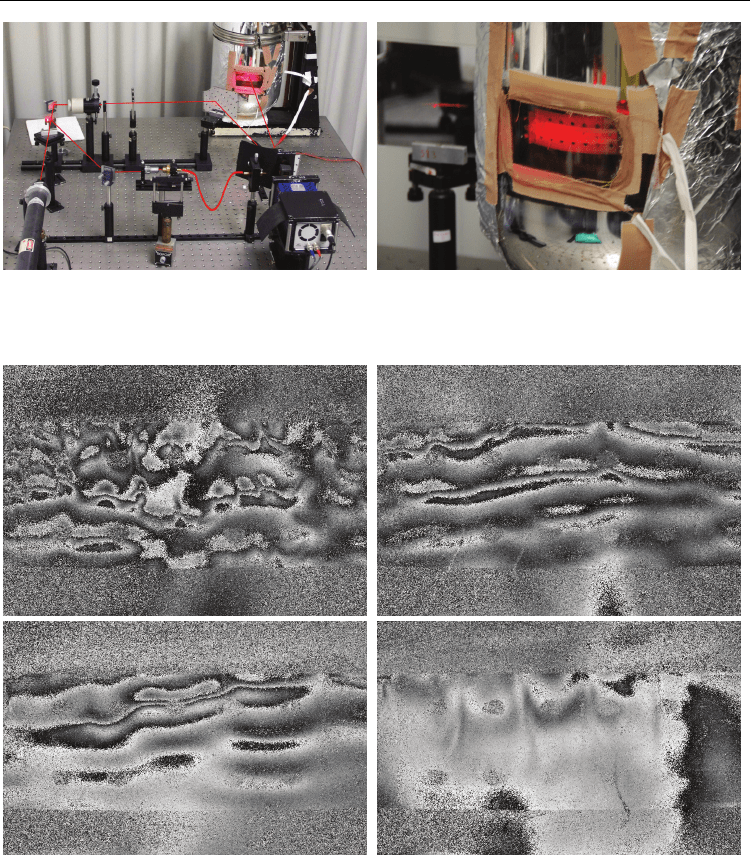
Fig. 5. (a) Experimental arrangement used to apply DSPI in cryogenic conditions. (b) Detail
of the modification performed for placing the sample close to the dewar window in order to
take measurements with the sample immersed in liquid nitrogen.
Fig. 6. Fringe patterns associated with liquid nitrogen movements at different instants after
having reduced the pressure inside the dewar.
3.2 Hot spot generation in Bi-2212 monoliths
Properties of bulk Bi-2212 monoliths are determined by the quality of the intergranular
junctions. Laser melting techniques were introduced as an adequate tool to texture these
materials in a planar geometry and to obtain good superconducting properties (Mora et al.,
2003). When the material transits to the normal state, heat dissipation starts in the points
where the junctions have the poorest properties. These materials have very low thermal
5 min
(a)
(b)
9 min
11 min
13 min
Application of Optical Techniques in the Characterization of Thermal Stability and
Environmental Degradation in High Temperature Superconductors
187
conductivity values and this local heat generation induces inhomogeneous temperature
increments that can deteriorate the superconductor.
Experiments were performed with the optical configuration that had a sensitivity of 0.45
μm/fringe for deformations in the direction perpendicular to the sample surface (Recuero et
al., 2005; Lera et al., 2005). The sample was fixed by one point to the aluminium plate in
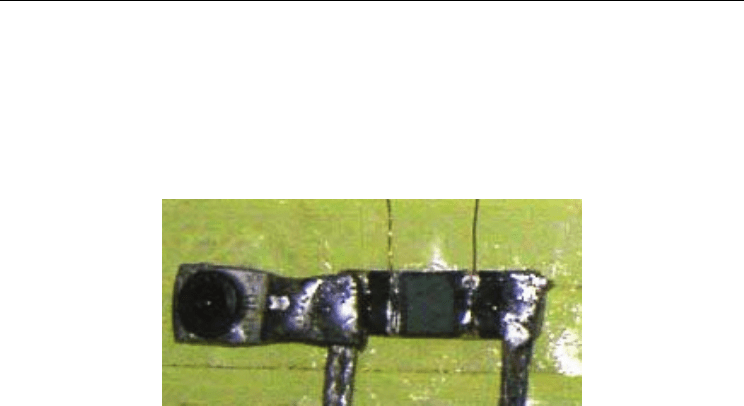
order to avoid the movement of the sample and to have a fixed reference point (Fig. 7). The
sample and the metallic support were electrically isolated.
Fig. 7. Photograph of the system used to hold the Bi-2212 monoliths.
An initial characterization was performed at room temperature. In this case, small currents
were applied for some seconds and the fringe pattern was recorded. At the same time, the
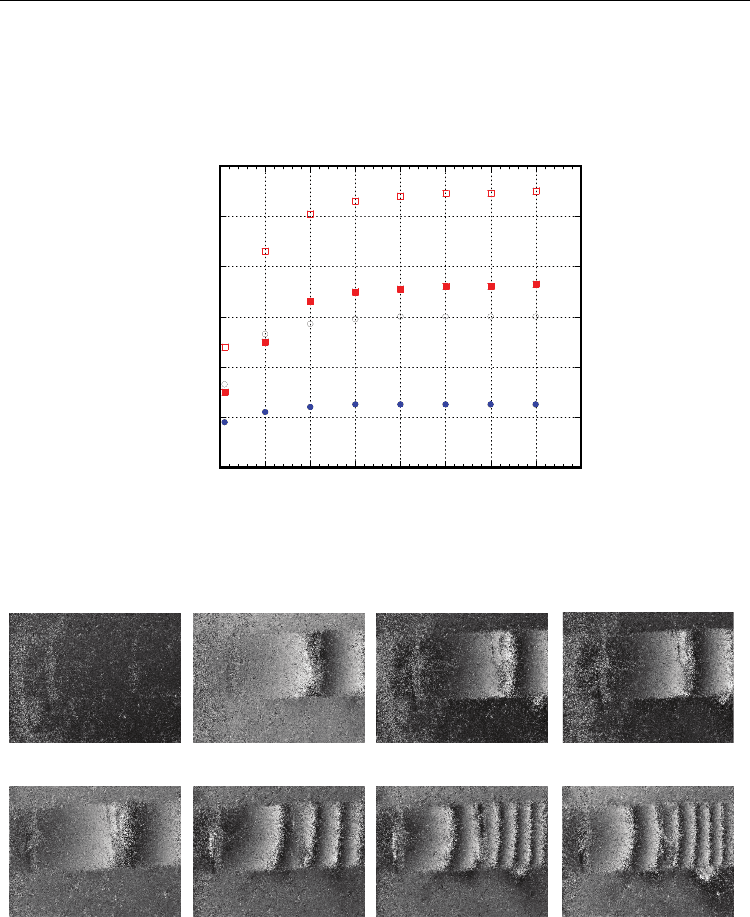
resistance change, which is proportional to the temperature variation, was measured. Fig. 8
shows the time dependence of the resistance that was measured in a Bi-2212 monolith at
room temperature for different applied current values. The observed behaviour correlates
with the DSPI fringe patterns recorded at different instants (Fig. 9). The fringe pattern
corresponds to a bending sample movement with fringes appearing in the image right side.
In the case of 1.5 A only two fringes are observed, they appear at t=20s and they remain
constant during the rest of the pulse. In the case of a current of 2.5 A, the number of fringes
increases up to 6, at t=40s, remaining unchanged afterwards. As in other samples (Lera et
al., 2005) the number of fringes is proportional to the resistance change and, in consequence,
to the temperature variations. This confirms that the number of fringes is related to the
sample deformation associated with thermal expansion.
These monoliths were also characterized at temperatures below
T
c
, applying current pulses
higher than the critical current value (Recuero et al., 2005). Samples were cooled by
conduction. A rotary pump vacuum was made in order to eliminate unwanted fringe
patterns associated with gas movement. As it has been mentioned, in these materials, when
a current higher than the critical current value is applied, dissipation starts at the points
with the poorer superconducting properties. This is reflected on a different fringe pattern
shape. Fringes arise from a point whose location coincides with the point that has the poorer
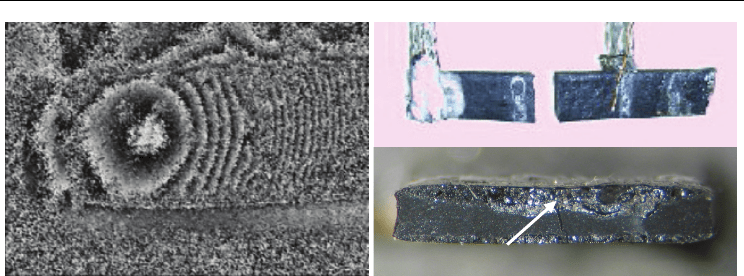
properties. An example in which the applied current is approximately 3 times higher than
the critical current is presented in Fig. 10. This was confirmed by applying higher currents
values, with the objective of generating enough heat to melt the sample. Results showed
that melting was originated in a point (Fig. 10), that coincided with the point where the
fringes were originated.
In consequence, DSPI allows determining where a hot spot will be located. The main
advantage is that it can be located when the temperature reached by the sample is lower that
100 K. These experimental conditions do not deteriorate the sample. For this reason, these
Superconductor
188
studies can be performed combined with microstructural analysis in order to obtain
information on the defects that are responsible of the hot spot generation (Lera et al., 2005).
In these materials, texture processing induces a microstructure where the grains are very
well aligned to the sample axis. DSPI showed that the hot spots were located in regions
where many holes, originated during the texturing process, were concentrated.
27.8
28.0
28.2
28.4
28.6
28.8
29.0
0 1020304050607080
Resistance (mΩ)
t (s)
1 A
1,5 A
2 A
2,5 A
Fig. 8. Time dependence of the Bi-2212 monolith resistance at room temperature for different
applied currents.
1.5 A
10 s 20 s 40 s
80 s
2.5 A
10 s 20 s 40 s
80 s
Fig. 9. Fringe patterns obtained in a Bi-2212 monolith at room temperature for two applied
currents at different times.
This example shows that DSPI observations can be used to obtain information on the origin
of hot spots and how the processing conditions can be modified in order to control these
defects and to reduce their influence on the final properties of the superconducting material.
Application of Optical Techniques in the Characterization of Thermal Stability and
Environmental Degradation in High Temperature Superconductors
189
Fig. 10. Fringe pattern observed in a Bi-2212 monolith at low temperature when a current
higher that the critical current is applied. Longitudinal and transverse photographs of the
sample after having applied a high current pulse that melted it.
3.3 Quench generation in 2G HTS wires
Visualization of quench generation in 2G HTS wires has also been analysed using DSPI
techniques (Angurel et al., 2008; Angurel et al., 2009). This work is being performed in the
framework of a collaboration with SuperPower Inc.. The experiments were done in
homogeneous samples as well as in samples with a controlled defect. This defect produced a
local reduction of the critical current value at 77 K to values around a 20% of the average
value. Experiments were performed with the sample placed both above and below the
liquid nitrogen level. In the first case, two different cooling conditions were used: with the
sample fixed to an isolation sample holder or fixed to a metallic holder. The main result
(Angurel et al., 2008) is that quench generation does not always appears in the point with
the lower critical current value and that other facts as the cooling conditions or
inhomogeneities in the sample thermal stabilization can play a fundamental role.
The results presented here correspond to the case of the sample immersed in liquid
nitrogen, as required in many applications of these conductors. For this reason, as it was
mentioned in section 3.1, an effort was made for performing DSPI observations in these
challenging experimental conditions (Angurel et al., 2009). In addition, the measuring
system has been modified in order to obtain simultaneous measurements of the optical
properties and of the electric field and temperature profiles during the current pulse.
Fig. 11 and Fig. 12 show the results of the DSPI technique applied to two different samples
of the same batch, corresponding to a SCS4050 2G HTS wire with a width of 4 mm and a 20
μm thick stabilizing copper layer. A special sample holder was designed for allowing both
sides of the sample to be in contact with liquid nitrogen or for placing the sample on a
metallic support. The sample is fixed at the two ends and, for this reason, the deformation
associated with the thermal stabilization leads to the bending of the sample.
Fig. 11 shows the typical behaviour of a homogeneous sample, as it is seen by the electric
field and by the temperature profiles, during a pulse of 120 A for 3 s while the sample was
immersed in liquid nitrogen and T=78.6K (I
c
(77K)=123 A) because the pressure inside the
dewar was above atmospheric pressure. Both sides of the sample are in contact with liquid
nitrogen. The electric field values at the pulse end is on the order of 3x10
-4
V/cm (Fig. 11.a)
and temperature rises less than 0.8 K (Fig. 11.b). DSPI fringe patterns are presented in Fig.
11.c to 11.h. In this case, the reference state has been recorded before applying the pulse and
Meltin
g
re
g
io
n

Superconductor
190
Fig. 11. (a) Electric field and (b) temperature profiles recorded in a 2G HTS wire after
applying a current pulse of 120 A for 3 s at 78.6K. (c) to (h) Fringe patterns observed at
different instants: 0.15s, 0.59s, 1.25s, 1.69s, 2.23s, 2.78s, taking as reference t=0s.