Marjoribanks R. Geological Methods in Mineral Exploration and Mining
Подождите немного. Документ загружается.

Appendix A 181
is with several mapping overlays that might be used for an air photograph). As with
any map, the use of colour will maximize the information content. The lithological
data on the core map are recorded according to a legend that is drawn up for each
drilling project. A copy of this legend should accompany each drill hole log. A num-
ber of standard symbols that can be used are shown at the head of the form. Where
the geology is not complex, some of these columns (e.g. lithology and structure) can
be combined.
The pictorial log does not aim to give a detailed, near-photographic representa-
tion of everything that can be seen in the core. As with any geological map it presents
a selection of what are considered to be the key geological elements. The down-hole
depths of important contacts are accurately plotted, but the detail shown is to some
extent symbolic. The aim is to preserve in a visual way the characteristic style and
relationships seen in the core. Where complex or important relationships need to be
shown in a more precise and accurate way, they should be sketched separately in the
Geology notes (Column 8) of the log.
At a scale of 1:100 (or at less detailed, smaller scales) the width of a drill core
would be less than 1 mm. In order to provide space to show observations it is there-
fore necessary to project the structures/lithologies seen in the core for several core
widths on either side of the drill line, thus enabling a core map several millimetres
wide to be made. By doing this, the horizontal and vertical scales of the core map
remain the same and there is no distortion. A surface drawn at 45
◦
on the mapping
column represents a surface at 45
◦
to the core axis (alpha angle).
Planar structural elements (bedding, lithology contacts, faults, veins, etc.) will
usually be shown on the pictorial log in the view that gives the maximum core axis
to surface angle. However, a special case exists where the hole is not drilled at right
angles to the strike of the major planar structural element (usually the lithological
contacts or bedding surfaces) within it. In this case, if the orientation of the core
itself is known, it is a good idea to represent the attitude of this dominant structure
on the pictorial log as the apparent dip that it would make on the drill section. The
apparent dip will always be less than the true dip and can be quickly calculated as
logging proceeds either by looking up a table of correction factors or by the use
of a stereonet (see Sect. B.3.6 for how to do this). Plotting surfaces in this way on
the pictorial log and drill section will facilitate correlation of major lithological units
and structures between holes on the same section. The true orientation of the surface
can then be recorded as a measurement in the Geology notes column.
The centre line of each of the mapping columns is the point at which the down-
hole depth of a particular feature is recorded on the form, just as its intersection with
the long core axis is the point at which the feature would be measured in the core.
A.7 Column 7 (Histogram Logs)
The histogram enables the distribution of quantitative data to be shown as a function
of hole depth. The type of measurements shown and the appropriate horizontal scale
are chosen for each project. Percentage sulphide or percentage quartz are common
variables which could be recorded. The use of colour will allow more than one
182 Appendix A
variable to be shown. Note that the mapping of the mineralization or alteration will
often show considerable detail, and it may not be necessary to try to repeat this in
a quantitative way as a very detailed histogram. In most cases, bulking percentage
values over intervals of a metre should be sufficient.
Remember, the various columns of the form are meant to complement each other.
It is not always necessary to repeat the same data in the different recording formats
offeredbythelogform.
A.8 Column 8 (Geology Notes)
The geology notes column allows recording of verbal or numerical qualifiers of
information shown in the other columns. Information which cannot be otherwise
shown is recorded here: for example, rock name, stratigraphic name, rock colour,
texture and grain size; structural measurements; percentages of mineral compo-
nents; precisely measured down-hole depths (note: most depths can be simply read
off the vertical scale on the log with sufficient accuracy and do not need to be sepa-
rately recorded); sketches illustrating complex relationships; and non-observational
annotations such as comments, conclusions or predictions.
However, note that it is not necessary to fill in this column (or indeed any column)
just because it is there – long runs of unchanging uninformative core should be
expected to result in long runs of rather blank-looking log sheets.
What the column is not provided for is extended passages of descriptive prose.
A.9 Column 9 (Summary Log)
The use of this final column is self-explanatory. It is essentially a simplified sum-
mary of the various pictorial log columns. The summary log is for the geologist
to use as a quick reference, the draftsperson as a source for plotting the standard
section, or the computer operator for entry to the digital exploration data base.
A.10 Remarks Area
These lines can be used for any type of information. They have been found useful to
record drilling data such as rod sizes, water loss, etc. They can also be used to show
the legend for the pictorial log.
Appendix B
Oriented Drill Core: Techniques and Procedures
B.1 Techniques for Orienting Drill Core
B.1.1 Non-mechanical Means
Very often rocks being drilled possess a well developed structure of known orien-
tation, such as a regular bedding or cleavage. Since these surfaces can be seen in
the core, they provide a ready means of orienting it. When choosing a structure to
use in orienting core, it is important that it has a constant attitude throughout the
hole. In this regard, a cleavage will have a more constant attitude than bedding,
and so provide a more reliable surface for this purpose (Fig. B.1). If more than one
cleavage is present (for example, S1, S2, S3 etc.) then the youngest cleavage present
will in general have the most constant orientation throughout the hole (Annels and
Hellewell, 1988). The surface chosen should lie at as low an angle to the core axis
as possible (i.e. possess a low alpha angle). Surfaces at high angles to core (alpha
angles at or close to 90
◦
) cannot be used to orient core by this method.
Once a structure of known attitude has been identified in core, it is easy to mea-
sure the attitude of any other structure of interest. The best way is to place the piece
of core in a core frame that has been set up at the azimuth and inclination determined
by the down-hole survey for that hole depth. The core in the frame is then rotated
about its axis until the known structure is in its correct orientation as measured by
a geological compass. It is then easy to measure the attitude of any other structure
present in the rock by using a geologist’s compass in the same way. More detail on
the use of core frames is given in Sect. B.3.3.
B.1.2 Mechanical Means
Where little is known about the attitude of structures in the rocks being drilled, it is
necessary to orient the core using mechanical means. Mechanical orientation of core
is a relatively easy procedure, and should be standard practice when drilling in any
unknown or structurally complex terrain (see Sect. 7.10 for a detailed discussion on
when to orient core).
183
184 Appendix B
CLEAVAGE
BEDDING
DRILL HOLE
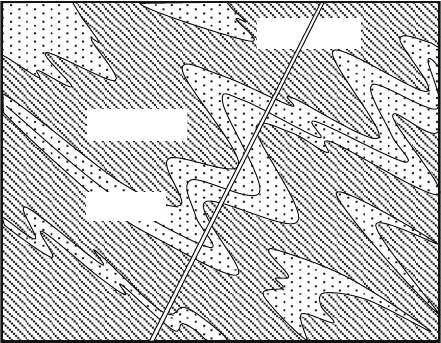
Fig. B.1 Where structures of several ages are present in a deformed rock, the youngest structure
present will have the most constant orientation. When using the known orientation of a surface to
orient core, it is therefore better to use a late generation structure (e.g. use cleavage rather than
bedding; S2 in preference to S1 etc...)
Orientation tools make use of the downwards pointing force of gravity (the grav-
ity vector) to determine a Bottom Of Hole (BOH) position on a portion of the core
that is still attached to the ground (i.e. core in its original orientation). Because of
this, no matter how accurate the orientation tool, no core orientation is possible in
vertical holes and progressively-increasing errors can be expected on holes inclined
from the horizontal at more than 80
◦
.
Measuring the gravity vector is relatively easy – all that is necessary is a weight
free to find the lowest point of the tool. Determining the position of the down vector
on core in its original orientation is very much harder. Two fundamentally differ-
ent methods are employed to meet the requirement that core is still in its original
orientation at the time of measurement:
1. With the Core Stub Method, orientation is carried out on the core stub remaining
at the bottom of the hole after a run (barrel) of core has been drilled and extracted.
At this stage the core stub is still attached to bedrock and will become the top of
the next drilled run of core.
Different tools use different mechanical means to record the position of the
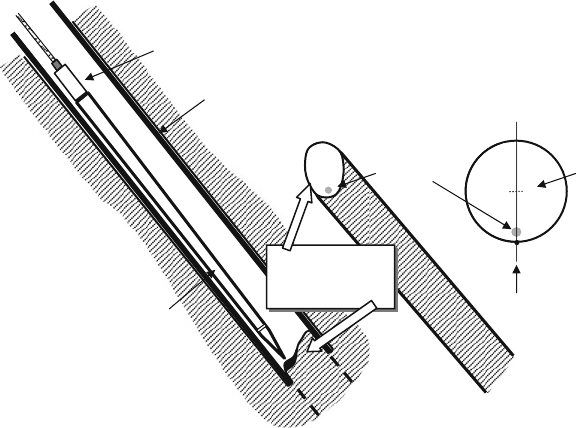
gravity vector on the stub. The simplest device is the core stub spear (Fig. B.2).
This consists of a heavy steel spear (sometimes called a core marking punch)
with a sharp point. This type of orientation tool has been in use for longer than
any other and was first described by Zimmer (1963). The spear is attached to the
overshot (also known as the latch) assembly on the end of the wire line (Fig. B.1)
and lowered down the inside of the rods after a barrel of core has been pulled
from the ground. As it descends, the weight of the spear keeps it pressed against
Appendix B 185
Heavy steel
spear
Wire line
attachment
End view of
core
Core axis
BOH- Bottom of
hole point
Spear mark
Trace of original
vertical plane
Rock stub forms
top of next core
run
Drill rods
Fig. B.2 Orienting core using a spear. The spear is lowered inside the rods after a full core barrel
has been extracted. It makes a mark on the lowest point of the top surface of the core stub exposed
at the bottom of the hole. This mark can be recovered after the next barrel has been drilled and
pulled from the ground
the lower surface of the angled drill rods. The spear is allowed to strike the rock
stub projecting into the bottom of the drill bit and (hopefully) leaves a percus-
sion mark on the stub. This mark locates the Bottom Of Hole position on the
stub. The rock stub becomes the top surface of the next run of core, and the per-
cussion mark can be located when the core is extracted from the barrel. Problems
with the spear arise when the rock is either too hard, or too soft and crumbly, to
take a mark from the impact of the spear. With very hard material, the spear will
either not leave a mark, or bounce (chatter) across the surface leaving a num-
ber of marks that can be hard to interpret. Most spears have an attachment that
allows for a wax pencil or crayon to be substituted for the spear point and this
will often make a better mark on hard material than a steel point. Consistently
achieving successful orientation marks requires skill and experience on the part
of the driller. The driller has to know when to use the point or the pencil, and how
to judge and control the speed of impact of the spear with the core stub. In spite
of these problems, spears are simple, cheap tools, whose mode of operation is
readily understood. For that reason they are still quite popular and drilling com-
panies will often make their own. Much historical drill core has been oriented by
this method.
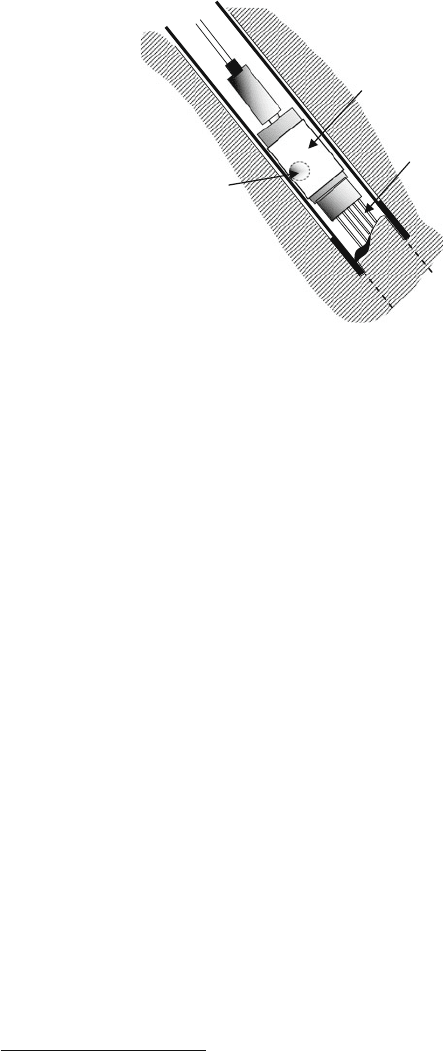
The other core-stub marking technique is the core-stub template. The template
tool orients core by taking an impression of the shape of the top surface of the
core stub. The system is sometimes known as the Craelius System and was first
186 Appendix B
Internal weight –
rolls to bottom of
device
Locking ring (locks
pins and weight in
place when tool is
pulled from hole)
Spring loaded pins
record shape of cor
e
stub
Fig. B.3 Orienting core using a core-stub template tool (the Craelius system). The tool is lowered
inside the rods after a run of core has been extracted. After drilling and extracting the next run
of core, the shape of the core stub can be matched to the template pins, and the bottom of hole
position (recorded by the locked weight) transferred to the core
described by Roxtrom (1961). Like the spear, the orienting tool is lowered down
the hole on the end of the wire line overshot after a barrel of core has been
extracted from the hole (Fig. B.3). A small weight is free to find its position
at the bottom of the tool. Projecting from the base of the tool are a number of
spring-loaded steel pins. When the tool reaches the bottom of the hole, the pins
press against the rock stub and so take an impression of its shape. The action
of pulling the tool from the hole locks the steel pins (which record the shape of
the core stub) and the weight (which records the position of the gravity vector).
When the next run of core is drilled and pulled from the ground, the template pins
can be matched to the core end, thus enabling the BOH position to be marked on
to the core. Template tools eliminate many of the problems with spears detailed
above and have a generally higher success rate in orienting core. They work best
on irregular core stubs, particularly those that lie at a low (alpha) angle to the core
axis. However, if the core stub is smooth and at a high angle to the core axis, a
spear will usually provide a better result than a template. As with spears, template
tools will not orient very broken or crumbly core. A disadvantage associated
with this system (and this applies equally with the spear) is that the core stub and
template have to be matched as soon as the core is pulled from the ground and
a BOH mark made on the core stub. This would normally be done by the driller,
sometimes under less than ideal conditions, and there is no way of subsequently
checking the BOH mark on the core.
In the last 10 years (since the first edition of this book) a sophisticated core-
stub orientation tool has become available which offers high levels of accuracy,
reliability and ease of use.
1
This tool has the following features:
1
For more details see www.2icaustralia.com
Appendix B 187
• It is mounted in the base of the core barrel before the barrel is dropped down
the hole to take up its position behind the bit. After taking an impression of
the core-stub, the tool automatically locks and is pushed back into the core
barrel ahead of the advancing core: it is recovered when barrel and core are
extracted at the end of a drill run. There is thus no need for the driller to lower
the tool in a separate down-hole orientation procedure.
• It combines both a template device to record core shape and a wax pencil
to make a discrete mark on the core. It thus offers the advantages of both
systems.
• The weight is a steel ball that free to find the lowest level in an oil filled
annular race: greater accuracy is achieved by mounting several such races in
parallel. Accurate measurements with hole inclinations up to 88
◦
are claimed.
2. With the Core Barrel Method, the orientation tool orients the core barrel at the
moment when the core lifter (an integral part of the barrel) grips the lowest piece
of the core in the barrel preparatory to breaking it free from bedrock. Since
this piece of core remains locked in the lifter until freed by the driller at sur-
face, the position of the gravity vector determined for the barrel can be directly
transferred to the trapped piece of core. Core barrel orienting tools determine
the gravity vector either by means of a weight or by electronic means. They
can offer high levels of accuracy, but suffer from the disadvantage that core
in the base of the barrel can sometimes – due to the action of drilling – break
free from the bedrock and rotate by some unknown amount before it is gripped
by the core lifter. Since this is the moment when the gravity vector is deter-
mined for the locked barrel/core system, large random errors are possible. There
is no easy way of knowing when this has occurred, since the tool will always
yield an apparently accurate result. Measurement errors (although not their spe-
cific cause) can be deduced after the core has been extracted and marked out
through a large miss-match in BOH orientation lines between adjacent core runs.
If there are no adjacent oriented core runs, or if marking out the core is done
on a run by run basis (unfortunately, a common practice), the error may never
be discovered and incorrect measurements will be made and entered into the
data base.
In the author’s opinion, all other things being equal, a system that measures the
orientation of core before it is drilled will be much less subject to error than one
which measures orientation after drilling. For this reason, core-barrel orienting tools
are not recommended in this book.
All core orientation tools lead to the establishment of a bottom-of-hole (BOH)
orientation mark on the end of a run of core (on the top surface in the case of core-
stub tools and on the basal piece of a core run in the case of the core-barrel tools).
This mark is used as the starting point to draw a reference line (BOH line) along the
entire length of the core run, and along adjacent runs that can be matched to it. The
next section explains how this is done.
188 Appendix B
B.2 How to Handle Oriented Core
Extra handling procedures are necessary for oriented drill core. These are usually
the responsibility of an experienced exploration technician.
Core pieces have to be first removed from the core tray and reassembled in a
channel by carefully matching the broken ends of the core to form a continuous run.
This process is essential if the core is oriented, but is a highly recommended step for
all cores, whether oriented or not. The channel used should be as long as practicable
but not be shorter than a standard core barrel (usually 3 or 6 m). The longer the
channel in which the core is being reassembled, the easier and more accurate this
process becomes. Channels are often made from vee-section lengths of metal or
wood. One made by bolting two lengths of 50 mm polythene pipe edge to edge has
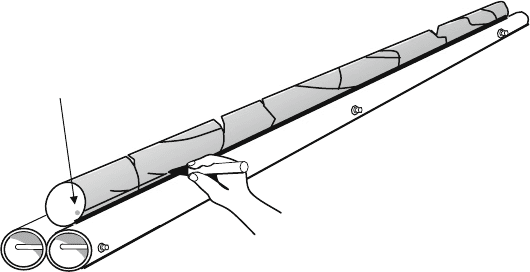
been found to be very effective, and is light enough to be easily moved (Fig. B.4). If
the core pieces cannot be fitted together in their original orientation, then core has
been lost, and the orientation line cannot be transferred past this point.
When assembling the core, commence at one end of a run by placing the BOH
orientation mark against one of the long edges of the channel. After re-assembly
of as much of the core as possible, the straight channel edge can now be used to
transfer the mark by drawing a line with a felt-tipped pen along the whole length of
core (Fig. B.4). This line is referred to as the BOH line. It marks the intersection of
a vertical plane (or drill section plane) with the lower surface of the core.
With very fragile core, the use of a split tube core barrel is often used to improve
core recovery. In this case, provided the core pieces are still in their original orien-
tation with respect to each other, the BOH line should be drawn along the length of
the core, using a long straight edge, before removing it from the core barrel.
Bottom of Hole
mark from core
orienting tool.
Fig. B.4 A run of broken core pieces is carefully re-assembled in a channel with the BOH mark
against the straight channel edge. The channel should be at least as long as a standard core barrel
(3–6 m). The one illustrated is one made from two lengths of 100 mm polypipe. The straight edge
is used to draw the BOH line along the length of the core. An arrow pointing down-hole is drawn
on one side of this line on to each core piece
Appendix B 189
Wherever possible, the orientation mark on the top of one core run should be
transferred (by matching broken core ends) to the bottom of the core from the pre-
ceding run. The BOH line can then be drawn both up-hole and down-hole from
the mark. When adjacent core runs carry orientation marks, the degree to which
the projected BOH lines match in the middle of the runs provides a good measure
of the accuracy of the whole core orientation process. Considering the way these
lines have been constructed, a slight miss-match between the two lines is only to be
expected. However, a discrepancy of over 10
◦
would indicate a significant handling
error. If this occurs, the whole process of determining the BOH line from the core
orientation mark should be repeated. If the discrepancy remains after checking, the
section of core should be considered un-oriented, or, at the least, a note s hould be
made on the drill log, and any measurements taken treated with caution.
Once the BOH line is drawn, it is recommended that the down-hole direction be
marked with a small arrow (pointing down the hole) on to each separate piece of
core. Where large continuous pieces of core have been recovered, an arrow should
be marked at least every 25 cm along the core (Figs. B.4 and B.5). The arrows should
be placed on the half of the core that will be retained after core is cut for assay (see
Fig. 7.24). This practice ensures two things:
• It identifies the core half to be subsequently taken for assay (i.e. the half without
the arrow).
• Orientation marks are preserved in the retained core.
In most cases it is not possible to orient the entire core from a hole. However,
it is recommended that the non-oriented sections of the hole be marked using a
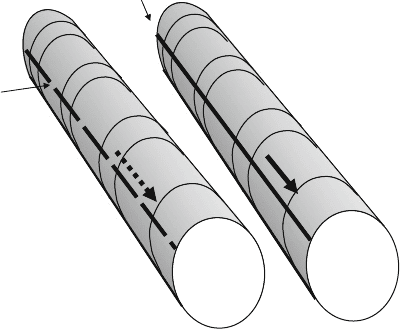
Oriented
core
Non-
oriented
core
Bottom Of Hole line and
cutting line for sampling
Cutting line
for
sampling
O
riented
core
N
on
-
o
r
i
e
nt
ed
co
r
e
ne
g
Fig. B.5 When marking out oriented core, it is recommended that a continuous line be used for
the BOH line and down-hole arrows. When marking a cutting line on non-oriented sectors of the
core, use a dashed line and dashed arrows

190 Appendix B
down-hole line and arrows, in a similar way to that described for oriented core. If a
dashed line and dashed arrow are used for marking out the non-oriented sectors of
the hole, and a continuous line and arrow for the oriented sectors, the two categories
of core can be distinguished when it comes to logging
2
(Fig. B.5). The down-hole
line drawn on non-oriented core should be positioned to correspond, as nearly as
can be judged, to a true BOH position, making use of internal structures in the
core whose orientation is known from adjacent oriented sections of the hole. If no
information is available as to the correct BOH position, then the dashed down-hole
line should be drawn so as to lie at the highest angle possible to any dominant planar
structure in the rock. The line will become the cutting line when the core is sawn to
produce a half for assay.
B.3 How to Measure Structures in Oriented Core
Structural observations and measurements should ideally be made on whole core
before it is sawn in half. The atitude of planes should be recorded either as dip and
dip direction, or as strike/dip/dip direction (see Sect. 2.1.6).
B.3.1 Before You Measure
Examine the core to identify what structures are present and the relationships
between them. This qualitative examination is a vital part of gaining an understand-
ing of the history of the rock. The geologist should consider the following sorts of
questions (this is not an exhaustive list):
• What structures are present?
• What rock elements define the structure?
• What are the relationships between the structures, lithologies, alteration and
veining?
• What sectors of the core have constant attitudes of structure and what sectors
show variability?
• Is the cleavage steeper than the bedding?
• Is the asymmetry sinistral or dextral?
• Is the hole being drilled at a low angle or high angle to particular structures?
• How do the structures seen in core fit with the larger-scale mental picture of the
prospect that is evolving in the geologist’s mind? In other words, does what you
see reinforce or falsify your current hypotheses?
Once this qualitative examination of the core is complete the geologist is in a
position to measure some of the structures that have been identified. By this stage it
2
This is better than the alternative system of using different colours for the two types of line. Even
in the absence of a key, it should be intuitively obvious that a dashed line has less certainty than a
solid one.