Mark James E. (ed.). Physical Properties of Polymers Handbook
Подождите немного. Документ загружается.

ing q. This observation is in accord with that reported by
Moynihan et al. [46,47] on several inorganic glasses. Using
the Macedo-Litovitz hybrid equation, Rekhson and Scherer
rationalized this broadening [48]. Bero and Plazek observed
the same broadening on a fully cured epoxy resin which is a
viscoelastic solid since it is comprised of a molecular net-
work which precludes flow [49]. This is in contrast with the
polystyrene of Greiner and Schwarzl which is a viscoelastic
liquid, because it is constituted of linear molecules and it
does flow. The specific volume-temperature cooling curves
for the epoxy resin are shown in Fig. 12.3. The extent of the
temperature range between equilibrium liquid-like and
glassy contractions is shown in Fig. 12.4. The rate depend-
ence of T
g
is also presented by Greiner and Schwarzl [5b]
for polymethyl-methacrylate, PMMA, polyvinylchloride,
PVC, and polycarbonate, PC.
12.3 VOLUME AND ENTHALPY VARIATIONS
AND THE FICTIVE TEMPERATURE T
f
With great care and effort, Richardson and Savill [50]
have succeeded in measuring the T
g
of polystyrene in cooling
as a function of rate in a differential scanning calorimeter,
DSC, and have compared the results obtained dilatometri-
cally. Their study covered the molecular weight range from
580 up to 2:0 10
6
. The checks agreed within about 1 8C.
The difficulty of the study was made clear. Most investiga-
tors do not have the opportunity to exercise the effort needed
to obtain accurate T
g
s from DSC measurements. Most DSC
measurements are carried out as heating scans [51] which
result in yielding something close to the fictive temperature
T
f
of Tool [44]. Investigators of inorganic glasses have long
appreciated the distinction between T
g
and T
f
while polymer
scientists in general are not aware of or ignore it. Figure 12.5
shows the glass temperature as the intersection point of the
volume, y, or enthalpy, H, temperature lines of the equilib-
rium (or metastable equilibrium) liquid and the glass
110
0.845
0.846
0.847
0.848
0.849
0.850
0.851
0.852
0.853
0.854
0.855
115 120 125 130 135 140 145
TEMPERATURE (⬚C)
SPECIFIC VOLUME (CM
3
/g)
EPON IOOIF/DDS
RATE (⬚C/min)
T
g
(⬚C)
⫺0.90
131.7
130.5
129.9
126.1
⫺0.250
⫺0.050
⫺0.003
FIGURE 12.3 The specific volume
VV (cm
3
=g) of EPON 1001F
fully cured with a stoichiometric amount of 4,4’–diamino
diphenyl sulfone (DDS) shown as a function of temperature
at four different rates of cooling 0.90, 0.25, 0.050, and
0.003 8C/min. Glass temperatures identified by the intersec-
tion point of the equilibrium and glass lines are listed.
110
0
1
2
3
4
5
6
7
120 130 140
TEMP.(⬚C)
⌬V x 10
4
(cm
3
/g)
~
RATE
⫺0.90 ⬚C/min
⫺0.250
⫺0.050
⫺0.003
FIGURE 12.4. Deviation of measured specific volume points
from the equilibrium and glass lines of Fig. 12.1 plotted as a
function of temperature, showing the extent of the transform-
ation range and its change with the rate of cooling.
Temperature
T
g
T
f
Enthalpy or Volume
FIGURE 12.5. Schematic plot of the enthalpy or the volume
as a function of temperature for glass-forming liquids. The
fictive, T
f
and glass, T
g
, temperatures are indicated.
THE GLASS TEMPERATURE / 189
obtained in cooling. The intersection point is usually chosen
as T
g
. [3,23,34,49,50]. For a given substance this definition is
a material characterizing function of the rate of cooling since
it is the measure of the departure from a unique equilibrium.
Figure 12.5 also shows how T
f
which identifies the state of a
specimen. T
f
is the result of a simple geometric operation.
The specific volume or enthalpy of a specimen must be
known and a line having the slope of a glass line is drawn
through it. The intersection of this glass line with the equi-
librium line is T
f
. Note that T
f
is not a function of the heating
rate. A fictive temperature measured by heating at the same
rate as that of an immediately preceding cooling from above
T
g
approximates T
g
and is called T
f ,g
.
In an actual heating curve, if it is slow enough, an appre-
ciable spontaneous contraction or decrease in H can occur
during the heating, which would yield an intersection point
slightly below T
f
. For equal cooling and heating rates, T
f
is
measurably lower than T
g
. Without corrections for thermal
lags, actual scans often show indicated temperatures where
T
f
> T
g
. This is a clear indication of the error incurred. DSC
measurements in the past have almost universally been car-
ried out in the heating mode [51,52] because thermal lags can
be corrected with melting point standards. Since freezing is
a nucleated process, super cooling always occurs which
prevents an accurate calibration during cooling. However,
it has been observed that some liquid-crystal meso-phase
transitions do not show super-cooling, thus making accurate
calibrations during cooling a convenient possibility [53].
In addition, it should be noted that, while it is generally
recognized that the dynamic loss tangent peaks are 158–
20 8C higher than T
g
(q ¼ 1 8=min), [54,55a] the temperat-
ures of these maxima continue to be reported as T
g
s. Twenty
degrees above T
g
, the rate of molecular motion in many
polymers is about a million times greater than that found at
T
g
. Therefore, predictions for rate processes based on such
incorrect T
g
s can be in error by six orders of magnitude. The
uncertainty of many of the reported values, therefore, should
not be taken lightly for practical purposes. In addition, ser-
ious differences of opinion exist concerning the molecular
mobility at T
g
. Such differences cannot be resolved until a
better collection of T
g
s is available. Even then, different
analyses and models appear to lead to differing conclusions.
Some discussion of these will be found below.
12.4 ISOTHERMAL CONTRACTION NEAR
AND BELOW T
g
The kinetics of spontaneous time-dependent contraction
of a glass following a quench from equilibrium above T
g
is
frequently studied. This kind of measurement is one of the
experiments carried out by Kovacs [3] in his classical stud-
ies on the time-dependent variation of the specific volume of
glasses. The most common study involves quenching from a
fixed temperature above T
g
down to different temperatures
below T
g
. At each chosen lower temperature, the spontan-
eous contraction is monitored as a function of time. The
results of such quenches and annealing are illustrated in
Fig. 12.6. A commercial polystyrene (Dylene 8; Arco Poly-
mers, M
n
¼ 0:93 10
5
, M
w
¼ 2:2 10
5
) was studied
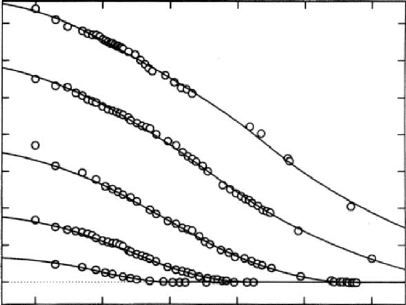
[55b]. The fractional excess (above equilibrium) specific
volume (y(t)=y
inf
) 1 is plotted as a function of the loga-
rithmic annealing or aging time.
yy(t) is the time-dependent
specific volume and
yy
inf
¼ y (1) is the equilibrium value for
the temperature at which the densification is occurring.
Measurements such as these can be used to define a T
g
which would be a material-characterizing function of the
time of annealing (or physical aging [31]). In spite of
the acknowledged intrinsic nonlinearity of the contractions
linear parallel segments of the response are observed which
can be easily extrapolated to zero excess specific volume
[3]. In Fig. 12.6, lines tangent at the points of inflection can
be extrapolated to zero. This intersection with the logarith-
mic time axis yields the time-temperature relationship for
this T
g
: T
g
would then be a function of the aging time. The
advantage of this kind of T
g
is the greater resolution that is
possible relative to that available from a cooling curve. The
intersection point of the equilibrium and glass lines yields
a T
g
value which is probably valid to within a degree. The
rate of time-scale shifts with temperature in the quench
experiments is equivalent to that of viscoelastic processes
[49], which are large. An order of magnitude change in rate
of transport processes near T
g
requires a temperature change
from 1.58 to 6 8C depending on the material.
12.5 THE CONCENTRATION DEPENDENCE
OF THE GLASS TEMPERATURE, T
g
(f
2
)
Usually a diluent decreases the T
g
of a polymer severely.
Early measurements [56] indicated that solvents with lower
T
g
s of their own decreased the T
g
of a polymer to a greater
1
0.0
0.5
1.0
1.5
2.0
2.5
3.0
3.5
23456
Log (t-100)
10
3
[V(t)/V
inf
)-1]
Polystyrene Dylene 8 (M
w
=2.20x10
5
)
Physical Aging after quencing from 104.0 ⬚C
88.0 ⬚C
91.0 ⬚C
94.0 ⬚C
97.0 ⬚C
100.0 ⬚C
FIGURE 12.6. The fractional excess specific volume
[
vv (t)
vv(1)]=
vv (1) for a polystyrene at different temper-
atures shown as a function of the logarithmic time after
quenching from T ¼ 104.0 8C. (100 sec is subtracted as the
approximate time to reach the temperature indicated.)
190 / CHAPTER 12
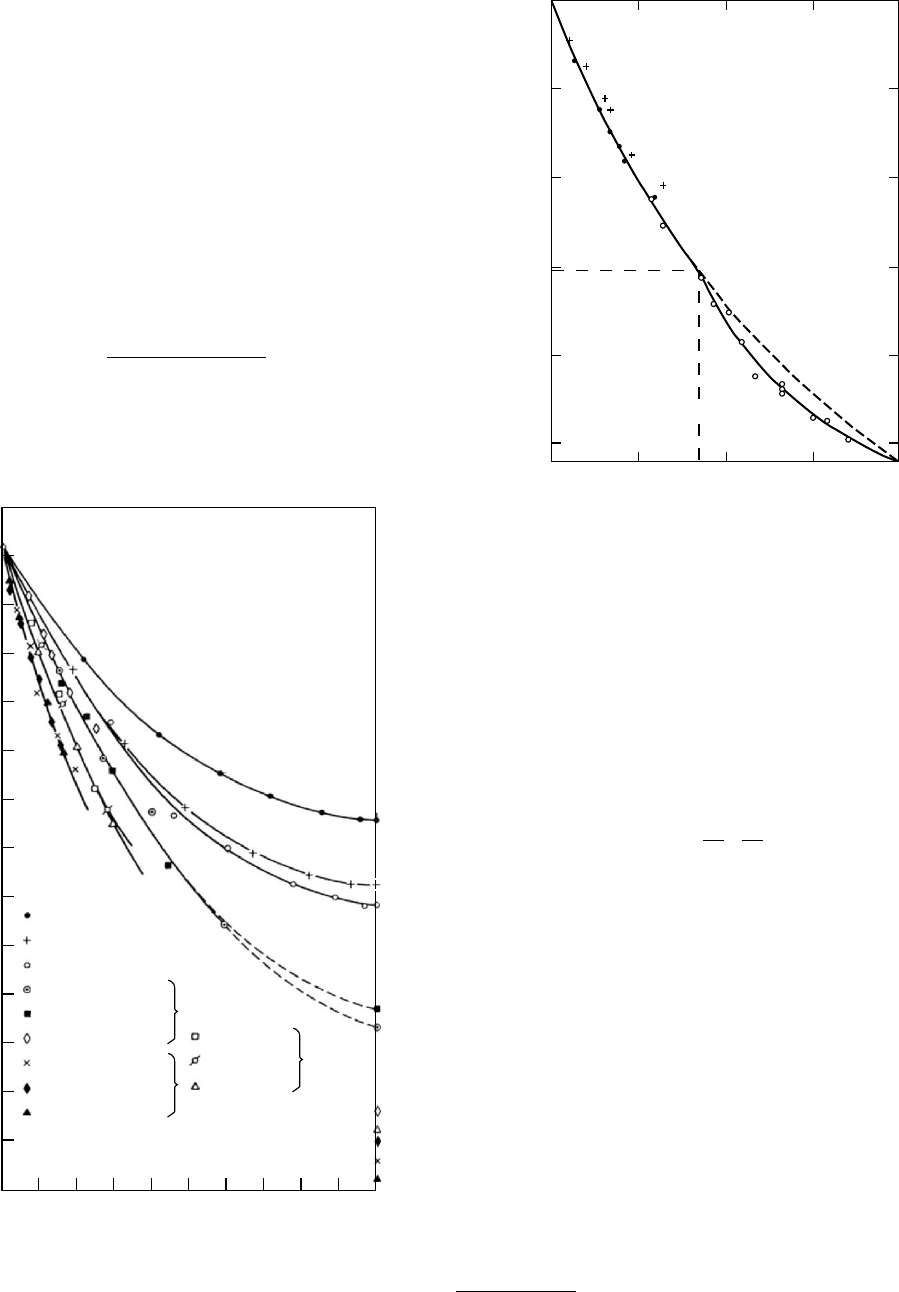
extent. This can be seen in Fig. 12.7 where the compos-
itional variation of the T
g
of polystyrene in a number of
solvents is shown. Solutions of a polymer in solvents with
T
g
s higher than its own will usually have a greater value than
that of the neat polymer [57].
The impression of a simple relationship given by Fig.
12.7 is misleading since a continuously decreasing negative
slope is indicated. For polystyrene, PS, solutions in toluene
[58] and m-tricresyl phosphate [59,60] this has been shown
not to be the case. In 1964 Braun and Kovacs reported
results on the polystyrene/toluene system which showed
two descending curves which came together in a cusp [58]
(see Fig. 12.8). The results were rationalized by fitting the
Kelley–Bueche equation [61],
T
g
¼
f
2
a
2
T
g2
þ f
1
a
1
T
g1
f
2
a
2
þ f
1
a
1
,
to the data above the temperature of the cusp, T
c
.This
equation was derived assuming that the free volumes of
the polymer and the solvent were additive and that T
g
is an
iso-free volume temperature.
a
f is the volume faction; a is
the cubical thermal expansion coefficient of the fractional
free volume, f ¼ y
f
=y; subscripts 1 and 2 represent the
solvent and polymer, respectively. y
f
is the free volume
and y the measured volume. Below T
c
, Braun and Kovacs
used the equation [58],
T
g
¼ T
g1
þ
f
g2
a
1
f
2
f
1
,
where f
g2
is the fractional free volume of the polymer at
its T
g
.
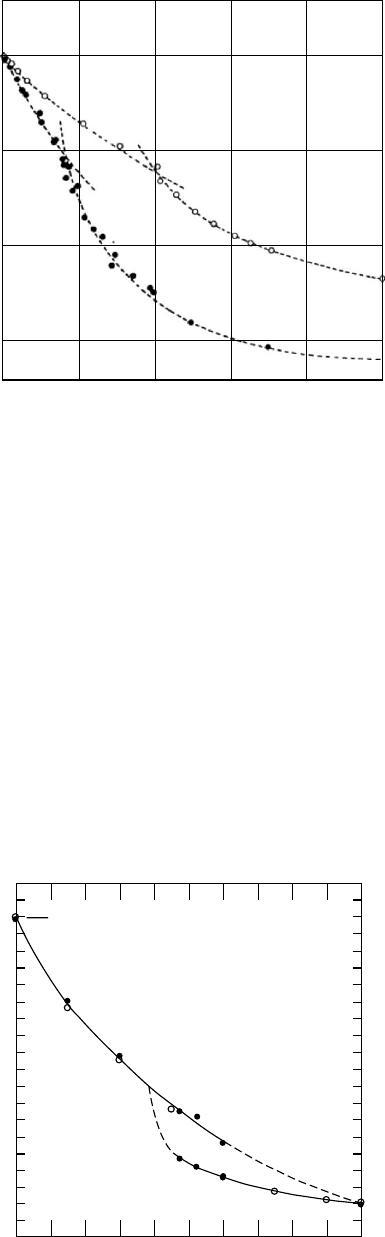
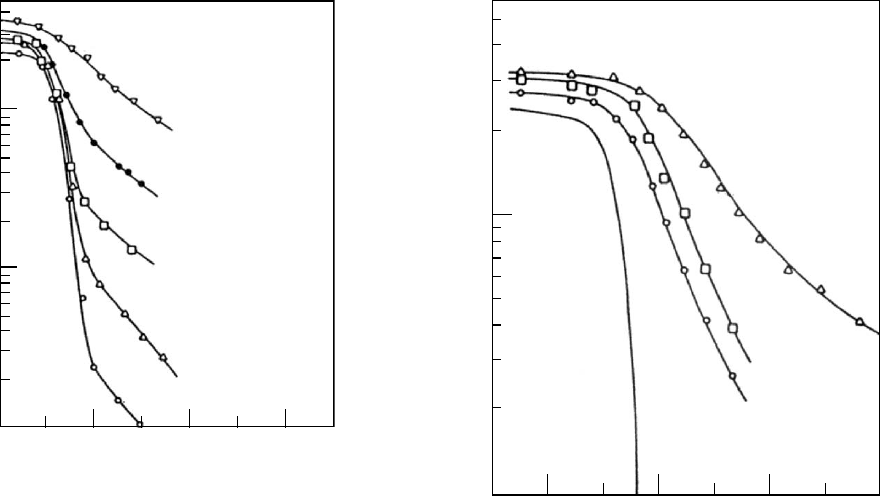
Pezzin et al. found the same kind of behavior exhibited by
polyvinyl chloride PVC in two different plasticizers, dibutyl
phthalate, DBP, and dicyclohexylphthalate, DCHP [62,63].
The same two equations provided excellent fits to the PVC
solution data (see Fig. 12.9). For polystyrene dissolved in
m-tricresyl phosphate, TCP, additional factors were noted.
Differential thermal analysis measurements indicated
double T
g
s for solutions with lower polymer concentrations
beyond the depicted cusp in Fig. 12.10 [59]. Creep recovery
measurements on this system showed that the solvent mol-
ecules in the solutions have higher mobilities than the poly-
mer chain segments. A lower temperature and greater
crowding is therefore necessary to force the solvent
molecules from an equilibrium response. Therefore, it was
a
Other treatments are now available [137,138].
0
−160°
−140°
−120°
−100°
−80°
−60°
T
g
−40°
−20°
0°
20°
40°
60°
80°
0.20 0.40
Carbon disulfide
Ethyl acetate
Methyl acetate
Benzene
Toluene
Amyl butyrate
Chloroform
Nitrobenzene
Methyl salicylate
Tricresyl phosphate
Phenyl salicylate
b −Naphthyl salicylate
0.60
w
1
0.80 1.00
FIGURE 12.7. The compositional variation of the glass
temperature T
g
of polystyrene in 12 different solvents. W
1
is
the weight fraction of solvent. (From Jenckel and Heusch, by
permission, [56].)
010,25
250
200
150
100
50
0
0,50 0,75
c
T
g
,
2
⫺T
g
,
x
, ⬚C
c
c
FIGURE 12.8. The depression of T
g
of a polystyrene by
dissolution in toluene. x is the weight fraction of toluene. Filled
circles represent dilatometric determinations and unfilled cir-
cles were obtained by means of differential thermal analysis,
DTA. The crosses represent the results of Jenckel and
Heusch [56]. (From Braun and Kovacs by permission, [58].)
THE GLASS TEMPERATURE / 191
concluded that the higher T
g
s reflected those of the polymer
chain segments in a solvent-altered environment and the
lower T
g
s reflected the solvents mobility in the presence of
the polymer chain segments [60]. For different bulk poly-
mers, T
g
local mode or short-range molecular motions are
found within experimental uncertainty at the same place on
the time or frequency scales of response [64–66]. For the
solutions of PS in TCP, the T
g
s from the lower ‘‘altered
solvent’’ curve were necessary to bring the solvent contri-
bution to the recoverable compliance into correspondence
with other solutions. The higher T
g
s were also needed to
bring the contribution from polymer local modes into cor-
respondence [60]. The mobility of solvent molecules and
how it is influenced by the presence of polymer solute
molecules has been investigated and documented by meas-
urements of pulsed field-gradient NMR [67], oscillatory
electric bire-fringence [68,69],
13
C NMR relaxation [70],
photon correlation spectroscopy [71–73a], and dielectric
dispersion [73b]. Solvent molecules generally have a de-
creased mobility in the presence of polymer molecules with
greater T
g
s.
In most cases, free volume concepts at least qualitatively
predict the shift of solvent and polymer chain segment
mobilities towards one another. The most frequently
encountered case, where a polymer with a higher T
g
than
that of the solvent, brings to the solution a smaller contri-
bution of free volume which decreases the solvent’s mobil-
ity. At the same time the solvent, being far above its T
g
,
brings a large contribution of free volume to the solution
which accelerates polymer segment motions. However,
there are solutions where the solvent’s mobility is increased
by the presence of a polymer whose undiluted T
g
is higher
than that of the solvent. In this case, obviously, free volume
concepts are inadequate. In these cases, the coupling model
of Ngai has been able to attribute the unexpected solvent
acceleration to a ‘‘primitive’’ or uncoupled relaxation time
of the polymer which is smaller than that of the solvent [73].
12.6 DEPENDENCE OF T
g
ON MOLECULAR
WEIGHT AND CROSSLINKING
During the transformation of a monomer into a polymer,
many atoms separated by van der Waals distances (5A
˚
)
participate in the formation of covalent bonds (1–3 A
˚
).
Therefore during polymerization, an increase in the macro-
scopic density ensues, while on the molecular level a de-
crease in free volume and entropy occurs while the
cooperativity of motions increase. Concomitantly the glass
temperature can increase by more than 100 8C. Several
important adhesive systems are based on this increase. The
cyanoacrylate ‘‘Super Glue’’ starts as a monomer with a
T
g
< 0 8C and it polymerizes to a linear soluble polymer
with a T
g
which is in the neighborhood of 100 8C upon
application under anaerobic conditions. For linear polymers
the simple equation [74]
T
g
¼ T
g
(1) K=M
n
,
which reflects the linear decrease in T
g
with the increase in
concentration of polymer chain ends does an adequate job of
describing most existing data in the literature. Deviations
may occur at very low molecular weight. The more elabor-
ate Gibbs-Dimarzio theory [40,41] which concentrates on
the conformational entropy can fit data to lower molecular
weights.
Uncatenated cyclic polydimethylsiloxane, PDMS, shows
[75] a slight increase in T
g
with decreasing molecular
0
200
250
T
g
, °K
300
350
0.2 0.4 0.6
w
1
0.8 1.0
FIGURE 12.9. The T
g
of a polyvinlychloride as a function of
diluent concentration in two different solvents. Open circles-
dicyclohexylplthate and filled circles-dibutylphthalate. W
1
is
the weight fraction of diluent. (From Pezzin, Omacini, and
Zilio-Grandi by permission [62].)
0
−80
−60
−40
−20
0
Tg °C
20
40
60
80
Polystyrene-Tri Cresyl Phosphate (TCP)
100
20 40 60
% TCP
80 100
FIGURE 12.10. The T
g
s of a polystyrene as a function of the
weight percent of the solvent m-tricresyl phosphate.
192 / CHAPTER 12
weight. This trend has been rationalized by Gutman and
Dimarzio [76]. However, it was observed that the rate of
creep at 120 8C for cyclic polystyrene, PS, with
M
w
¼ 1:11 10
4
in the softening dispersion was the same
within experimental uncertainty as a cyclic sample with a
M
w
¼ 1:85 10
5
. This indicates that the T
g
s of the two
samples had to be within one or two tenths of a degree of
one another [77]. For their linear counterparts, the rate of
creep of the lower molecular weights is about 100 times
faster where the difference in T
g
s is about 10 8C.
Crosslinking can increase the T
g
above that of the infinite
molecular weight linear polymer. This increase can be
accounted for with the equation of Fox and Loshaek [74].
T
g
’ T
g
(1) K=M
n
þ K
x
r,
where r is the number of crosslinks/gram.
Epoxy resins based on the diglycidyl ether of bisphenol
A, DGEBA, are the most widely produced and studied.
Their chemical structure is represented by
CH
3
CH
3
CH
3
CH
2
CH
CH
2
CH
2
CH
2
,CH
2
CH CH
OH
C
CH
3
CH
3
n
C
O
OO OO
O
where (nþ1) is the average number of repeat units in the
epoxy resin molecule. Diamines are most often used in
curing these resins. Two examples are:
4,4’-methylene dianiline, MDA,
C
H
H
NH
2
,H
2
N
whose molecular weight is 198.3 g/mol, melting point range
90–93 8C and density, r(23 8C) ¼ 1:16 g=cm
3
; and 4,4’
diamino diphenyl sulfone, DDS
S
O
O
NH
2
,H
2
N
MW248.3 g/mol, Mp 175–178 8C, r(23 8C) ¼ 1:38 g=cm
3
.
The effect of the developing network during curing on T
g
and the mechanical behavior is illustrated with an epoxy
resin Epon
b
1001F (n ¼ 2:3) cured with DDS [81]. The
degree of network development was determined by reacting
the epoxy resins stoichiometrically with varying ratios of
the tetrafunctional crosslinker DDS and the chain-stopping
monofunctional methyl aniline. Some properties of the resin
at different stages of network development are given in
Table 12.1. Fictive temperatures T
f ,g
[82–84] which ap-
proximate T
g
are presented along with closely related tem-
peratures. The T
f ,g
(108/min) for the neat unreacted epoxy
resin was 31 8C. The short-term (0:1---10
2
sec) behavior at T
g
can be described by a viscoelastic recoverable compliance
which appears to be the same for all amorphous materials,
without secondary viscoelastic dispersions contributions in
this timescale range. A recoverable creep compliance is
found that can be fitted to the Andrade equation [85–87].
J
r
(t) ¼ J
g
þ bt
1=3
,
where J
g
is the glassy compliance which has a value in the
neighborhood of 1 10
9
Pa
1
(1 10
10
cm
2
=dyne); t is
the time; and b is a constant which depends on the choice
of T
g
(q). For the choice of q ¼ 10 8=min it can be seen in
Table 12.1 that b(T
f ,g
) ’ 2 10
9
(Pa sec
1=3
)
1
. The first
three levels of crosslinking yielded viscoelastic liquids (gel
fraction¼0) that flow and exhibit steady-state recoverable
compliances [18]. A material which was extremely close to
the incipient point of gelation was yielded by 45% DDS,
where a macroscopic molecular network just appears. At
this point the recoverable compliance at long times is im-
measurably high; i.e., J
0
e
is operationally infinite. At higher
crosslinker ratios, the equilibrium compliance J
e
of the
molecular network is readily measurable. At 50% crosslink-
ing agent J
e
’ 1:0 10
4
Pa
1
(see Fig. 12.11).
T
g
s of fully cured bisphenol-A-based epoxy resins with
varying crosslink densities were measured during cooling
(58/min) in a pressurized bellows dilatometer (5 MPa). The
crosslinking agent was DDS. The results are shown in
Fig. 12.12. The molecular weights per crosslinked unit,
M
x
, were 420 for Epon 828; 910 for 1001F; 1520 for
1004F; and 2870 for 1007F. The T
g
s obtained were 2048,
1278, 1128, and 101 8C, respectively. The loosest network
epoxy, 1007F, has the highest specific volumes and the
lowest T
g
. The volume changes during the curing of Epon
1001F are shown in Figs. 12.13a and 12.13b. In Fig. 12.13a
the temperature history of the cure is shown along with the
volume changes due to heating, curing, and cooling as a
b
Shell Corp. trademark.
THE GLASS TEMPERATURE / 193
function of time [82]. The volume changes are presented in
Fig. 12.13b as a function of temperature, where the initial
fictive temperature, T
f
, of the reactant mixture and the glass
temperature, T
g
, of the fully cured resin can be seen.
The increase in T
f ,g
during curing has been seen to track
the degree of cure. This can be seen in Fig. 12.14 where five
variables have been monitored during the curing of Epon
1001F at 142 8C which is about 10 8C above the T
g
of the
fully cured material. The degree of cure was monitored by
the increase in density. The gel fraction became measurable
after several hours signaling the presence of a macroscopic
TABLE 12.1. Characterizing parameters.
DDS T
f ,g
a
T
0,J
b
T
0,a
c
J
g
10
10
d
(cm
2
=dyne) b 10
10
d
r(25 8C)
e
(g=cm
3
)
log J
e
f
(cm
2
=dyne) M
x
g
0.25 63.0 64.1 66.3 1.13 1.46 — 5.53 —
0.35 65.0 66.0 65.0 0.685 1.43 1.188 4.10 —
0.40 70.6 69.9 66.4 0.65 1.95 — 3.60 —
0.45 72.5 72.5 69.9 1.45 2.06 1.189 — —
0.50 73.4 75.4 73.7 1.06 1.19 1.191 5.00 2:95 10
5
0.60 80.0 84.9 82.0 1.15 2.63 1.194 5.98 3:10 10
4
0.70 86.4 89.2 88.7 1.24 1.78 1.218 6.43 1:12 10
4
1.0 132.0 135.6 135.5 1.36 1.95 1.205 7.04 680
a
Measured using DSC; all heating rates were 10 8C/min, following cooling at a rate of 10 8C/min (20 8C/min rate of cooling for
0.35 and 0.45 DDS; and 80 8C/min for 1.0 DDS).
b
Reference temperatures that match the softening region on the creep compliance reduced time scale. Reference system was
0.45 DDS.
c
Reference temperatures obtained from the temperature shift factor, a
T
, analysis (see Fig. 12 in Ref. 81).
d
Andrade equation parameters for T ¼ T
0,J
.
e
Density of fully cured samples measured by flotation; followed by pycnometry.
f
For the viscoelastic liquids J
e
is the steady-state recoverable compliance and for the viscoelastic solids, beyond the gel point it
is the equilibrium compliance.
g
Average molecular weight per crosslinked unit calculated from J
e
: M
x
¼ rRTJ
e
.
−2
−10
−9
−8
−7
−6
−5
−4
−3
−2
−1
−9
−8
−7
−6
−5
−4
−3
−2
−1
0
024
0.25 DDS 64.1
0.25 DDS
T
0
°C
0.35 DDS 66.0
0.35 DDS
0.40 DDS 69.9
0.40 DDS
0.45 DDS 72.5
0.45 DDS
0.50 DDS 75.4
0.50 DDS
0.60 DDS 84.9
0.60 DDS
0.70 DDS 89.2
0.70 DDS
1.0 DDS 135.6
1.0 DDS
6
Log t/a
T
(sec)
Log [J(t)−
J
g,0
] cm
2
/dyne
Log [J(t)−
J
g,0
] Pa
−1
8101214
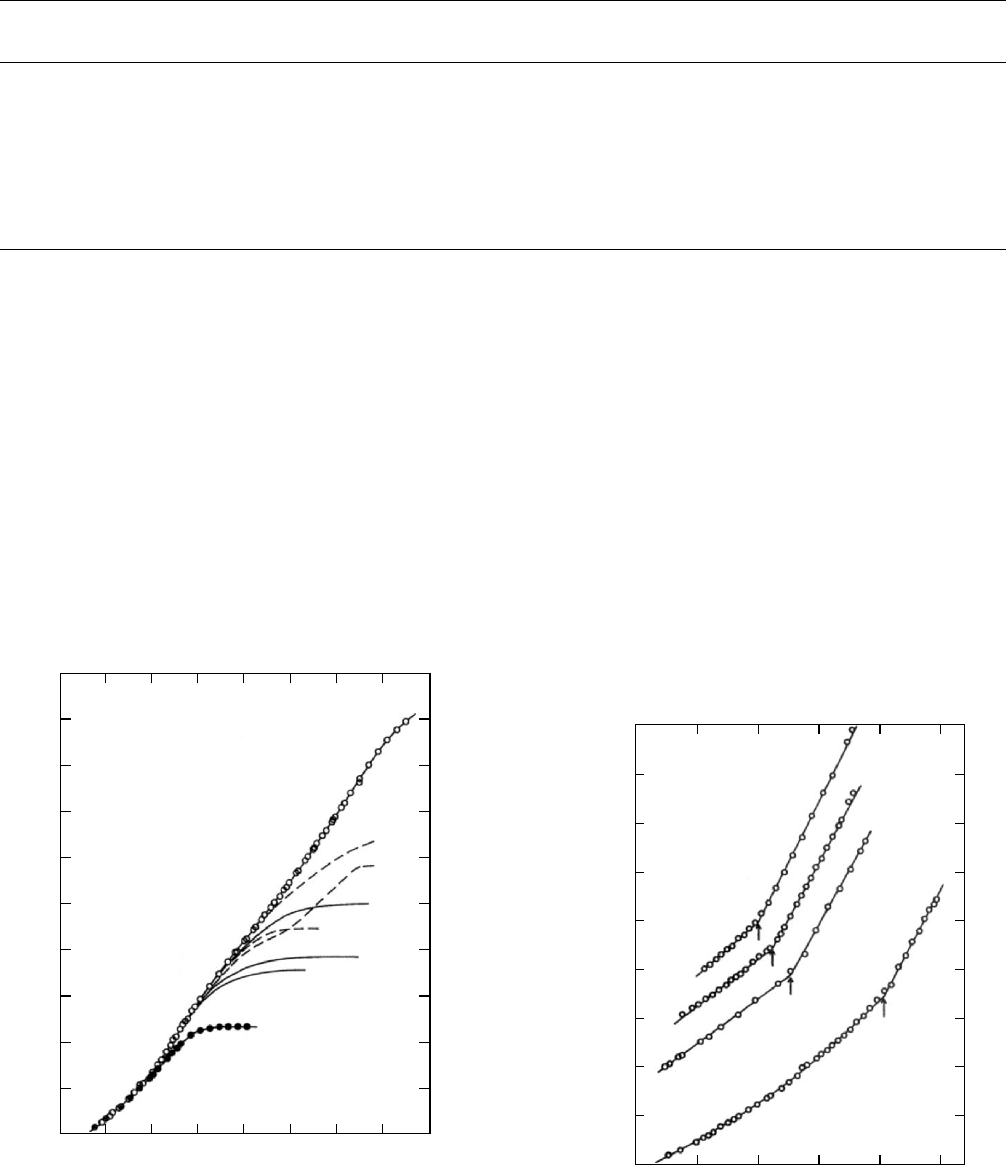
FIGURE 12.11. Comparison of all of the time-dependent
reduced compliance [J(t) J
g,0
] as logarithmic functions of
log t=a
T
. Comparison temperatures are indicated above and
in Table 12.1. J
r
(t) J
g,0
is shown for the viscoelastic liquids
(dashed lines); i.e., specimens with no gel fraction.
050
0.81
0.82
0.83
0.84
0.85
0.86
SPECIFIC VOLUME (ml/g)
0.87
0.88
0.89
0.90
100 150
TEMP (°C)
200
PRESSURE = 5 MPa
COOLING RATE = 5
°/min
828/DDS
1001/DDS
1004/DDS
1007/DDS
250
FIGURE 12.12. Specific volume - temperature curves for four
epoxy resins with increasing crosslink density from 1007/DPS
to 828/DPS. Measurements were made during cooling at
58/min under a pressure of 5 MPa.
194 / CHAPTER 12
molecular network. Before the point of incipient gelation,
the viscosity can be seen to climb toward infinity before
gelation. After gelation, the precipitous drop in the equilib-
rium compliance of the developing network continues until
a complete cure is achieved in about two days. Using the
starting and final T
f ,g
s as limits it can be seen that they
follow the degree of cure.
When an epoxy resin is cured at a temperature which
is below its ultimate T
g
(1) at full cure, the T
f ,g
will
increase rapidly as the reaction proceeds until the T
g
becomes equal and surpasses the temperature of cure
T
c
. The reaction then becomes diffusion-controlled and the
rate of reaction and increase in T
f ,g
decelerates to a
much lower but still perceptible value as can be seen in
Fig. 12.15 [82]. The curing reaction continues significantly
even when T
c
is 50 8 C below T
g
. Room temperature cures
of epoxy resins can therefore be expected to continue
for years.
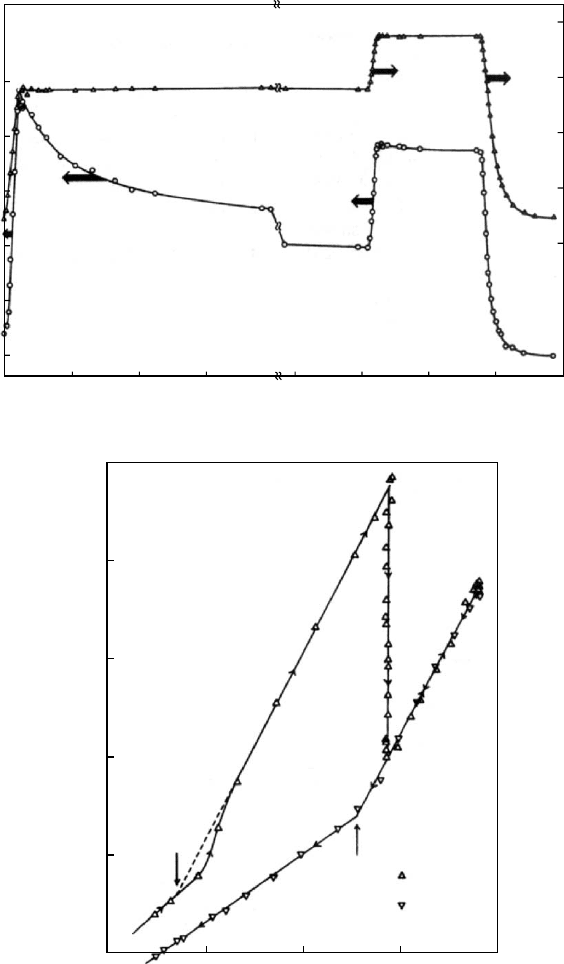
0
(a)
0.83
0.84
0.85
0.86
SPECIFIC
VOLUME
SPECIFIC
VOLUME
SAMPLE
TEMP
0
50
100
150
200
0.87
0.88
246
EPON 1001F/DDS
SPECIFIC VOLUME (ml/g)
SAMPLE TEMP.(°C)
PRESSURE = 5 MPa
848 50
TIME (HOURS)
52 54 56
0
(b)
0.83
0.84
0.85
0.86
0.87
PRESSURE = 5 MPa
HEATING COOLING RATE = 5°/min
EPON 1001F/DDS
0.88
50 100
SAMPLE TEMPERATURE (°C)
SPECIFIC VOLUME (ml/g)
150
- HEATING &
SOAKING
- COOLING
T
g
T
f
200
FIGURE 12.13 (a) Specific volume - temperature history of 1001F/DDS epoxy resin during curing under a pressure of 5 MPa.
(b) Specific volume data from Fig. 12.13a plotted as a function of the temperature.
THE GLASS TEMPERATURE / 195
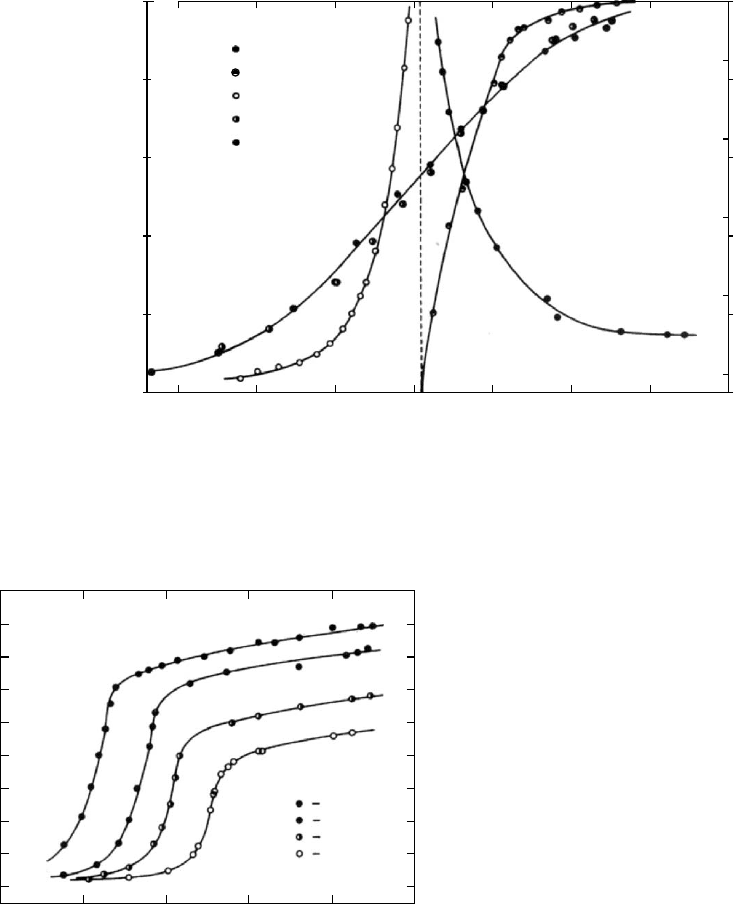
12.7 DEPENDENCE OF T
g
ON THE DEGREE OF
CRYSTALLINITY AND MORPHOLOGY
Nearly all crystalline polymers contain chain segments
that do not reside in a crystalline lattice. Usually these
noncrystalline segments can be considered to constitute an
amorphous phase which therefore can become glassy. The
T
g
of this amorphous phase depends on the degree of crys-
tallinity. T
g
increases and decreases with the presence of
crystallinity. It can increase or decrease with the degree of
crystallinity depending on the relative density of the
amorphous and crystalline states. Most often the more or-
derly crystalline state has the higher density at T
g
and the
noncrystalline molecular chains are constrained by being
anchored to the immobile crystallites and T
g
increases. On
rare occasions the crystalline state has a lower density than
the amorphous material [88]. In this case, less constraint on
the noncrystalline chain segments increases the entropy
causing T
g
to decrease. T
g
is not a unique function of the
degree of crystallinity. At least in the usual case where the
density of the crystalline state at T
g
is higher than that of the
amorphous state, the temperature at which the crystallites
are formed plays a dominating role. At temperatures above
the maximum in the crystal growth rate [89], and of course,
below the melting temperature T
m
, the rate of nucleation is
low and therefore relatively few spherulites are formed and
the tie molecules in between crystallites are relatively un-
constrained. Hence the increase in T
g
with increased crys-
tallinity is relatively slight [89] as seen in Fig. 12.16.
However, at temperatures below the maximum in crystal
growth rate and near T
g
, the rate of nucleation can be
profuse. Many crystallites are formed and tie molecules
are therefore shorter and more constrained. Therefore a
given degree of crystallinity is more effective in raising T
g
(see Fig. 12.17). The above conclusions are drawn from the
mechanical results reported by Groeninckx et al. [89] where
the onset of the steep decrease in log E
r
(10) with tempera-
ture can be considered as a rough estimate of T
g
. Direct
confirmation with proper T
g
measurements is desirable.
0
0.2
0.4
0.6
0.8
1.0 5.0
Degree of cure
Gel Fraction
Log h
T
f
Log J
e
4.5
4.0
3.5
Degree of cure & Gel Fraction
Logh (poise)
Tf (°C)
Log J
e
(cm
2
/dyne)
3.0
34
Log t
c
(sec)
5
EPON 1001 F/DDS
6
40
60
80
100
120
−8.0
−7.5
−7.0
−6.5
−6.0
−5.5
FIGURE 12.14. Comparison of changing parameters during the curing of 1001F/DDS at 142 8C. The logarithm of the viscosity
h(p) and the equilibrium compliance J
e
(cm
2
=dyn) as well as the fictive temperature T
f
, the degree of cure, and the gel fraction are
shown as functions of the logarithm of the time of curing T
c
(s).
6
100
80
60
40
T
CURE
°C
54
Log t
CURE
(sec)
3
−20
0
20
40
T
1
(°C)
60
80
100
120
140
EPON 828/MDA
2
FIGURE 12.15 Fictive temperatures, T
f
, observed during the
curing of an epoxy resin at temperatures below the T
g
(1)of
the fully cured state.
196 / CHAPTER 12
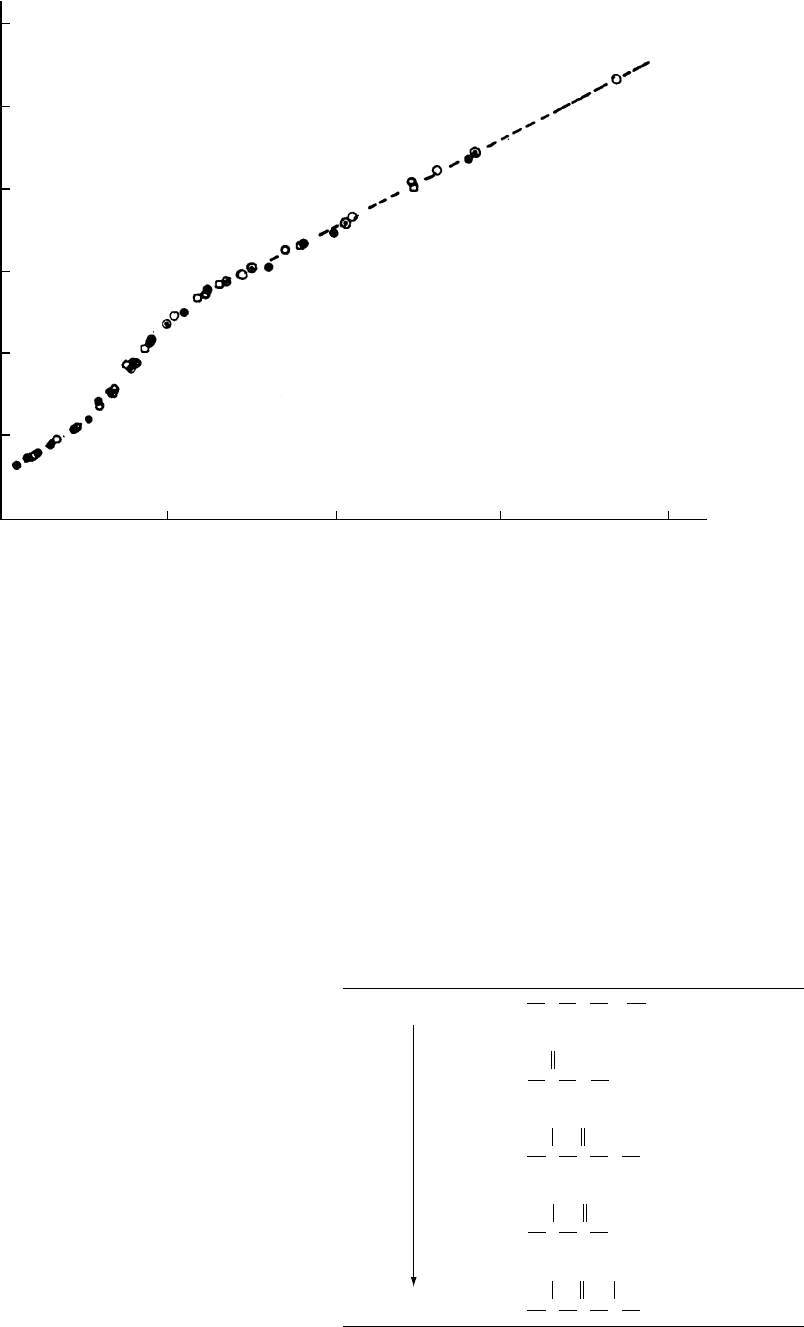
12.8 DEPENDENCE OF T
g
ON INTERMOLECULAR
FORCES
The greater the intermolecular interaction, all other things
being equal, the higher T
g
will be. It has been proposed that T
g
is a linear function of the cohesive energy density CED [90].
CED ¼ 0:5MRT
g
25M,
where R is the gas constant and M is a parameter analogous to
the number of degrees of freedom of a molecule. Eisenberg
has shown how T
g
increases dramatically in a phosphate
glass with the decrease in size of incorporated anions
and with increases in their charge [91]. He has also shown
how in ionomers (specifically ethyl acrylate-acrylic acid
copolymers neutralized with various cations) T
g
is a
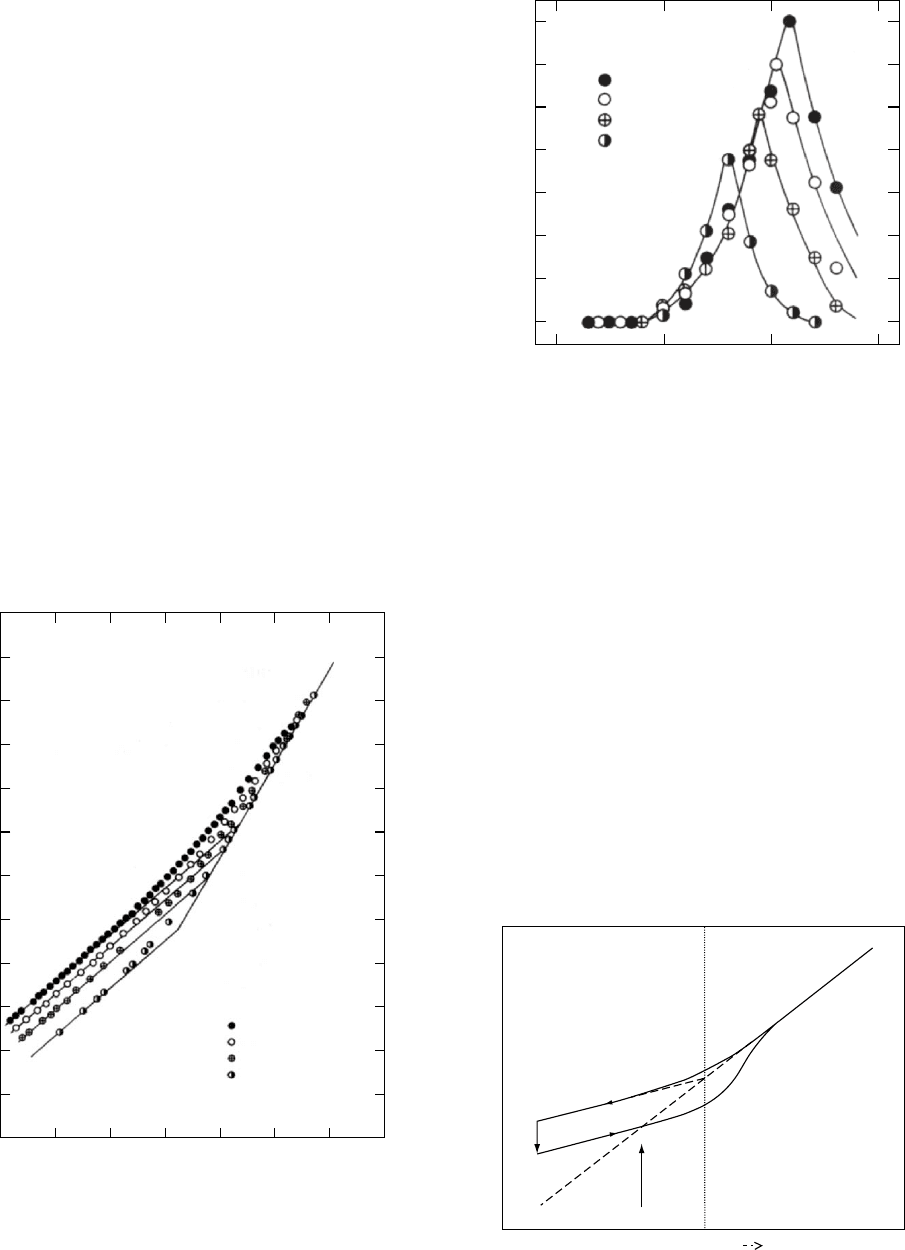
common smoothly increasing function of c q/a as shown
in Fig. 12.18. c is the cation concentration, q is its charge,
and a is the distance between centers of charge, as shown in
Fig. 12.18. The onset of the observed sigmoid coincides with
the domination of a wide range of properties by ionic clusters.
12.9 THE EFFECT OF PRESSURE ON T
g
An increase in pressure on an amorphous material in-
creases molecular crowding and interactions along with
decreasing the entropy. Regardless of the variable which
one looks upon as significant, an increase in T
g
is expected.
If a rapid pressure increase is incurred, a time-dependent
decrease in volume will follow if the temperature is near or
below T
g
. This is indeed a simple voluminal viscoelastic
creep process. The resultant behavior is quite analogous to
that seen following a temperature quench as discussed
above. The similar response to pressure jumps has been
shown by Goldbach and Rehage [92]. The expected increase
in T
g
with increases in pressure has been documented by
McKinney and M. Goldstein [93]. Discussions in the litera-
ture are confounded by not restricting the definition of T
g
to
cooling from an equilibrium state.
12.10 EFFECT OF MOLECULAR STRUCTURE
ON T
g
12.10.1 Internal Plasticization and Chain Stiffness
If side chains on the polymer backbone are increased in
length only, it is generally observed that T
g
decreases, os-
tensively because the linear side chains increase the frac-
tional free volume between the chains and any structural
change which increases the diameter of the side chains
reverses the tendency; i.e., T
g
increases. This is a reflection
of the following general principle.
Any structural feature which increases the size of the
jumping unit of the molecular chain will increase T
g
.An
60
10
8
10
9
10
10
80 100 120
Temperature(°C)
Amorphous
14.5 % (11 min)
28.5 % (22 min)
40 % (27 min)
50 % (30 min)
E
r
(10)(dynes/cm
2
)
FIGURE 12.16. Ten-second stress relaxation moduli E
r
(10)
of PETcrystallized at 2278C to different degrees presented as
a function of temperature. Crystallization times are also
shown as well as the estimated degree of crystallinity from
density measurements. (From Groeninckx, Berghmans, and
Smets, by permission, [89].)
60
10
9
10
10
80 100
Amorphous
23.5 % (4 min 1/2)
29.5 % (5 min 1/2)
34 % (17u)
E
r
(10)(dynes/cm
2
)
Temperature(°C)
120
FIGURE 12.17. Ten second stress relaxation moduli E
r
(10)
of PETcrystallized at 1208C to different degrees presented as
a function temperature. (From Groeninckx, Berghmans, and
Smets, by permission, [89].)
THE GLASS TEMPERATURE / 197
increase in chain stiffness resulting from longer rigid units
in the chain backbone or more bulky side groups which
drastically increase the potential barriers to rotation, cause
substantial increases in T
g
. Steric barriers to rotation are
raised appreciably if a second side group is introduced on
alternate chain backbone atoms. The pairs, polymethyl-
methacrylate PMMA (T
g
’ 115c)-polymethylacrylate
PMA (14 8C) and poly(a-methylstyrene) (168 8C)-
polystyrene (100 8C), illustrate the effect. Introducing para-
phenyl rings into a chain backbone increases T
g
since a
longer portion of the chain has to be involved in a molecular
segmental displacement. To the contrary introducing add-
itional methylene (-----CH
2
-----) groups or ether oxygens into
the polymer chain backbone lowers T
g
because of the in-
creased chain flexibility. With no side atoms or groups and a
wide open bond angle (> 1118) the ether oxygen is consid-
ered the premier flexibilizing unit.
12.10.2 Effect of Polarity
The stronger the interactions between neighboring poly-
mer chain segments, the greater the thermal kinetic energy
must be to create holes of sufficient size to allow a diffusive
jump of a chain segment to occur. Therefore, the greater the
polarity of a polymer, the higher the T
g
will be. The greatest
effect will be due to resultant components of dipole units
which are perpendicular to the chain backbone. The greater
T
g
of polyacrylonitrile ( 103 8C) relative to that of poly-
propylene ( 14 8C) must be due to the large electron
affinity of the nitrile group (-----C N).
Enhancing the flexibility of a polymer chain by introdu-
cing an ether oxygen into its backbone will lower T
g
and the
melting temperature, T
m
. Increasing the polarity or the op-
portunity for hydrogen bonding between neighboring chain
segments increases T
g
and T
m
. The effects of such variations
are illustrated in Table 12.2 where the coupling units are
varied in a family of otherwise similar polymers.
200
100
T, (⬚C)
0
0 0.1 0.2
cq/a
0.3 0.4
FIGURE 12.18. T
g
of ethyl acrylate - acrylic acid copolymers neutralized with various cations shown as a function of cq/a, where c
is the cation concentration, q is its charge, and a is the distance between centers of charge. (From Matsuura and Eisenberg, by
permission, [91b].) Different symbols represent different cations.
TABLE 12.2. Effect of polarity and hydrogen bonding.
R
O polyethers
polyesters
polyurethanes
polyamides
polyureas
O
Low T
g
s and T
M
s
High T
g
s and T
M
s
C
CN
O
O
O
H
CN
O
N
H
H
CN
OH
R⬘
198 / CHAPTER 12