Mark James E. (ed.). Physical Properties of Polymers Handbook
Подождите немного. Документ загружается.


TABLE 18.2.
Continued.
Polymer
Mw
(kDa) Solvent
Temp.
(8C)
Pressure
(MPa)
Polym.
Conc.
(wt%)
Phase
Behavior Ref. Technique Modeling
Ethylene copolymers
Ethylene-
co-propylene
0.8–96 Propylene
10–200 30–46 15 ULCST, LCST [39]
LCST
[39]
Butene/
Ethylene
25–200
1.5–40 15
LCST
[39]
Hexene/
Ethylene
25–200
1–27 15
UCST, LCST [39]
0.8–96 Propylene 100, 150 18–42
0.8–33 LCST
[40]
SAFT
Ethylene
20–200 57–172 3.8, 16 ULCST [40]
SAFT
5.9 Propylene 100, 150 18–30 1.8–33
LCST
[41]
Ethylene-co-methyl acrylate 69–279
n-Butane
135–210 60–250 5 UCST
[29]
Ethylene-co
- methyl acrylate 75–99 Ethane
160–175 230–260 5 UCST
[28]
SL with temperature-
Propane
45–170 100–280 5 UCST
dependent mixing
Ethylene
25–130 120–260 5 UCST
parameters
Propylene 25–135 40–140 5 UCST
99
n-Hexane
Propane other
145–155 80–260 5 UCST
[42]
Propane
70–160 150–220 5 UCST
[42]
Propane / 10
%alcohol
70–160 80–240 5 UCST
[42]
Ethylene-co
-methyl acrylate 110–128 Ethylene
100–220 118–211 5 UCST
[34]
PC-SAFT
Ethylene-co
-methyl acrylate 34–59 Propane
65–160 60–200 5 UCST
[43]
SL
Propane / 0–9%
Ethanol
65–160 45–200 5 UCST, Flat
Propane / 0–41%
Acetone
40–140 25–175 5 UCST, Flat
SL
CHCIF
2
65–150 6–30 5 LCST
CHClF
2
/ 0–39%
Ethanol
65–150 3–20 5 LCST
CHClF
2
/ 0–39%
Acetone
65–150 3–25 5 LCST
Ethylene-
co-methyl acrylate 75–185 Ethylene
30–240 125–270 5 UCST
[44]
Ethylene-co
-ethyl acrylate 117–157 Ethylene
80–260 98–163 5 UCST
[34]
PC-SAFT
Ethylene-
co-propyl acrylate 112–147 Ethylene
80–260 98–153 5 UCST
[34]
PC-SAFT
Ethylene-co-butyl acrylate 35–297 Ethylene
50–245 75–180 5 UCST
[44]
SAFT
Ethylene-
co-acrylic acid
24–247 1-Butene
120–220 50–250 5 UCST
[29]
Ethylene-
co-methyl methacrylate 20–84 Ethylene
80–255 104–186 5 UCST
[34]
PC-SAFT

TABLE 18.2.
Continued.
Polymer
Mw
(kDa)
Solvent
Temp.
(8C)
Pressure
(MPa)
Polym.
Conc.
(wt%)
Phase
Behavior Ref. Technique Modeling
Polystyrene
Polystyrene
20
Diethyl ether
70–170 5–200 15.4 LCST
[45] Turbidity
Polystyrene
110
Diethyl ether/
Acetone
100–200 0–31 10 UCST, LCST
[45]
Polystyrene
4,9
n-Butane
120–200 4–65 0.5–80 LCST(high, low
polymer concn)
USCT(inter-
mediate concn)
[46] Laser
turbidity CP,
variable vol.
9
n-Pentane 130–220 4–35 5–80
LCST(high, low
polymer concn)
USCT(inter-
mediate concn)
[46]
0.4–3 Ethane
40–60 8.5–34 0.001–20 LCST
[47] Sampling
0.4–1.1 CO
2
40
25 0.01–1 NR
[47] Sampling
0.4–1.6 Ethane / 13%
Propane
40
25 1–10 NR
[47] Sampling
1,9
Propane
50–180 25–67 0.2–4 UCST
[48]
114, 929 Dichloro-trifluoro-
ethane
75–145 3–35 0.03–7.3 LCST
[49]
Polystyrene
270
trans-decahydro-
naphthalene
1–16 10–90 4.2–21.6
(vol%)
UCST
[50] Light Scattering
SL
Isotactic
22
n-Butane
155–201 9–13 13–26 LCST
[51] Visual CP, constant vol.
Other hydrocarbon
polymers
Polypropylene
CO
2
163–208 45–95 6.7–38 UCST
[52] Laser CP, constant, vol.
Atactic polypropylene 6 (
M
v
)CO
2
25, 32 13.5 0.15–0.25 LCST
[53]
Poly(1-butene)
n-Butane
167–190 12–17 5.5–21 LCST
[52]
CO
2
132–146 30–90 6.3–38 UCST
[52]
Poly(1-butene) (atactic) 0.4–1.3 (
M
v
)CO
2
30–33 17.9–23.4 0.6–1
[53]
Polybutadiene
5(M
v
)CO
2
25
19.3 0.27
[53]
Polyisobutylene 0.5(
M
v
)CO
2
25
20.3 0.44 NR
[53]
Polyisobutylene 50
n-Butane
155–200 7–10 18.8–31.4 LCST
[51] Visual CP
constant vol.
Polyisobutylene
(telechelic)
1–11 Propane
25–150 25–45 7
LCST,
ULCST
[54] Visual CP
constant vol.
SAFT
1–11 Dimethyl ether 75–150 45–65
5
ULCST,
LCST
[54]
SAFT
0.2–11 Ethane
25–150 2–120 9–43 LCST,
UCST
(high MW)
[54]
SAFT
0.2–1 CO
2
50–180 4–200 5–52
[54]
SAFT
Polyisobutylene 1.25
Propane
90–113 4–7 27.1 LCST
[55] Sampling

TABLE 18.2.
Continued.
Polymer
Mw
(kDa)
Solvent
Temp.
(8C)
Pressure
(MPa)
Polym.
Conc.
(wt%)
Phase
Behavior Ref. Technique Modeling
Acrylate or Methacrylate
Polymers
Poly(methyl methacrylate) 10.6 CHClF
2
/Acetone 65–155 2.5–25 5
LCST [43] Visual CP, variable vol.
Poly(methyl methacrylate) 50
CHClF
2
75–150 3–30 0.08–0.26 LCST [56]
Visual CP, variable vol.
Poly(methyl methacrylate) 74
CHClF
2
65–140 3–29 0.03–15 LCST [57]
Visual CP, variable vol. SL-HB
h
Poly(methyl methacrylate) 104.7 Propylene
154–259 108–270 5
UCST [34]
PC-SAFT
Poly(ethyl methacrylate) 280 CHClF
2
75–140 3–25 0.08 LCST [56]
Poly(butyl methacrylate) 65.5 Ethylene
100–235 103–138 5
UCST [34]
PC-SAFT
Poly(decyl methacrylate) 250–730 Isooctane
230–320 1.5–7.5 5–30 LCST [58]
Polystyrene-b
-poly(methyl
methacrylate)
70
CHClF
2
110 21
0.08
[56]
Poly(methyl acrylate) 2.03 CO
2
25 22–54 1–6
[15]
2.85 CO
2
25–50 67–102 1–10 LCST [15]
Poly(methyl acrylate) 30.7 CHClF
2
64–136 2.5–22.5 5
LCST [43]
Poly(methyl acrylate) 186.9 Propylene
200–258 140–275 5
UCST [34]
PC-SAFT
Poly(ethyl acrylate)
153.7 Ethylene
81–260 101–161 5
UCST [34]
PC-SAFT
Poly(propyl acrylate) 108.3 Ethylene
80–258 87–109 5
UCST [34]
PC-SAFT
Poly(n-butyl acrylate) 30–940 Nitrous oxide
75 10.3–51.7 0.006–0.03
[59]
Aliphatic Polyesters
Poly(
«-caprolactone) 14.6, 40.5 CHClF
2
55–145 3–35 0.03–19 LCST [57]
SL-HB
Poly(
L
-lactic acid)
50
CHClF
2
55–150 3–28 0.08 LCST [56]
Constant vol.
Poly(
L
-lactic acid)
1–10 CO
2
/10–40%
CHClF
2
55–65 7–20 0.001–0.05 LCST [60]
Flow cell sampling
Poly(
L
-lactic acid)
1–2.1 CO
2
/0–1% Acetone 55–65 7–20 0.001–0.05
LCST [61] Flow cell sampling
Poly(
L
-lactic acid)
1–2.1 CClF
3
55 11–12
<0.5 NR
i
[61] Flow cell sampling
Poly(
D
,L
-lactic acid)
0.9 CO
2
55 20
<0.5 NR
[61]
Poly(glycolic acid)
NR CO
2
55 18–20
<0.5 NR
[61]
Poly(lactic-co
-glycolic acid) 70–149 CO
2
33–97 131–300 5
Nearly
athermal
[62]
Poly(lactic-
co-glycolic acid) 128–130 CHF
3
27–81 54–147 5
LCST [62]
Poly(lactic-co
-glycolic acid) 70–130 CHClF
2
36–72 1.5–24 5
LCST [62]
Poly(g-hydroxybutyrate) 800 CO
2
35–75 12–35 0.05–1 LCST [63]
Extraction
Polyethers
Polyethylene glycol
0.4–0.6 CO
2
40 20
0.25–1.25 NR
[64]
SL
Poly(ethylene glycol) 0.2–0.6 CO
2
40 20
0.05–4 NR
[65] Sampling
Poly(propylene glycol)
(Low polydispersity)
0.45–2.16 Ethane
20–100 5–30 0.5–4 ULCST [66]
SL-HB
Poly(propylene oxide) 3.5 CO
2
50–70 98–135 5
UCST [15]
PEG/nonylphenylether 2.5 CO
2
45;60 12–30 0.005–0.07 LCST [67]
extraction

TABLE 18.2.
Continued.
Polymer
Mw
(kDa)
Solvent
Temp.
(8C)
Pressure
(MPa)
Polym.
Conc.
(wt%)
Phase
Behavior Ref. Technique Modeling
Siloxane Polymers
Poly(dimethyl siloxane)
135
CO
2
25, 52 19.3 0.3, 1 UCST [53]
Poly(dimethyl siloxane)
13
CO
2
22 25–32 1–10
[68] Visual CP, constant vol.
Poly(dimethyl siloxane-co-
methylhydrosiloxan-g-
propyl acetate); other
side chains also reported
Degree of
polymerization
¼ 25
CO
2
22 12–35 0.4–5.5 NR [69] Transmitted
light
intensity
Fluorinated Polymers
Poly(hexafluoro-propylene oxide) 13.6
CO
2
22 6–15 1–10
[68] Visual CP, constant vol.
Poly(tetrahydroperfluoro-
decylacrylate)
CO
2
10–70 5–25 0.087–7.32 LCST [70] Visual
CP, variable vol.
Poly(vinylidene fluoride)
180; 275 CHClF
2
120–180 71–73 5
UCST [71]
CHClF
2
129–207 72–76 5
Poly(vinylidene fluoride)
180; 275 CO
2
140–200 159–165;
158–170
5
UCST [71] Visual CP, variable vol.
125–220
Poly(vinylidene fluoride)
180; 275 CHF
3
170–225 180–230 5
UCST [71]
Poly(vinylidene fluoride)
Dimethyl ether
LCST [71]
Poly(1,1-dihydroperfluorooctylacrylate) 1,400
CO
2
30–90 10–200 0.09–16 LCST [72]
SAFT
Poly(tetrafluoroethylene-
co-vinyl
acetate)
140–180 CO
2
25; 75–128 50–56 1–10
[73] Visual CP, variable vol.
74–90 5
LCST
Methacrylate, perfluorinated propylene
oxide graft copolymers
6.2–11
CO
2
40 16–42 1–28
[74]
Other Polymers
Cellulose triacetate
145.7
Ethyl acetate 185–235 3.5–8.5 0.5–5
LCST [75] Visual CP, variable vol.
Poly(vinyl acetate)
CO
2
25 63–66 3–6 NR [73] Visual
CP, variable vol.
Poly(vinyl acetate)
0.98–585 CO
2
25 13.6–67.6 1–12 NR [15]
Poly(vinyl acetate)
585
CO
2
17–207 67–125 5
LCST [15]
Poly(«-caprolactam)
Trifluoroethanol /
0–48% CO
2
25–100 13–35 3–14
[76]
SAFT, SL
Poly(«
-caprolactam)
CO
2
233–241 40–50 13.8–16.5 UCST [52]
a
Cloud point determined by eye.
b
Phase boundary nearly independent of temperature.
c
Sanchez–Lacombe equation of state.
d
Statistical associating fluid theory equation of state.
d
Viscosity average molecular weight.
e
Constant volume view cell.
f
Perturbed chain SAFT model.
g
Peng-Robinson-Stryjek-Vera equation of state.
h
Sanchez–Lacombe hydrogen bond model.
i
Not reported.

shown in Eq. (18.1), where the mass fraction of sorbed SCF
(w
SCF
) is proportional to the partial pressure of the SCF,
P
SCF
.
w
SCF
¼ k
H
P
SCF
: (18:1)
The Henry’s law constant, k
H
, is independent of molecular
weight except at extremely low molecular weight (< 1kDa),
but is often a strong function of temperature, typically
showing an Arrhenius-like dependence. The slope of the
Arrhenius plot can be correlated with the enthalpy of dis-
solution of the SCF in the polymer [78]. An alternate cor-
relation based on corresponding states suggests that k
H
should scale with (T
c
=T)
2
, rather than with 1/T [79]. How-
ever, the proportionality constant for (T
c
=T)
2
scaling is not
a universal constant. Over the temperature range common
for SCF-polymer mixtures, little difference is detectable
between 1/T scaling and 1=T
2
scaling, so data are presented
here with the 1/T scaling. The solubility of the SCF in the
polymer may either increase with temperature (for polymer-
SCF pairs exhibiting UCST phase behavior), or solubility
may decrease with increasing temperature (for polymer-SCF
pairs exhibiting LCST phase behavior.) Hence, the Arrhe-
nius coefficient for k
H
may be either positive or negative.
Table 18.3 lists Henry’s law constants for rubbery and
molten polymers. The temperature dependence of the
Henry’s law constants are correlated with absolute tempera-
ture via the Arrhenius expression:
ln (k
H
) ¼
A
T
þ B, (18:2)
where k
H
(from Eq. (18.1)) has units of mass fraction per
MPa, and T has units of degrees Kelvin.
Care should always be exercised when using solubility
data for glassy or crystalline polymers (not included
here), because SCF sorption occurs preferentially in the
amorphous phase, which may additionally experience
swelling-related stress. Solubility data for CO
2
in solid
polymers is compiled in [5]. Often, the pressure dependence
of SCF sorption in glassy polymers follows a dual-mode
sorption model, with substantial deviations from Henry’s
law.
Solubility of SCFs in polymers is determined experimen-
tally by one of several general techniques. Gravimetric
techniques monitor the in situ weight gain of a polymer
sample exposed to a surrounding high pressure SCF. These
techniques require the application of a buoyancy correction
term to the raw data, since the polymer swells upon expos-
ure to the SCF. The swollen volume may be measured
experimentally, or it may be estimated using an equation
of state, typically the Sanchez–Lacombe model. Another
experimental technique measures mass gain of a polymer
exposed to an SCF by monitoring the change in resonant
frequency of an oscillating sensor, typically a quartz crystal.
The amount of SCF sorbed in a polymer may also be
determined by recording the pressure decay in a reservoir
of SCF in contact with the polymer.
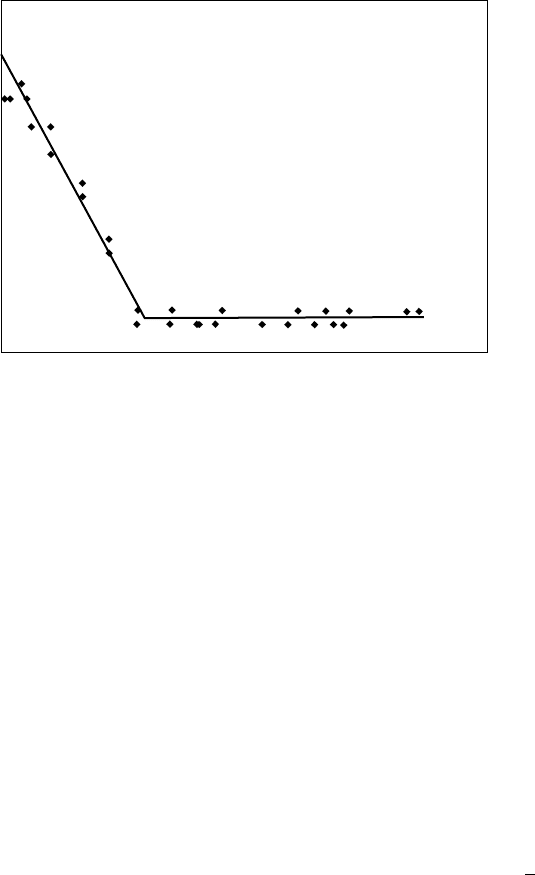
18.3 MELTING POINT DEPRESSIONS
OF POLYMERS IN THE PRESENCE OF SCFS
The melting temperature (T
m
) of a semicrystalline poly-
mer is usually lower in the presence of a soluble SCF than it
is in the pure polymer at ambient pressure. When a polymer
crystallizes from an SCF-saturated solution, the resulting
three-phase (S–L–G), two-component equilibrium is univar-
iant, according to the phase rule, so T
m
is only a function of
pressure under these conditions. Experimental measure-
ments of the polymer melting point in the presence of an
excess of CO
2
typically exhibit the pressure dependence
shown in Fig. 18.3. The melting temperature decreases
approximately linearly with increasing pressure above am-
bient conditions, then it abruptly levels off to a near constant
value. Occasionally, some deviations from this behavior are
seen: (1) a small (1–28C) increase is T
m
is sometimes
recorded at low pressure, before the linearly decreasing
region occurs. This is attributed to annealing of small crys-
tallites; (2) at very high pressure, following the plateau zone,
T
m
sometimes begins to increase with increasing pressure;
and (3) the plateau zone where T
m
is constant is sometimes
missing, so that a region of linearly decreasing T
m
is fol-
lowed immediately by a region of linearly increasing T
m
.
The qualitative features of the SCF-saturated melting point
curves are similar for polymers and for sparingly soluble
low molecular weight crystalline compounds such as naph-
thalene and biphenyl [100].
The melting point of a polymer saturated with an SCF is
determined experimentally either visually, or else by high
pressure calorimetry, although the pressure range for the
latter is often limited by instrument constraints to a few
MPa. Table 18.4 presents values of dT
m
=dP in the linear
region (low pressure) for polymers saturated with an SCF. In
cases where an increase in T
m
occurred at very low pressure,
as in Fig. 18.3, the lowest pressure points were not included
in the linear least squares line fitting. When the experimen-
tal pressures were high enough so that the second (plateau)
region could be seen, this has been noted in the Comments.
18.4 SCF-INDUCED T
g
DEPRESSION
Sorption of an SCF in a polymer can lower its glass
transition temperature (T
g
) significantly below that seen at
atmospheric pressure. For a given polymer, the glass transi-
tion temperature depression is found to increase as the
amount of SCF sorbed increases [105]. Because CO
2
solu-
bility usually decreases with increasing temperature, it is
possible for a polymer/CO
2
mixture at elevated pressure to
undergo a liquid-to-glass transition as the temperature is
raised. This phenomenon, referred to as ‘‘retrograde vitrifi-
cation’’ [18], has been observed for poly(methyl methacry-
late) [105,106]. Table 18.5 reports the pressure dependence
of T
g
observed for polymers which have been exposed to
a high pressure SCF. T
g
depression curves look similar to
POLYMERS AND SUPERCRITICAL FLUIDS / 327

TABLE 18.3.
Henry’s law constants of SCFs in Polymers.
Polymer
Diluent
Temp.
Range (C)
Pressure
(MPa)
k
H
(mass
fraction/MPa)
A (Eq.
(18.2))
B (Eq.
(18.2)) Ref. Technique
Comments
Polyethylene
CO
2
185–227 0.7–2.0
171
4.87 [77] Pressure decay
[80]
Polyethylene, branched
CO
2
125–250 NR
546
6.235 [81] Gas–liquid
chromatography
Polystyrene
CO
2
65–129 4–44
[82] MSB
a
and
pressure decay
Polystyrene
CO
2
100–200 2–20
1080
8.081 [83] MSB
SL
b
Polystyrene
n-Butane 75–200 0.1–3
2034
8.231 [84] Volumetric Only mass fraction
<0.05 used
in fitting
Polystyrene
Isobutane 75–200 0.1–3
1846
8.094 [84] Volumetric Only mass fraction
<0.05 used
in fitting
Polystyrene
HCF
2
Cl 85 0–2.5 0.0539
[85] QCM
c
Polypropylene
CO
2
160–200 5.4–17.5
760
6.637 [86] Pressure decay SL used for swelling correction
Polypropylene
n-Butane 165–210 0.3–3.1
2366
8.144 [84] Volumetric
Polypropylene
Isobutane 165–210 0.3–3
2025
7.637 [84] Volumetric
Poly(methyl methacrylate)
HCF
2
Cl 70 0–1 0.153
[85] QCM
Poly(
«-caprolactone)
CO
2
70–85 0.2–6.5
1131
7.524 [87] Quartz spring
microbalance
SL
Poly(butylene succinate)
CO
2
50–180 1–20
1038
7.528 [88] MSB
SL used for swelling correction
Poly(lactic-
co-glycolic acid) (48L/52G) CO
2
40 1–3 0.0152
[89] Gravimetric
Poly(lactic-
co-glycolic acid) (53L/47G) CO
2
40 1–3 0.0162,
0.0164
[89] Gravimetric
Poly(lactic-
co-glycolic acid) (54L/46G) CO
2
40 1–3 0.0195
[89] Gravimetric
Polyethylene glycol
CO
2
65–100 4–14
1687
8.807 [90] Sampling
SAFT
d
modeling
Polyethylene glycol
CO
2
40 5–11 0.0198
[91] NIR
e
Polypropylene glycol
CO
2
25 2–6 0.0294
[91] NIR
Polypropylene glycol
CO
2
35 2–6 0.0200
[91] NIR
Poly(phenylene oxide)
CO
2
150 2–20 0.00524
[92] MSB
SL used for swelling correction
Poly(phenylene oxide)
CO
2
200 2–20 0.00405
[92] MSB
SL used for swelling correction
Poly(vinyl acetate)
CO
2
40–100 0.2–17.4
1882
9.344 [83] MSB
SL used for swelling correction
a
Magnetic suspension balance.
b
Sanchez–Lacombe equation of state used.
c
Quartz crystal microbalance.
d
Statistical associating fluid theory.
e
Near infrared spectroscopy.
melting point depression curves – a near linear decrease of
T
g
with increasing pressure is seen at low pressures. How-
ever, the typical magnitude of the slope of the T
g
vs. P curve
is considerably higher (about 5–10 times) than the typical
magnitude of the T
m
vs. P curve (e.g., from Table 18.4). An
equation of state can be used to predict SCF-induced T
g
depression, using either an isofree volume condition or the
isoconfigurational entropy condition of the Gibbs-DiMarzio
criterion.
18.5 INTERFACIAL TENSION BETWEEN SCF
AND SCF-SWOLLEN POLYMER
The interfacial tension (IFT) between an SCF-swollen
polymer and the saturating SCF decreases with pressure,
as the solubility of the SCF in the polymer increases. For
polymers which exhibit complete miscibility with the SCF
at an experimentally achievable pressure, the IFT will van-
ish as the pressure approaches the apex of the P–x curve.
Several comprehensive studies of the IFT of polymers swol-
len with CO
2
have been conducted; these are summarized in
Table 18.6. These studies indicate that the molecular weight
of the polymer does not influence IFT, probably because
SCF solubility in the polymer is independent of molecular
weight. For mixtures exhibiting LCST phase behavior, tem-
perature has a minor effect on IFT, because the decrease in
IFT associated with increasing temperature in pure poly-
mers is largely offset by an increase in IFT due to decreased
solubility of the SCF in the polymer. Plots of IFT vs. CO
2
pressure typically show a steep decreasing slope at lower
pressure, followed by a more gradual decrease at higher
pressure. The values of IFT in Table 18.6 were measured
by analyzing the shape of a pendant drop.
18.6 VISCOSITY OF POLYMER/SCF
MIXTURES
Because SCFs typically have lower density and higher
compressibility than a pure polymer melt, dissolution of the
SCF into the polymer melt results in swelling of the poly-
mer. This in turn leads to an increase in free volume of the
mixture, so transport properties such as viscosity and diffu-
sion coefficient can be significantly enhanced. The semi-
empirical Doolittle equation [128,129] predicts that the
zero-shear rate viscosity, h
0
, of a polymer is exponentially
related to the fractional free volume, f, via:
h
0
¼ A exp B
1
f
1
: (18:3)
A viscoelastic shift factor, a
S
, can be found from the ratio
of the experimentally measured zero shear rate viscosity (at
test conditions of P, T, and SCF concentration), to the
experimentally measured zero shear rate viscosity (at some
reference conditions of P
ref
, T
ref
, and reference SCF con-
centration). Once a
S
is determined experimentally, a master
curve can be constructed by plotting h=a
S
vs. a
S
_
gg where h is
the measured viscosity and
_
gg is the measured shear rate. If
the fractional free volume, f, is estimated from an equation
of state as f ¼ 1 r=r
, where r is the mixture density and
r
is the mixture close-packed density, then the shift factor
due to the presence of the SCF can be calculated from Eq.
(18.3), provided the constant B is known. Experimentally, B
for SCF-swollen polymers has been found to be near unity
[130,131], in agreement the universal constants of the WLF
equation [132] for the temperature dependence of pure
polymers.
Pressure
Melting temperature
FIGURE 18.3. Representative plot of melting point depression of polymer exposed to CO
2
. Lines are added as a guide to
the eye.
POLYMERS AND SUPERCRITICAL FLUIDS / 329

TABLE 18.4.
Melting point depressions of semicrystalline polymers saturated
with CO
2
.
Polymer
M
w
(kDa)
T
m0
(8C)
dT
m
=dP
(8C/MPa)
Pressure
range (MPa)
Minimum
T
m
(8C) Ref.
Comments
Low density polyethylene
105.4 0.5
0.1–10.4 NS
a
[93]
Monitored temperature of high
pressure melt cooling.
Low density polyethylene
112 5
0.1–30 85.6 [94]
No region of d
T
m
=dP ¼
0. Slope
changes sign abruptly
Syndiotactic polystyrene
277 1.71 0.1–7 NS
[95]
HP-DSC
b
Isotactic polypropylene
147–154 1.24 0.1–4.5 NS
[96]
HP-DSC
Isotactic polypropylene
85
165 1.0
0.1–3 NS
[97,98] HP-DSC
Isotactic polypropylene
133
180 1.18 0.1–10 NS
[98,99] HP-DSC
Isotactic polypropylene
154,164 1.24 0.1–4.5 NS
[96]
HP-DSC
Poly(
«-caprolactone)
4
63 2.41 0.1–28 36
[100]
Poly(butylene succinate)
140
118 1.14 0.1–20 102
[100]
Poly(
L
-lactide)
180
160 2.2
0.5–2 NS
[98]
HP-DSC
Poly(ethylene terephthalate)
180
257 0.67 0.1–8.5 NS
[95]
HP-DSC
Poly(ethylene terephthalate)
50.7
253 0.42
1–3 NS
[101] HP-DSC
Polyethylene glycol
1.5
45 2.6
0.1–30 29
[102]
Polyethylene glycol
4
57 2.14 0.1–30 42
[102,103]
Polyethylene glycol
12
62 1.55 0.1–31 47
[103]
Polyethylene glycol
35
61 1.55 0.1–30 47
[102]
Poly(vinylidene fluoride)
530
158 0.48 0.1–68 135
[104] Dilation
Other Solvents
Low density polyethylene/CHClF
2
105.4 1.38 0.1–6.9 NS
[93]
a
Not seen in the experimental pressure range.
b
High pressure differential scanning calorimetry.

TABLE 18.5.
Glass transition temperature depressions of polymers in the
presence of SCFs.
Polymer
Diluent
T
g0
(
C)
dTg/dP
(
8C/MPa) Wt%CO
2
P
(MPa)
T
g
,P
(
C) Ref.
Technique
Polystyrene
CO
2
100
2.03 78 [107] DSC
a
Polystyrene
CO
2
100
6.08 35 [105] CC
b
Polystyrene
CO
2
100
8.0 40 [108] High pressure partition chromatograpy
Polystyrene
CO
2
104 8.1
5.33 61 [109] HP-DSC
Polystyrene
1,1,1,2-
tetrafluoroethane
104 8.5
3.28 76 [109] HP-DSC
Poly(4-methyl-1-pentene) CO
2
40
1.5 20 [110] Soprtion
Poly(methyl methacrylate) CO
2
105
3.95 32.7 [105] CC
Poly(methyl methacrylate) CO
2
105
8.0 40 [108] High pressure partition chromatograpy
Poly(methyl methacrylate) CO
2
105
10.0 36 [108] High pressure partition chromatograpy
Poly(methyl methacrylate) CO
2
92 8.9
4.7 50 [111] Molecular probe chromatography
Poly(methyl methacrylate) CO
2
90.7 10.6
3.77 50.8 [112] High pressure calorimetry
Poly(methyl methacrylate) Methane
90.7
22
73.5 [112] High pressure calorimetry
Poly(methyl methacrylate) Ethylene
90.7
5.52 57.3 [112] High pressure calorimetry
Poly(methyl methacrylate) CO
2
105
3.95 58.5 [105] CC
Poly(methyl methacrylate) CO
2
105
3.95(r v)
c
32.7(rv) [105] CC
Poly(methyl methacrylate) CO
2
105
4.05 42 [105] CC
Poly(methyl methacrylate) CO
2
105
3.75 75 [106] CC
Poly(methyl methacrylate) CO
2
3.75(r v) 5(rv) [106] CC
Poly(methyl methacrylate) CO
2
6.08 45 [106] CC
Poly(ethyl methacrylate) CO
2
61
2.13 24 [113] Sorption
Poly(ethyl methacrylate) CO
2
61
1.62 24 [113] Dilation
Acrylonitrile/methyl acrylate
terpolymer (Barex)
CO
2
85
6.7
54 [114] Ambient pressure DSC
Poly(acrylic acid)
CO
2
100
8.0 48 [115] IGC
d
Poly(
L
-lactide)
CO
2
NR 3.5
2
[98]
Poly(ethylene terephthalate) CO
2
74
2.03 52 [107] DSC
Poly(ethylene terephthalate) CO
2
74
2.03 52 [107] DSC
Poly(ethylene terephthalate) CO
2
74
2.03 52 [107] DSC
Poly(phenylene oxide) CO
2
210
1.4 25 [116] Sorption isotherm
Poly(phenylene oxide) CO
2
216
6.20 184.4 [117] DSC
Poly(phenylene oxide) CO
2
219
4.46 55 [118] DSC
Poly(phenylene oxide) CO
2
209
8.0 156 [115] IGC
101 (rv)
10.0 126
Polycarbonate
CO
2
148
2.03 97 [107] DSC
Polycarbonate
CO
2
150
8.0 75 [108] High pressure partition chromatograpy
Polycarbonate
CO
2
145 9.0
9.3 60 [109] HP-DSC
Polycarbonate
CO
2
151
3.1 25 [116] Sorption isotherm

TABLE 18.5.
Continued
Polymer
Diluent
T
g0
(
C)
dTg/dP
(8C/MPa) Wt%CO
2
P
(MPa)
T
g
,P
(
C) Ref.
Technique
Polycarbonate
CO
2
156
1.11 138
[119] HP-DSC
3.4(rv) 0(rv)
[111]
Polycarbonate
CO
2
148
2.03 97
[107] DSC
Polycarbonate
CO
2
148
6.08 55
[118] DSC
Tetramethyl polycarbonate
CO
2
195 6.6
5.62 160
[120] High pressure scanning calorimetry
Polycarbonate
CO
2
150 7.1
5.62 109
[120] High pressure scanning calorimetry
Tetrachloro polycarbonate
CO
2
233 4.74
5.62 206
[120] High pressure scanning calorimetry
Tetrabromo polycarbonate
CO
2
267 3.65
5.62 247
[120] High pressure scanning calorimetry
Poly(vinyl chloride)
CO
2
75
2.03 57
[107] DSC
Poly(vinyl chloride)
CO
2
77 13.4
4.26 16
[109] HP-DSC
Poly(vinyl pyrrolidone)
CO
2
165
8 120, 71(rv) [115] IGC
10 106, 96(rv) [115] IGC
Poly(vinyl pyrrolidone)
CO
2
161
8 100.5, 81(rv) [115] IGC
Poly(vinyl pyrrolidone-co-vinyl acetate) CO
2
96
8 36
[115] IGC
Polysulfone
CO
2
182
3.4 23
[116] Sorption isotherm
Poly(ether sulfone)
CO
2
222
2.7 21
[116] Sorption isotherm
Poly(ether imide)
CO
2
199
2.8 21
[116] Sorption isotherm
Cellulose acetate
CO
2
187
1.1 27
[116] Sorption isotherm
Cellulose triacetate
CO
2
185
1.0 24
[116] Sorption isotherm
Poly(vinylidene fluoride)
CO
2
105
2.53 60
[107] DSC
Poly(amic acid)
CO
2
156
6.08
8
[118] DSC
Polyimide
CO
2
227
6.08 0
[118] DSC
Poly(p-phenylene sulfide)
CO
2
85.5
2.03 75
[121] Sorption isotherm
Poly(vinyl benzoate)
CO
2
65.5
3.39 25
[122] Dilation
Poly(vinyl butyral)
CO
2
51
2.63 25
[122] Dilation
a
Differential scanning calorimetry.
b
Creep compliance.
c
Retrograde vitrification.
d
Inverse gas chromatography.