Mark James E. (ed.). Physical Properties of Polymers Handbook
Подождите немного. Документ загружается.


46.4 DENSITY OF STATES
Magnetic susceptibility studies identify the charge stor-
age mechanism at low doping levels, as well as the density
of states at the Fermi level and the density of localized
‘‘Curie’’ spins at higher dopant levels. For (CH)
x
, spinless
solitons dominate at low doping levels [76,78]. In contrast,
spin 1/2 polarons and spinless bipolarons are present in
nondegenerate systems at low doping levels [7,33,138]. At
high doping levels, the highest conducting doped polyace-
tylene, polypyrrole, polyaniline, polythiphene, and polypar-
aphenylenes are reported to have finite densities of states at
the Fermi level [N(E
F
)]. Typical literature values of N(E
F
)
[27,61,62,71,74–76,78,79,138–148] for each of these sys-
tems are presented in Table 46.3. Having the Fermi level in
a partially filled conduction band results in Pauli suscepti-
bility (w
Pauli
¼ 2m
2
B
N(E
F
) ) and enables metallic conduction.
The magnitude of w
Pauli
depends on the structural order and
morphology of the polymers as this affects the uniformity of
the doping. It is noted that the values of N(E
F
) in Table 46.3
have not been scaled to the percent crystallinity. Hence the
intrinsic density of states in each of the ordered polymers
may be larger than indicated.
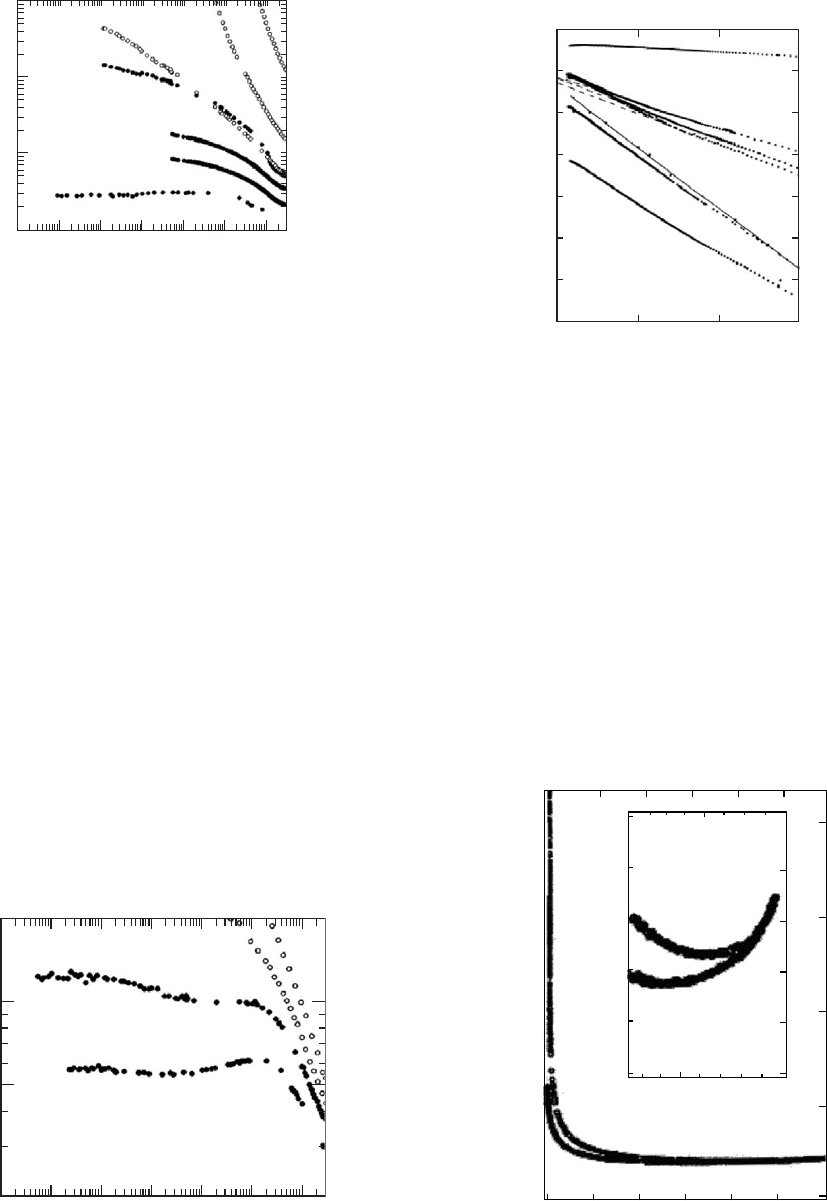
For the earliest studied iodine doped Shirakawa
[76,78,139] and Naarmann [140] (CH)
x
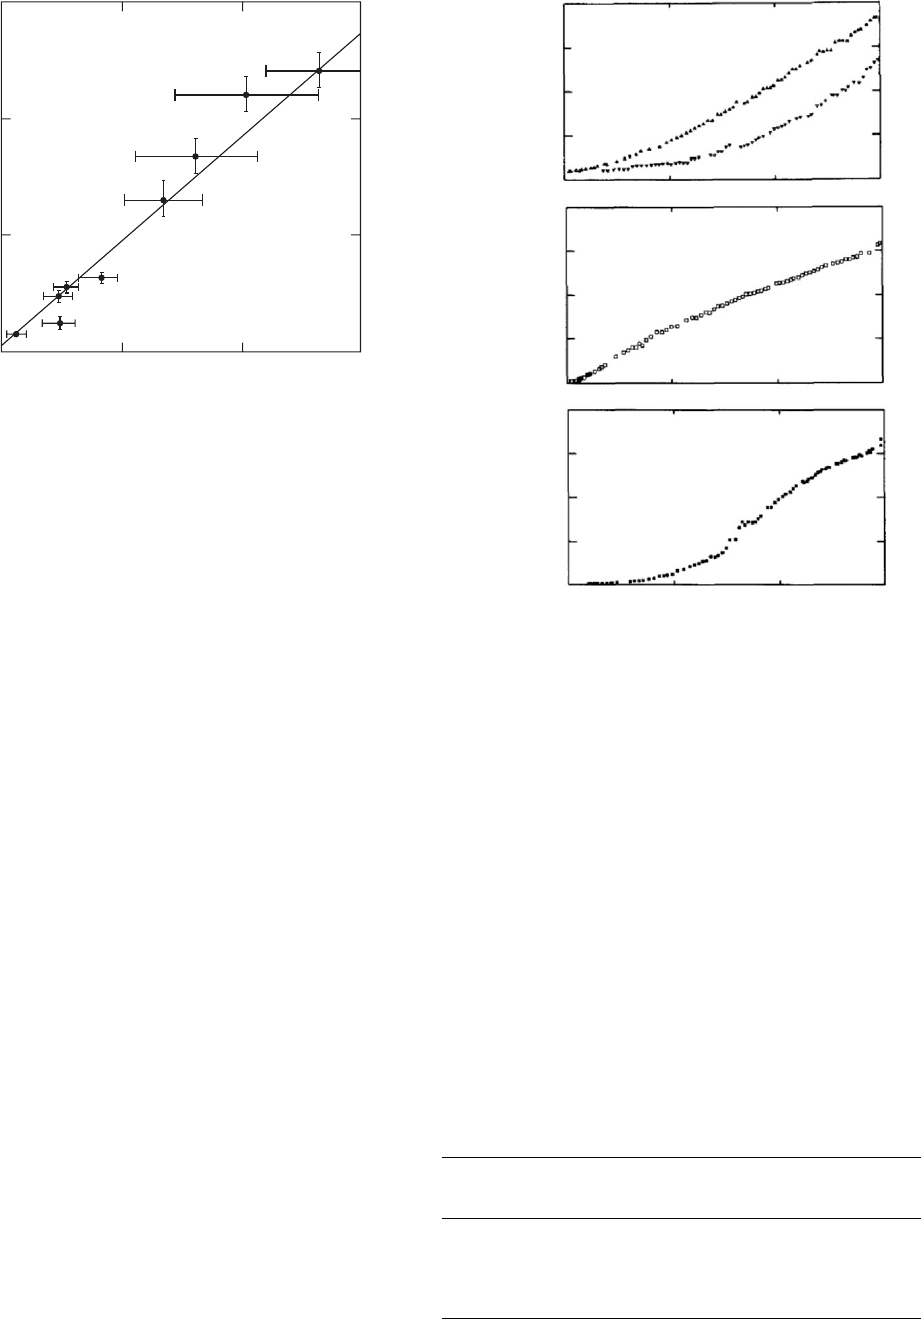
, Fig. 46.5, N(E
F
)
0:1 states/eV-C for doping levels above 4–6% doping
level. With the recently studied Tsukamoto [75,142] (CH)
x
,
which has a more compact morphology, a higher doping
level was attained resulting in N(E
F
) 0.2–0.3 states/eV-C,
Fig. 46.5, indicating that the doping was more homogeneous.
For PAN, N(E
F
) is finite and has been shown to increase
with the level of protonic acid doping and the volume
fraction of crystalline material for both the ES-I, Fig. 46.6,
and ES-II, Fig. 46.7, structure [61,62]. The N(E
F
) differ for
ES-I HCl and ES-II HCl, being 0.26 states/eV-(CþN), and
0.083 states/eV-(CþN), respectively [143]. For highly con-
ducting PAN–CSA (m-cresol) [79], N(E
F
) 0:07 states/
eV-(CþN). Recently, a differently prepared stretched PAN
doped with HCl was reported to have a much higher
N(E
F
), 1:4 states/eV-(CþN) [71]. Some solutions of
PAN–CSA have been reported to have a Pauli-like suscep-
tibility [144].
Highly conducting doped polypyrrole has a large w
Pauli
[74]. The samples initially studied typically had conductiv-
ities in the range of 1–10 S/cm with little crystallinity; for
these materials, N(E
F
)#0:01 states/eV-C [145]. Later stud-
ies on BF
4
doped PPy [138,146] indicated N(E
F
) 0:045
states/eV-C, however, these films were not structurally
characterized. A coordinated study of PPy doped with
hexafluorophosphate [PPy(PF
6
)] and toluene sulfonate
[PPy(TsO)] [74] shows that for the more highly crystalline
(50%), higher conductivity (s
DC
300 S=cm)PPy(PF
6
),
N(E
F
) 0:2 states/eV-C, similar to what was found for
highly conducting iodine doped Tsukamoto (CH)
x
. For
less crystalline (25%), lower conductivity (s
DC
120
S=cm) PPy(TsO), N(E
F
) 0:05 states/eV-C. Figure 46.8
contrasts the density of states [N(E
F
) ¼ w
Pauli
=2m
2
B
] and
number of localized Curie-like spins measured for the
PPy-PF
6
and PPy-TsO compounds [74]. The more metallic
PPy-PF
6
clearly has the larger w
Pauli
and the smaller number
of localized Curie spins (independent polarons).
For doped polythiophene, there is variation of the doping
level attained with different dopants. For BF
4
doped PT
[146], N(E
F
) 0:05 states/eV-C at the 4–8% dopant level.
For PT(AsF
6
) [27], the doping is inhomogeneous until 26
mol% where N(E
F
) 0:23 states/eV-C.
For PPP, a metallic density of sates of N(E
F
) 0:05
states/eV-C has been reported for doping with AsF
6
[147].
TABLE 46.3. Typical x
Pauli
and N(E
F
) for highly conducting polymer systems.
Material x
Pauli
N(E
F
)
[CH(I
3
)
y
]
x
[75,142,160] 1:1 10
5
emu=mol-C 0.33 states/eV-C
[CH(I
3
)
y
]
x
[76,139,140] 2:9 10
6
emu=mol-C 0.09 states/eV-C
[CH(CIO
4
)
y
]
x
[141] 3:3 10
6
emu=mol-C 0.11 states/eV-C
[CH(CIO
4
)
y
]
x
[139] 2:3 10
6
emu=mol-C 0.08 states/eV-C
[CH(Na)
y
]
x
[139] 2:0 10
5
emu=mol-C 0.07 states/eV-C
PAN(HCl) ES-I [61,143] 7:9 10
6
emu=mol-(C þ N) 0.26 states/eV-(CþN)
PAN(HCl) ES-II [62,143] 2:5 10
6
emu=mol-(C þ N) 0.083 states/eV-(CþN)
PAN(HCl) [71] 4:0 10
5
emu=mol-(C þ N) 1.4 states/eV-(CþN)
PAN(CSA) [79] 2:1 10
6
emu=mol-(C þ N) 0.07 states/eV-(CþN)
PAN(SO
3
) (‘‘SPAN’’) [87] 1:7 10
6
emu=mol-(C þ N) 0.06 states/eV-(CþN)
POT(HCl) [121] 3:9 10
6
emu=mol-(C þ N) 0.13 states/eV-(CþN)
PPy(PF
6
) [74] 7:0 10
6
emu=mol-C 0.20 states/eV-C
PPy(TsO) [74] 1:8 10
6
emu=mol-C 0.05 states/eV-C
PPy(BF
4
) [146] 1:7 10
6
emu=mol-C 0.05 states/eV-C
PT(AsF
g
) [27] 7:5 10
6
emu=mol-C 0.23 states/eV-C
PT(BF
4
) [146] 1:5 10
6
emu=mol-C 0.05 states/eV-C
PPP(AsF
6
) [147] 1:5 10
6
emu=mol-C 0.05 states/eV-C
C
2
H
5
O-PPV(BF
4
) [148] #1 10
6
emu=mol-C 0.03 states/eV-C
CONDUCTING POLYMERS:ELECTRICAL CONDUCTIVITY / 731
There are no reports in the literature concerning the tem-
perature dependence of the susceptibility of doped PPV.
However, if the reported room temperature magnetic sus-
ceptibility measured of BF
4
doped poly(2,5-diethoxy-
p-phenylene–vinylene) [C
2
H
5
O-PPV(BF
4
)] [143] is entirely
due to a Pauli contribution, an upper estimate of N(E
F
)is
0.03 states/eV-C.
In sum, for each of these systems the metallic density of
states at the Fermi level varies substantially. Where data are
present, the Pauli susceptibility increases with increasing
three-dimensional or nematic order.
46.5 TEMPERATURE DEPENDENT
CONDUCTIVITY AND
MAGNETORESISTANCE
46.5.1 Conductivity
The temperature dependent dc conductivity, s
DC
(T),
provides a direct probe of the macroscopic charge conduc-
tion through the less conducting regions. Recent advances in
chemical processing have resulted in higher crystallinity and
conductivity for conducting polymers.
Ishiguro et al. reported the temperature dependent resist-
ivity [r (T)] of heavily iodine doped (CH)
x
and hexafluor-
ophosphate (PF
6
) doped PPy down to mK range as function
of aging (disorder), Figs. 46.9 and 46.10, respectively [70].
0
0
1
2
3
4
χ
P
⫻10
6
(emu/mole)
N(E
F
) (states/eV−C)
5
6
7
0.00
0.03
0.06
0.09
0.12
0.15
0.18
0.21
12345
y (I
3
)
6789
FIGURE 46.5. Pauli susceptibility and density of states as a
function of I
3
doping level for an oriented (l=l
0
6) Naarmann
polyacetylene (triangles) (N-(CH)
x
) (from Ref. [135]), unor-
iented Shirakawa polyacetylene (circles) (S-(CH)
x
) (from
Ref. [140]), and Tsukamoto polyacetylene (x) (T-(CH)
x
)
(from Refs. [75,160]).
(a)
(b)
8
6
4
2
0
0
120
100
80
60
40
20
20
15
10
5
0
0 0.1 0.2 0.3
γ
0.4 0.5
0
1234567
8
z ⫻ 10
8
χ
PAULI
2
⫻ 10
8
•
emu/mol cl
−
χ
PAULI
⫻ 10
8
•
emu/mol 2-ring
χ
PAULI
⫻ 10
8
•
emu/mol (C + N)
FIGURE 46.6. N(E
F
) versus doping level for PAN–HCl, ES-I
structure. The lower curve presents x
Pauli
normalized to the
doping level (from Ref. [61]).
0
0
20
40
60
10
6
χ
P
(emu/mole)
80
100
120
0.1 0.2 0.3
x = [CI]/[N]
0.4 0.5
FIGURE 46.7. N(E
F
) versus doping level for PAN–HCl, ES-II
structure (dashed line). The closed circles are for HCl doping
of the ES-I structure (from Ref. [62]).
0.010
0.005
0.000
0 100
Temperature (K)
200 300
PPy (PF
4
)
PPy (Ts0)
XT (emu K/mol ring)
FIGURE 46.8. x
T
versus T for PPy-PF
6
and PPy-TsO (from
Ref. [74]). Note that assuming x ¼ (x
Pauli
þ x
curie
) and that
x
Pauli
is T independent while x
Curie
/ T
1
,PPy-PF
6
has the
larger regions of metallic density of states while the PPy-TsO
system has a great density if localized (independent polaron)
spins.
732 / CHAPTER 46
The highest s
DC
at room temperature reported in this study
is 5 10
4
S=cm for I
3
doped T-(CH)
x
and 10
3
S=cm
for the highest conducting PPy(PF
6
). For both of these
materials, the conductivity decreases with decreasing tem-
perature to a minimum at T
m10 K
. Below T
m
, s increases by
20% and then is constant to 1 mK. Some highly conduct-
ing preparations of PAN–CSA show similar behavior [82].
Hydrochloric acid as well as camphor sulfonic acid doped
polyaniline prepared in chloroform often have log s propor-
tional to T
1=2
as expected for quasi-one-dimensional vari-
able range hopping (VRH), Fig. 46.11, [73,121,143]:
s ¼ s
0
exp [ (T
0
=T)
1=2
], (46:7)
where T
0
¼ 16=[k
B
N(E
F
)L
z
]. Here L is the one-dimensional
localization length and z the number of nearest neighbor
chains. Generally, the higher conductivity samples have
a weaker temperature dependence at low temperatures
(T
0
700---1,000 K forT < 80 K), and lower conductivity
samples a stronger temperature dependence (T
0
4,000 K).
The smaller T
0
for the more highly conducting samples has
been associated with weaker localization due to improved
intrachain and interchain order.
Higher conducting polyaniline films that were prepared
from solutions of PAN and HCSA in m-cresol have an
intrinsic metal-like temperature dependence at room tem-
perature to 200 K, below which the conductivity decreases
slowly, Fig. 46.12. It was shown that this metal-like behavior
10
−4
10
−5
10
−4
10
−3
10
−2
10
−3
10
−2
10
−1
1
Temperature (K)
Resistivity (Ω⋅cm)
10 10
2
A 1
A 2
A 3
A 4
A 5
A 6
A 7
FIGURE 46.9. Temperature dependence of the resistivity for
various heavily iodine doped poly-acetylenes represented in a
log r versus log T scheme (from Ref. [70]).
10
−4
10
−3
10
−2
10
−1
Temperature (K)
Resistivity (Ω-cm)
0.002
0.005
Y1
Y2
Y3
Y4
0.010
0.020
10 10
2
1
FIGURE 46.10. Temperature dependence of the resistivity
for PF
6
and BF
6
doped polypyrroles represented in a log r
versus log T scheme (from Ref. [70]).
0.05
10
−4
10
−3
10
−2
10
−1
1
F
E
D(II)
C(II)
B(II)
A(II)
G
σ
dc
(S/cm)
10
400 100 44.4
T (K)
25
10
2
10
3
0.10 0.15
T
−½
(K
−½
)
0.20
FIGURE 46.11. s
DC
(T) for ‘‘crosslinked’’ PAN-ES, PAN–CSA
(CHCl
3
), and PAN–CSA (m-cresol) samples (from Ref. [73]).
The dashed lines are based upon the quasi-1D VRH model.
Note here ‘‘crosslinks’’ refers to physical crosslinks (micro-
crystalline regions) not chemical crosslinks (covalent bonds).
0 50 100 150
T (K)
T (K)
200 250
300200
20
30
10
0
3.8
3.6
3.4
3.2
3.0
40⫻10
−3
40⫻10
−3
r (Ω cm)
r (Ω cm)
FIGURE 46.12. Resistivity versus temperature for PAN–CSA
(m-cresol). The inset shows the resistivity minima on an
expanded scale (from Ref. [116]).
CONDUCTING POLYMERS:ELECTRICAL CONDUCTIVITY / 733
for T > 200 K can occur in the presence of one-dimensional
localization when the phonon backscattering rate becomes
larger than the impurity scattering rate [120]. A similar
temperature dependence for conductivity has been reported
for FeCl
3
doped polyacetylene [149].
For PAN–CSA [116,120], PPy(PF
6
) [74,118], and iodine
doped (CH)
x
[150], the proximity of the material to the
insulator–metal transition can be gauged by the resistivity
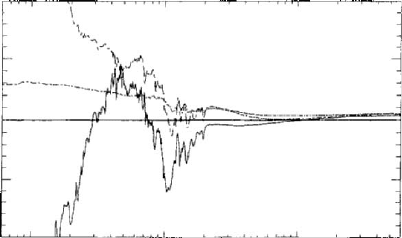
ratio r(1:4K)=r(300 K) and a plot of the reduced activation
energy: W ¼Tdln(r(t))=dT [151]. For a conductor close
to the insulator–metal transition, the resistivity follows a
power law behavior with T [152]; for a critical regime
sample, the plot of log W versus log T approaches T ¼ 0K
at a constant value. The plot of log W versus log T for a
critical sample provides a dividing line between the plot of
log W versus log T for insulator hopping behavior which
increases with decreasing T (i.e., the slope of log W versus
log T is equal to g if s / exp (T
0
=T)
g
) and the plot of log W
versus log T for metallic samples which decrease with
decreasing T.TheW plots for selected PAN–CSA materials
are shown in Fig. 46.13.
46.5.2 Magnetoresistance
The charge transport can be changed in the presence of an
external magnetic field because of the destruction of time-
reversal symmetry, i.e., a total phase difference between two
paths is created by the magnetic field [153]. The magne-
toresistance is more easily detected at low temperature
because of large localization effects. The fractional change
of resistivity in the presence of a magnetic field, Dr=r, can
be either positive or negative. A negative magnetoresistance
can originate from localization effects caused by magnetic
field-related dephasing. A field-dependent cutoff length
L
H
¼
ffiffiffiffiffiffiffiffiffiffiffiffiffi
hc=eH
p
, where c is the speed of light, is important
at high magnetic fields [153]. A positive magnetoresistance
is detected when the mobility edge E
c
is shifted by the
external magnetic field [154]. For an impurity conduction
mechanism, the wave functions of the impurity electrons are
compressed in the transverse direction by the magnetic field,
leading to an enhancement of localization effects, which
also induces a positive magnetoresistance [153].
Figures 46.14–46.16 show examples [116,118,155] of the
magnetoresistance of doped polyacetylene, polypyrrole, and
polyaniline samples at low temperatures. A wide range of
behaviors is observed. The variation in magnetoresistance
for conducting polymers is closely related to the magnitude
and temperature dependence of the conductivity in the ab-
sence of a magnetic field. For highly conducting doped
(CH)
x
, a negative magnetoresistance is reported [81,155]
for both the parallel and perpendicular directions (Fig.
46.14). This was attributed to quantum interference though
the magnitude of the magnetoresistance in the parallel dir-
ection is relatively insensitive to the magnetic field. For
highly conducting PPy(PF
6
) and PAN–CSA materials, the
magnetoresistance is usually positive, (Figs. 46.15 and
46.16), which was interpreted as a shift of the mobility
edge in the presence of a magnetic field.
metallic
critical regime
insulator
10
W=−T (∆lnρ/∆T)
T (K)
0.1
1
8
6
4
4
2
2
8
6
8
6
4
4
2
286422
100
FIGURE 46.13. W plot for PAN–CSA (m-cresol) for samples
in the insulating, critical, and metallic regime (from Ref. [116]).
0
∆σ (H) (S / cm)
0
−600
600
5
Magnetic Field (T)
10 15
0
∆σ (H) (S / cm)
0
−600
600
5
Magnetic Field (T)
10 15
H||J (a)
H⊥J (b)
11.1K
7K
5K
3.2K
1.6K
1.2K
0.9K
0.55K
7K
5K
4.2K
3.2K
1.6K
FIGURE 46.14. Magnetic field dependence of the conductiv-
ity increment Ds (H) at various temperatures for heavily iodine
doped T-(CH)
x
(from Ref. [155]).
734 / CHAPTER 46
46.6 THERMOELECTRIC POWER
The results of the thermoelectric power experiments de-
termine the sign of the conducting charge, either electron-
like (for a negative thermoelectric power) or hole-like (for a
positive thermoelectric power). In terms of band theory, the
positive or negative thermoelectric power implies p-type or
n-type doping of a system, respectively. For inhomogeneous
conducting polymers, there are several different contribu-
tions to the total thermoelectric power [156,157].
When the conductivity is determined by the motion of
charge carriers near the Fermi level, where states are metal-
lic (delocalized), the thermoelectric power is [115]
S(T) ¼
2p
2
3
k
2
B
T
e
dlnN(E)
dE
E¼E
F
: (46:8)
Assuming a weak energy dependence of the density of states
N(E
F
), the thermoelectric power increases linearly as the
temperature increases.
When the conduction is determined by three-dimensional
VRH, S(T) /
ffiffiffi
T
p
[115]. For a quasi-one-dimensional VRH
case, the thermoelectric power due to the interchain motion
is constant [143] while that due to intrachain hopping is
/ 1=T, similar to that of doped semiconductors [115].
Park et al. [80] and Javadi et al. [81] reported metallic
thermoelectric power [S(T) / T] for heavily doped highly
conducting polyacetylene (Figs. 46.17 and 46.18) though
VRH-type S(T) /
ffiffiffi
T
p
had been reported earlier for poorly
conducting polyacetylene [83]. Similarly, highly conducting
forms of polyaniline and polypyrrole have S(T) / T,
Figs. 46.19 [117,158] and 46.20 [154], while more disor-
dered materials show nonlinear temperature dependent
0
0.0
0.5
1.0
1.5
2.0
20 40 60
H
2
(T
2
)
∆r/r
∆r/r
80 100
0
(a)
(b)
0.00
0.05
0.10
0.15
0.20
0.25
20 40 60
H
2
(T
2
)
80 100
FIGURE 46.15. Dr=r versus H
2
for PAN–CSA (m-cresol): (a)
In the critical regimes; [r(T ) / T
0:26
, 4.2 K (solid circles),
2.5 K (solid diamonds), and 1.4 K (solid triangles); (b) in the
insulating regime (follows three-dimensional VRH model),
4.2 K (solid circles), 2.5 K (solid diamonds), and 1.4 K (solid
triangles)] (from Ref. [116]).
0
0.0
0.1
0.2
0.3
0.4
0.5
0
0.0
0.5
1.0
1.5
2.0
12
T=1.4 K
20 40 60
lc2
lc1
Mc3
Mc2
Mc1
M1
0.6
0.7
0.8
0.9
1.0
10 20 30 40
H
2
(Tesla
2
)
∆r(H) / r(0)
50 60 70
FIGURE 46.16. Magnetoresistance of doped polypyrroles
(from Ref. [70, 224]). The inset shows the magnetoresistance
for a less highly conducting doped PPy than in the main figure.
0
0
1.0
2.0
3.0
4.0
5.0
6.0
7.0
8.0
9.0
10.0
11.0
12.0
50 100 150 200
T (K)
THERMOPOWER S ( mV/K)
250 300
FIGURE 46.17. Temperature dependence of the thermoelec-
tric power in unstretched (solid circles) heavily AsF
5
doped
polyacetylene and stretched (l=l
0
3:2, open circles) ones
(from Ref. [80(b)]).
CONDUCTING POLYMERS:ELECTRICAL CONDUCTIVITY / 735

behavior, which might include the three-dimensional or
quasi-one-dimensional VRH contributions. Figure 46.21
[143] shows the nonlinear S(T) of some hydrochloride
doped polyaniline materials.
46.7 MICROWAVE DIELECTRIC CONSTANT
The microwave frequency dielectric constant provides a
measure of the charge delocalization in individual samples.
Figure 46.22 presents [73] the low temperature dielectric
constant «
mw
, for a series of emeraldine hydrochloride sam-
ples plotted against the square of the crystalline coherence
length, j (as measured by x-ray diffraction). For low tem-
peratures, «
mw
is proportional to j
independent of the
direction of orientation of the sample with regard to the
microwave frequency electric field. This demonstrates that
the charge is delocalized three-dimensionally within the
crystalline regions of these samples. Using a simple metallic
box model [73,143],
« ¼ «
1
þ (2
9=2
=p
3
)e
2
N(E
F
)L
2
, (46:9)
and taking for the low temperature localization length the
x-ray crystalline correlation length determined by x-ray dif-
fraction, N(E
F
) ’ 1:23 state/(eV 2-rings) (0.088 state/eV-
TEMPERATURE (K)
THERMOPOWER (µV/K)
0
0
5
10
15
20
N-(CH)
x
50 100 150 200 250 300
FIGURE 46.18. Thermoelectric power of stretched heavily
iodine doped N-(CH)
x
film versus temperature measured par-
allel to the stretched axis (from Ref. [81]).
0
0
2
4
6
8
10
12
14
50 100 150
T (K)
S (mV/K)
200 250
300
FIGURE 46.19. Temperature dependence of thermoelectric
power of PAN–CSA (m-cresol) samples: different symbols
refer to materials prepared in different casting conditions
(from Ref. [117]).
0
0
2
4
6
8
100
Temperature (K)
200 300
10
Thermoelectric power (µV/K)
FIGURE 46.20. Temperature dependence of thermoelectric
power of PF
6
doped polypyrrole (from Ref. [159]).
0
Thermopower (µV/K)
0
5
50 100
T (K)
150 200 250 300 350
10
−5
−10
FIGURE 46.21. Comparison of temperature dependence of
thermoelectric power of HCl doped PAN-ES samples (from
Ref. [143]).
736 / CHAPTER 46
(CþN)) for PAN–HCl. This compares very favorably with
the value obtained from magnetic susceptibility experiments
[61].
A positive microwave frequency dielectric constant is
also found for modestly conducting iodine doped un-
stretched and modestly stretched Tsukamoto polyacetylene
[75] and for unstretched PPy-TsO [74], Fig. 46.23(a) and
(b). Using Eq. (46.9), the size of the low temperature me-
tallic box, L, can be determined. Table 46.4 summarizes the
low temperature microwave dielectric constant for typical
modestly conducting doped polymers and the corresponding
metallic box size calculated using Eq. (46.9). In each case L
is approximately the size expected from x-ray diffraction
studies of the structural coherence length, j.
An independent measure of the temperature dependence
of the conduction electron localization length is obtained
through study of the temperature dependence of the dielec-
tric constant. For HCl doped PAN-ES samples with weaker
localization in the disordered regions, «
mw
(T) increases rap-
idly with increasing temperature to values in excess of 10
4
at
room temperature, Fig. 46.23(c). In contrast, more localized
samples have a weaker temperature dependence to the di-
electric constant with «
mw
(295 K) < 2 10
3
. Using Eq.
(46.9) the room temperature localization length (L
RT
)is
estimated as 1,000 A
˚
and 350 A
˚
parallel and perpen-
dicular to the chain direction, respectively, for these highly
conducting materials [73]. This distance encompasses of
order seven or more structurally coherent regions (‘‘crystal-
line islands’’) in the parallel direction and four or more in
the perpendicular direction. Such materials were described
[73] as having mesoscopic metallic states at room tempera-
ture. In contrast, for modestly conducting materials, L
RT
is
less than or of order twice the distance between crystalline
regions implying nearly isolated ‘‘metallic’’ islands.
The sign, magnitude, and temperature dependence of the
6:5 10
9
Hz dielectric constant for very highly conducting
T-[CH(I
3
)
y
]
x
[75,160], PPy-PF
6
[74], and m-cresol prepared
PAN–CSA [73] are quite striking, Fig 46.24. For example,
PAN–CSA (m-cresol) has a metallic negative dielectric
constant and features a maximum in microwave frequency
conductivity at 180 K [73]. A similar large and negative
value of «
mw
and temperature dependence of «
mw
were
determined for heavily iodine doped stretched Tsukamoto
0
0
100
200
e
mw
(T → O)
300
2000
D(⊥)
E
A(⊥)
B(⊥)
D(II)
C(II)
B(II)
A(II)
C(⊥)
4000
ξ
2
(Å
2
)
6000
FIGURE 46.22. «
mw
(6:5 10
9
Hz,T ! 0) versus j
2
for HCl
doped PAN-ES (j
2
¼ j
?, a
j
?, b
) (from Ref. [73]).
0
0
1 x 10
4
2 x 10
4
3 x 10
4
4 x 10
4
0
0(a)
(b)
(c)
2000
end
neck
e
mw
e
mw
e
mw
4000
6000
8000
1 x 10
4
2 x 10
4
3 x 10
4
4 x 10
4
100
A(II)
200
T (K)
300
FIGURE 46.23. «
mw
(6:5 10
9
Hz) versus temperature for
modestly conducting doped polymers. (a) I
3
doped Tsuka-
moto polyacetylene (unstretched end and modestly stretched
neck portions of sample) (from Refs. [75,160]), (b) un-
stretched PPy-TsO (from Ref. [74]), and (c) intermediate
‘‘crosslinked’’ 3.5 times stretched HCl doped PAN-ES (from
Ref. [73]).
TABLE 46.4. Low temperature dielectric constant,
«
mw
(T ! 0) and derived metallic box size, L(T ! 0),
compared to the x-ray diffraction determined coherence
length, j, for typical modestly conducting polymers.
Modestly conducting
polymer systems
«
mw
(T ! 0)
L(T ! 0)
(A
˚
) j(
˚
A)
T-(CH(I
3
)
y
)
x
[75] 400 170 Not measured
PPy-TsO [74] 20 25 15
PAN–CSA
(CHCl
3
) [73,75]
30 24 j
k
35,j
?
25
CONDUCTING POLYMERS:ELECTRICAL CONDUCTIVITY / 737
polyacetylene [75,160] and PF
6
doped polypyrrole [74].
Using the Drude model [123,124] for low frequencies
(vt51), a plasma frequency of v
p
¼ 0:015 eV(120 cm
1
)
and a room temperature scattering time of t ¼ 1:2 10
11
s
were calculated [73] for the PAN–CSA (m-cresol) system,
though the exact values correlate with the sample prepar-
ation. Similar values are obtained for heavily iodine doped
stretched Tsukamoto polyacetylene and PF
6
doped polypyr-
role (Table 46.5). These values of v
p
are much smaller than
one expects from the usual Drude model. The small values
of v
p
suggest that only a small fraction of the conduction
band electrons participate in this low frequency plasma
response. Similarly, the value of t is two orders of magni-
tude larger than usual for an alkali, noble, or transition metal
[124]. The origin of the anomalously large scattering time
was suggested [120] to be the ineffectiveness of forward
scattering of conduction electrons in the metallic state and
the need for backward scattering (i.e., the Fermi surfaces of
metallic polyaniline, polyacetylene, and polypyrrole are
‘‘open’’ as expected for highly anisotropic materials and
backward scattering from k
F
to k
F
may be necessary for
momentum relaxation).
The behavior of «
mw
for PAN–CSA of moderate con-
ductivity (200 S/cm) demonstrates [120] strikingly the
effect of disorder (Fig. 46.25). A metal–insulator transition
as a function of temperature is reflected in «
mw
:«
mw
crosses
from huge and negative (Drude-type band transport) at
room temperature to large and positive (insulating or ‘‘di-
electric’’ behavior) at 20 K. This behavior is ascribed
[120] to phonon controlled delocalization. When the phonon
scattering rate is larger than the impurity scattering rate,
phonon scattering destroys the localization caused by im-
purity scattering. The presence of this effect is suggested to
arise from the key role of one-dimensional chains electron-
ically linking three-dimensional metallic regions in the
polymer.
0
(a)
center
(b)
(c)
e
xxx
e
xxx
e
xxx
0
−1⫻10
5
−0⫻10
4
−1.5⫻10
5
−1.0⫻10
5
−5.0⫻10
4
−2.0⫻10
6
−1.5⫻10
6
−1.0⫻10
6
−5.0⫻10
5
0.0
0.0
100
T (K)
200 300
FIGURE 46.24. «
mw
(6:5 10
9
Hz) versus temperature for
highly conducting doped polymers. (a) I
3
doped Tsukamoto
polyacetylene (stretched central portion of sample) (from Ref.
[160]), (b) unstretched PPy-PF
6
(from Ref. [74]), and (c)
PAN–CSA (m-cresol) (from Ref. [73]). Note the large negative
values of these dielectric constants.
TABLE 46.5. Typical low frequency plasma frequency and
relaxation time obtained from microwave frequency
measurements of very highly conducting polymers.
Highly conducting polymer v
p(cm
1
) t (s)
T-(CH(l
3
)
y
)
x
(295 K) [75,160] 200 3:3 10
11
PPy-PF
6
(265 K) [74] 100 3:0 10
11
PAN–CSA (m-cresol)
(295 K) [73,75,120]
120 1:2 10
11
0
−5⫻10
4
−4⫻10
4
−3⫻10
4
−2⫻10
4
e
mw
e
mw
−1⫻10
4
−1⫻10
4
−2⫻10
4
0102030
T
(K)
40 50
1⫻10
4
1⫻10
4
0
0
50 100 150 200
T
(K)
250 300 350
FIGURE 46.25. «
mw
(6:5 10
9
Hz) versus temperature for a
sample of PAN–CSA (m-cresol) of moderate conductivity
(200 S/cm), demonstrating a metal–insulator transition as
a function of temperature (from Ref. [120]).
738 / CHAPTER 46
46.8 OPTICAL ABSORPTION, TRANSMISSION,
AND REFLECTION
The apparent semiconducting or insulating bandgaps for
the undoped forms of each of the principal conducting
polymers as obtained by visible/UV spectroscopy are listed
in Table 46.6 [91,161–181], though for many of the non-
degenerate polymers, the lower energy optical absorption
may actually represent formation of excitons [49–52,181–
184]. Upon low level doping, there is a systematic change in
the optical properties depending on whether the ground state
is degenerate or nondegenerate, with prominent signatures
for solitons, polarons, and bipolarons. However, for the
most highly doped ordered states, the conducting polymers
show ‘‘metallic’’ absorption and reflection behavior.
Because the metallic state is so highly reflecting, it is
often studied via reflectance from films. From such data, a
Kramers–Kronig analysis provides all the optical constants
of interest including the absorption coefficient, dielectric
functions, and conductivity [185]. The real part of the di-
electric function («
1
) and the optical conductivity (s
1
) give
insight into the localized or delocalized behavior of the
conduction electrons. The measured frequency response
can be compared with the Drude model for free electrons
and other models for localized (bound) electrons [185].
Again, the universality of the electronic behavior of the
systems with improving structural order, morphology, and
doping is stressed. For the materials with the highest s
DC
,an
increased fraction of the total oscillator strength (from
conduction electrons) demonstrates free electron Drude
response.
46.8.1 Optical Dielectric Function
For the conducting forms of doped polyacetylene and
other conducting polymers, there are zero, two, three, or
one zero crossings of the real part of the dielectric function
(«
1
) as the frequency is decreased. For the least conducting
materials, «
1
remains positive for the entire optical fre-
quency range (50---50,000 cm
1
), reaching values of several
hundred at microwave frequencies. For higher conductivity
materials, «
1
crosses zero between 1 and 3 eV (the all-
conduction-electron plasma response) and then becomes
positive again below 1,000 cm
1
, reaching values in ex-
cess of 10
4
at microwave frequencies. For the most metallic
samples, two behaviors have been reported dependent
upon the system. For doped PAN and PPy with modest
s
DC
400 S=cm, «
1
demonstrates the previous two zero
crossings, and a third zero crossing occurs to negative values
at a ‘‘delocalized conduction electron plasma frequency’’ of
several hundred wavenumbers. For the most highly conduct-
ing doped polyacetylene, «
1
crosses zero at the all conduc-
tion electron plasma frequency and remains negative to the
lowest measured optical frequencies.
The optical response of iodine [83,106,162,186,187]
and perchlorate (ClO
4
) [106,188,189] doped (CH)
x
and
PF
6
doped poly(methylthiophene) [190] have been well
characterized, as have polyaniline samples (PAN–HCl
[55,191,192] and PAN–CSA prepared in m-cresol [75,146,
193–196] and in solutions of m-cresol and chloroform
[193,197]) and polypyrrole films (doped with PF
6
[74,89,
198,199], TsO [74,89,198], ClO
4
[166], and some sulfon-
ated poly(b-hydroxyethers) [46,192].
Figure 46.26 shows «
1
at room temperature for selected
PAN samples. PAN–CSA (m-cresol) (s
DC
400 S=cm) has
three zero crossings for «
1
which correspond to two different
plasma frequencies [193]. The higher energy zero crossing
was assigned [75] to the plasma response of the whole
conduction band, as the density of carriers (n) determined
from the plasma frequency (v
2
p
¼ 4pne
2
=m
; assuming m
,
the effective mass, is approximately the free electron mass)
is in the range of the dopant density. There is a Lorentzian
frequency dispersion at this v
p
indicating that the majority
TABLE 46.6. Typical apparent ‘‘bandgap’’ values for the
undoped conducting polymers. Both the absorption onset
and peak are given.
Material
Absorption
onset (eV)
Absorption
peak (eV)
(CH)
x
(trans) [161,162] 1.4 1.8
(CH)
x
(cis) [163] 1.9 2.3
PAN (LEB) [164] 3.2 3.6
PAN (EB) [164] 1.6(3.0) 2.0(3.8)
PAN (PNB) [165] 1.8 2.3
PPy [166,167] 2.5 3.2
PT [168–171] 2.0 2.3–2.7
PPP [91,172–174] 3.1 3.43–3.7
PPV (old) [175–178] 2.4 2.9
PPV (new) [179] 2.25 2.46
PPyr [180] 2.9 3.3
PPyV [181] 2.5 3.0
0.01
−50
−25
0
A
B
C
Real (ε)
25
50
0.10 1.00
Energy (eV)
FIGURE 46.26. Real part of the room temperature dielectric
response versus frequency for PAN–CSA(m-cresol) (A),
PAN–CSA(chloroform/m-cresol) (B), and PAN–HCl IXL (C)
(from Refs. [192,193]).
CONDUCTING POLYMERS:ELECTRICAL CONDUCTIVITY / 739
of the conduction electrons are localized or bound spatially,
and require a finite amount of energy to be excited. At a
lower frequency dispersion, «
1
begins to become positive at
330 cm
1
(0.04 eV); this is a characteristic of the Lor-
entzian (localized) behavior. However, at 200 cm
1
(0.02 eV), «
1
again crosses to negative values and grows
increasingly negative with decreasing wavenumber. This
plasma frequency shows Drude behavior with decreasing
wavenumber and in fact appears approximately at the
frequency predicted by the microwave estimates [73,74].
Similar zero crossings are reported for PPy(PF
6
)(s
DC
300 S=cm) [74,198,199] (Fig. 46.27).
Comparison of the plasma frequencies for the Drude
electrons with the plasma frequencies for the whole conduc-
tion band for these polymers, assuming that the effective
mass m
is the same as that for the whole conduction band
response, yields a ratio of the density of electrons contrib-
uting to the free response compared to the localized
response of 10
3
. Assuming even a tenfold increase in
m
for the lower frequency v
p
(as the delocalized electrons
must traverse the disordered regions with presumably nar-
rowed energy bands), only a small fraction ( 10
2
) of the
conduction electrons are delocalized enough to show Drude
behavior in PAN–CSA (m-cresol).
The frequency response of «
1
for PAN–CSA prepared
from chloroform and subsequently briefly exposed to m-
cresol vapor (s
DC
20 S=cm) [193] (Fig. 46.26) is charac-
teristic of localized electrons. «
1
is positive at all optical
frequencies; the scattering due to disorder in these materials
has broadened and washed out the dielectric zero crossings.
Lorentzian dispersion due to a ‘‘localized polaron’’ [146] is
evident in «
1
around 12,000 cm
1
(1.5 eV) and «
1
for this
material increases positively with decreasing wavenumber
in the far IR, characteristic of a material with a small
residual band gap or localized carriers. Lower conductivity
PAN–HCl [193] (s
DC
10 S=cm) materials show even less
dispersion with wavenumber. «
1
for these materials is also
positive over the whole range and shows only a modest
increase in the IR, becoming nearly wavelength independent
in the far IR.
Polarized optical measurements of the dielectric response
of HCl doped stretched PAN samples are shown in
Fig. 46.28. The dielectric response perpendicular to the
stretch direction is characteristic of insulating behavior.
Along the stretch direction, a strong plasma-like response
is observed [191], indicating that the scattering times along
the chain are much longer than those perpendicular to the
chain. This indicates that on-chain partial delocalization
develops first in these systems.
Doped polypyrrole demonstrates behavior similar to
polyaniline for samples with lower conductivity and struc-
tural order. In Fig. 46.27, the more disordered PPy(TsO)
(s
DC
120 S=cm) [74,198] shows a more localized behav-
ior than PPy(PF
6
)as«
1
remains positive throughout the
optical frequency range. The carriers are weakly localized
though as «
1
increases rapidly in the far IR. For PPy(S-PHE)
(s
DC
10 S=cm) [46,192], there is very little dispersion in
«
1
; it remains positive and small in the entire optical range,
becoming nearly wavelength independent in the far IR.
«
1
for the most highly conducting iodine and perchlorate
doped polyacetylene samples remains negative but small for
frequencies less than its all-conduction-electron plasma fre-
quency of 3 eV through the far IR for light polarized
both parallel and perpendicular to the stretched chain direc-
tion [187,188] (Fig 46.29) again supporting the three-
dimensional nature of the metallic state in conducting poly-
mer systems. Below 0.05 eV, «
1
becomes increasingly
negative, suggesting a Drude plasma frequency for the
most delocalized electrons.
Summarizing, there is an evolution of the dielectric re-
sponse with increasing order. For the most disordered, low-
est conducting samples, «
1
remains positive and shows very
weak dispersion. As the order and conductivity of the ma-
terials increase, «
1
first shows more dispersion at the plasma
edge of the whole conduction band as the scattering time
increases, possibly turning negative in that range, but returns
positive in the far IR. This behavior was seen in stretched
PAN–HCl samples parallel to the stretch direction [191].
For the best current materials, « either returns negative or
remains negative in the far IR, indicative of a small density
of macroscopically delocalized electrons.
46.8.2 Optical Conductivity
For materials near the insulator–metal (localization–
delocalization) transition the optical conductivity is sup-
pressed at low frequencies relative to the usual Drude
conductivity [115]. The suppression is usually strong for
frequencies up to a critical-frequency v
c
D=L
2
where
D is the diffusion coefficient and L is the localization length
for the electron. This conductivity suppression occurs be-
cause the carriers would diffuse a distance greater than the
localization length within the period of the AC wave for
0.01
−50
−25
0
A
B
C
Real(ε)
25
50
0.10
Ener
g
y (eV)
1.00
FIGURE 46.27. Real part of the room temperature dielectric
response («
1
) versus frequency for PPY(PF
6
) (A), PPY(TsO)
(B), and PPY(S-PHE) (C) (from Refs. [74] and [192]).
740 / CHAPTER 46