Moss Tom. DNA-protein interactions: principles and protocols
Подождите немного. Документ загружается.

STEM of DNA–Protein Complexes 595
The main factors considered by the STEM operator in taking data are described
as follows.
All biological specimens are sensitive to electron irradiation (see Note 14).
Because unstained, freeze-dried specimens have only unprotected biological
material, radiation damage to them is particularly noticeable and limits quanti-
tative interpretation. Therefore, searching for suitable areas must be done at
the lowest possible dose (low magnification). Potential areas of interest (AOIs)
are boxed on the display for later scanning. Near the AOIs, but not overlapping
them, focusing areas are placed. The STEM beam is highly collimated with
essentially no intensity outside the 0.3-nm-diameter focused spot, so scanning
one area causes no damage to nearby areas. Once the microscope focus is veri-
fied, an AOI is scanned and displayed (8.5 s per scan). At that point, the scans
are shut off (meaning there is no additional radiation damage) while the opera-
tor evaluates the quality of the data in the scan using the following criteria:
background cleanliness, TMV profile, TMV mass, numbers, shapes, and
masses of sample particles. If the area is suitable for more complete analysis, it
is recorded digitally and processed with another computer program (see Sub-
heading 3.3.).
The STEM control computer is a PC with a custom interface designed to
take full advantage of STEM capabilities. The computer directs the focused
beam, scanning the next AOI upon command and recording the electron counts
striking the two annular detectors (large-angle and small-angle scattering) sur-
rounding the beam. Most of the beam passes through the irradiated spot on the
specimen and strikes a bright-field detector used for normalization. The large-
angle annular detector provides the most useful dark-field signal, which directly
maps the local mass thickness of the specimen. The computer display shows
two 512 × 512-element images (large-angle and small-angle detectors) where
the intensity is proportional to the detector signal. Objects as small as single
heavy atoms or dsDNA are easily visible, especially with zoom or contrast
enhancement. During this decision making, the beam is not scanning, so there
is no additional damage.
Once the image is saved, it can be viewed by any networked computer.
Image files are usually distributed by FTP transfer on the Internet (requir-
ing 1–10 s per image) to users. For users without Ethernet, images can be put
on a CD (1300 images/CD) and mailed.
3.3. Analysis
The STEM images stored on a CD or a hard drive can be viewed using
commercial software or our mass-analysis program, PCMass, provided by the
STEM Group. The format for the BNL STEM images is a header 4096 bytes
long, followed by two 512 × 512, 8-bit images interleaved. Adobe PhotoShop
596 Wall and Simon
can read these images directly using its “AS RAW” option with the above
parameters. We recommend this program for producing publication-quality
images with a high-quality printer.
The PCMass program provides for rapid viewing of STEM images, with the
ability to perform accurate mass measurements on them. This program “reads”
the image header and imports the image data with appropriate settings. Mass
accuracy is most often limited by the cleanliness of the background carbon
film between particles. The first step in analysis with PCMass is to mask out
particles and dirt and measure the background mass per unit area (mass–thick-
ness) in the cleanest areas. There are several diagnostic criteria to indicate the
severity of background problems. The background determination is critical
because the mass of the carbon substrate in the measuring area is usually equal
to or greater than the particle mass and it must be subtracted to get the net
particle mass. If the background quality is less than ideal, mass measurements
can still be made, but their interpretation requires caution.
Manual mass measurements require the user to position a measuring circle
or rectangle around particles of interest using a mouse and keystrokes to change
size. A mouse click or ‘=’ keystroke saves the measurement in a database and
shows the running average and standard deviation for particles in the selected
category. Automated mass measurements use a set of simple comparison mod-
els to align and categorize particles, providing size and shape information as
well as mass. This offers the advantages of speed and reproducible particle
selection, but it is not suitable for complicated specimens such as convoluted
DNA–protein complexes.
Summarizing several thousand (automated) mass measurements for publi-
cation involves answering two basic questions: (1) Are the particle selections
reliable and unambiguous? (2) Is the standard deviation of the mass measure-
ments what would be expected for a homogeneous population of particles with
the observed shape? Frequently, particles will break apart into subunits either
during preparation or attachment to the grid. This may be obvious both by
careful inspection of the images and by mass measurements of the various spe-
cies observed. Knowing the molecular weights of the components facilitates
this sorting. If the automatic particle selection with model fitting was used, one
can view histograms for all the fitting parameters and choose those selection
parameters that exclude clear outliers. However, one must be careful not to
skew the “real” mass distribution.
The expected mass accuracy depends on particle size, shape, and measuring
dose. A 100-kDa globular particle on a 2-nm carbon substrate measured with a
dose of 10 el/Å
2
should give a standard deviation (SD) of 10%, whereas a
1-MDa particle should give 2% (see Note 15). If the particle is extended or the
background is dirty, the SD will be worse. The TMV reference particles should
STEM of DNA–Protein Complexes 597
give mass per unit length of 13.1 kDa/Å with a SD of 1%. With a large number
of measurements, one may be tempted to quote the standard error of the mean,
but this is overly optimistic. Instead, we find that the standard deviation of
image averages (for all images having more than 10 particles) gives a truer
idea of accuracy. One can also plot the total mass histogram and fit multiple
Gaussians to it. If the spread in masses is larger than expected, caution is indicated.
A poor standard deviation, worse than that predicted, is most often caused
by random background problems such as denatured protein, residual salt, and
so forth. Unfortunately, these also give systematic errors that can shift the mea-
surements in either direction. Residual salt tends to accumulate around the
edges of particles (a meniscus effect), which raises the apparent mass. On the
other hand, denatured protein may not be masked completely by the back-
ground program, giving too much subtraction for the background and lowering
the apparent mass.
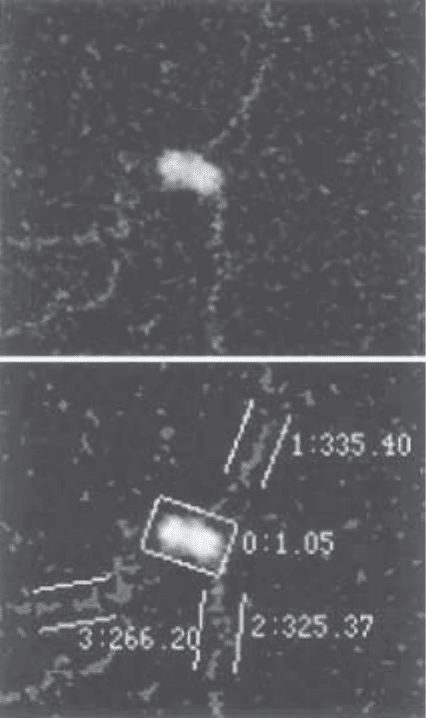
The example shown in Fig. 1 is particularly complex because it has four
dsDNA arms in a Holliday junction complex (see Note 16). In this example,
the M/L of the dsDNA is greater than expected because of deviations from
straightness and/or salt binding. The particle mass is also larger than the
expected value (800 kDa + 2 × 2 kDa/nm × 26 nm = 900 kDa), presumably the
result of binding of fixative or salt.
The TMV control particles are useful in identifying these problems. Residual
salt tends to accumulate in their hollow central hole and along their edges,
giving an increased M/L and an altered radial mass profile. Denatured protein
from the sample tends to decrease the TMV M/L, because the TMV is added
before the sample and tends to protect the substrate from deposition of this
denatured protein. Consequently, one cannot assume that specimen problems
observed on the TMV will be the same for the specimen of interest and some
“fudge factor” will make everything come out right. Rather, it is well worth the
extra effort to try to solve the specimen problems by using added purification,
fixation, other buffers or stabilizing agents (see Subheading 3.1.).
The results from the automated PCMass program are tabulated as TMV M/L,
TMV SD, and the number of particles passing the selection parameters vs the
number measured for each image file. On the same line are the results for
particles selected relative to one model, followed by apparent dose and
background thickness. At the bottom of the summary, the global averages,
standard deviations, and a mass histogram for the selected model are given.
This provides a convenient format to identify images or blocks of images with
problems (e.g., poor TMV). It is not unusual for a single grid to have significant
variations in specimen quality from one area to another, so we strive to collect
good image data in at least three widely separated areas on each specimen.
What is meant by “good” data is then clear: Discarding data based on poor
598 Wall and Simon
TMV measurements is legitimate, whereas discarding data based on poor (un-
expected) particle mass is suspect.
3.4. Conclusion
The STEM, with its ability to provide both mass and structural information,
offers an excellent method for studying protein–DNA complexes. The samples
Fig. 1. A STEM micrograph (top) of a RuvAB-Holliday junction complex (6),
illustrating the mass measurement program (bottom). The box encloses an area 26 nm
wide and 15 nm long, which contains a mass of 1.05 MDa. The three sets of parallel
lines (along three of the DNA branches) enclose areas 12 nm wide by 25 nm long with
mass per length approx 300 Da/Å. Clean, straight dsDNA should have a M/L = 200 Da/Å.
STEM of DNA–Protein Complexes 599
do have to be very clean and the complexes have to be stable under conditions
for applying them to our grids. All of the above information is meant to help
address the potential problems that can arise. However, if these conditions are
met, it is a relatively rapid and inexpensive method of obtaining a lot of infor-
mation about the composition and location of proteins bound to dsDNA. The
quantitative link between observed structure and biochemistry provided by
mass mapping, makes image interpretation highly believable.
4. Notes
1. One cannot see bare dsDNA in a conventional TEM. It can be visualized if it is
stained, shadowed, or imbedded in a spreading solution, but under those condi-
tions, the mass of any protein bound to it cannot be determined.
2. The STEM provides both mass and structural information simultaneously, as does
small-angle scattering. Although the STEM does not have the atomic resolution
of X-ray crystallography, NMR, or cryoEM of 2-D arrays, it also does not depend
on the ability of samples to form arrays. Comparatively, it is rapid and not very
labor intensive. Scanning probe microscopies potentially can offer similar capa-
bilities. Electron spectroscopic imaging techniques are quantitative and offer the
possibility of distinguishing nucleic acids from proteins (6).
3. Single-stranded DNA (ssDNA) has been visualized in the STEM but only under
conditions where it has a lot of secondary structure. If it were fully extended or
stretched, it would be barely detectable in the STEM above the thin-carbon-
film background.
4. Crosslinking conditions can be quite different for different samples. Because
conditions depend on concentration, temperature, and time, frequently the
crosslinking has to be stopped by quenching. It is important that the quencher is
either removed or is known not to interfere with visualization of the complex in
the STEM. Overly crosslinked samples turn into large uninterpretable aggregates.
5. The STEM is a NIH Research Resource. As such, it is available to users with
appropriate projects free of charge. A project is usually initiated by a discussion
of it on the phone or by e-mail. A trial sample is sent by overnight mail to us.
We can make the grids on the day it arrives, if it has been prearranged. The grids
are stored in a grid fridge under liquid nitrogen (stable for years) until they can be
freeze-dried and examined in the microscope. Additional details about the facil-
ity can be found on our web page, most easily accessed from www.bnl.gov, then
click on Scientific Facilities, then on Scanning Transmission Electron Micro-
scope. Our address is http://bnlstb.bio.bnl.gov/biodocs/stem/stem.htmlx
6. A water control grid can be made if it is likely that the water from a lab is a
problem. A 5-µL drop of water is applied to and completely dried on a grid in a
laminar-flow clean hood (which is where the samples are made) and examined in
the STEM. If there is a problem, STEM water (deionized and freshly distilled)
can be sent to the lab to make the buffers for the final steps of sample purifica-
tion. Clean air during sample preparation is also critical, as “dust” particles can
carry both physical and biological contaminants.
600 Wall and Simon
7. Most physical additives (which may improve the biological activity) such as
bovine serum albumin, trypsin, and high concentrations of peptides, oligonucle-
otides, or PEG cannot be used. One way to remove these is by passing the sample
of interest over an appropriate sizing column, if one can be found where it comes
off in the void volume. This can also be a useful way of exchanging salts or
buffers. If one is in a lab where bacteria are a problem, low levels (0.2%) of
sodium azide can be tolerated in buffer solutions. It seems to wash off grids and
not interfere with STEM samples.
8. Ca
2+
often does not wash off well, but Mg
2+
usually does. A buffer containing
Ca
2+
can be washed with Mg
2+
, then ammonium acetate.
9. Some salts and buffers are likely to cause problems. Phosphate buffers often do
not wash off well and leave bright spots, which interfere with the analyses. Some-
times, Tris buffers leave a bad background and they also interfere with glutaral-
dehyde fixation. A buffer control grid is made for a new sample (especially in an
unusual buffer) to see how well the components of the buffer wash off.
10. Carbon films are often made by shadowing onto cleaved mica. We have found
that films made on freshly cleaved NaCl crystals will float off onto a dish of
water much easier than off of mica. Mass analysis of the two background films
are indistinguishable, indicating that they are just as flat.
11. Many experimental details about the grids, films, and shadowing can be found in
Cells: A Laboratory Manual, Vol. 3, pp. 125.2–125.7 (CSH Press, 1998). How-
ever, to simulate STEM conditions for a sample, the only critical step is the thin
carbon film because it is the only surface that the biological materials will see.
Some additional capabilities of the STEM can be found in the same volume,
Chapter 124.
12. Caution: Steps taken to concentrate a sample, such as Centricon filters, may also
concentrate contaminants of the same size.
13. Many, but not all, molecules adsorb well to poly-lysine-pretreated grids. It
may be necessary to change the suggested concentrations to lower ones when
using them.
14. Biological specimens are sensitive to radiation damage by the electron beam. This
manifests itself in two ways, as a loss of mass and a loss of fine detail. For STEM
mass measurements at 40 keV with the specimen at –150°C, the rate of mass loss is
roughly 0.25% for every 1 el/Å
2
. The normal STEM imaging dose is 10 el/Å
2
,
which results in 2.5% mass loss per scan. Measurements are usually done on first
scan images, but it is instructive to do a dose-response curve using sequential scans
of the same area for a new specimen type. Most protein specimens plateau at approx
50% mass loss even at high dose. DNA has much less mass loss, whereas carbohy-
drate has much more. Resolution loss is seen most easily by examining the ends of
TMV rods. These have relatively sharp corners with one end concave and the other
convex. After several scans, the corners become rounded, providing a visual moni-
tor of the accumulated dose to that part of the specimen.
15. The expected error (standard deviation) for mass measurements arises from elec-
tron counting statistics and thickness variations in the thin carbon substrate. These
STEM of DNA–Protein Complexes 601
can be calculated from first principles, but a more straightforward approach is to
use image simulation with the appropriate model shape and mass. The simulation
program places particles in random positions and orientations and adds Poisson
counting noise to produce an image that should closely resemble the speci-
men image, but with homogeneous mass. Mass measurements on the simulated
image should reflect only the random variations inherent in the STEM technique.
16. This complex was particularly difficult because it contained four dsDNA
branches of different lengths, ranging from 660 to 1940 base pairs, which are
long enough for tangling. Also because of these long branches, the complex had
to be exhaustively fixed to hold together on a STEM grid (7).
References
1. Wall, J. S., Hainfeld, J. F., and Simon, M. N. (1998) Scanning transmission elec-
tron microscopy (STEM) of nuclear structures, in Methods in Cell Biology, vol.
53 (Berrios, M., ed.), Academic, New York, pp. 139–164.
2. Antoshechkin, I., Bogenhagen, D. F., and Mastrangelo, I. A. (1997) The HMG-
box mitochondrial transcription factor xl-mtTFA binds DNA as a tetramer to
activate bidirectional transcription. EMBO J. 16, 3198–3206.
3. Citovsky, V., Guralnick, B., Simon, M. N., and Wall, J. S. (1997) The molecular
structure of agrobacterium VirE2-single-stranded DNA complexes involved in
nuclear import. J. Mol. Biol. 271, 718–727.
4. Tumminia, S. J., Hellmann, W., Wall, J. S., and Boublik, M. (1994) Visualization
of protein–nucleic acid interactions involved in the in vitro assembly of the
Escherichia coli 50S ribosomal subunit. J. Mol. Biol. 235, 1239–1250.
5. Caston, J. R., Trus, B. L., Booy, F. P., Wickner, R. B., Wall, J. S., and Steven, A.
C. (1997) Structure of L-A virus: a specialized compartment for the transcription
and replication of double-stranded RNA. J. Cell Biol. 138, 975–985.
6. Bazett-Jones, D. P., Hendzel, M. J., and Kruhlak, M. J. (1999) Stoichiometric
analysis of protein- and nucleic acid-based structures in the cell nucleus. Micron
30, 151–157.
7. Yu, X., West, S. C., and Egelman, E. H. (1997) Structure and subunit composition
of the RuvAB–Holliday junction complex. J. Mol. Biol. 266, 217–222.

Nucleic Acid Recognition Sequences by SELEX 603
603
From:
Methods in Molecular Biology, vol. 148: DNA–Protein Interactions: Principles and Protocols, 2nd ed.
Edited by: T. Moss © Humana Press Inc., Totowa, NJ
42
Determination of Nucleic Acid
Recognition Sequences by SELEX
Philippe Bouvet
1. Introduction
Interactions of proteins with nucleic acids play important roles in biological
phenomenon. Almost every stage in the regulation of gene expression involves
the interaction of proteins with specific nucleic acids sequences. The identifi-
cation of the nucleic acid recognition sequence of a given DNA-binding
protein is therefore often the first step to be undertaken in the study of its
biological function. Over the last 10 yr, the SELEX procedure (systematic
evolution of ligands by exponential enrichment) has been used to identify
high-affinity nucleic acids ligands for a large number of different proteins.
The method was first described for the identification of the DNA and RNA
target sequences of nucleic-acid-binding proteins (1,2) but has since been used
for the selection of the nucleic acid sequence ligands for other kinds of
molecules (3). SELEX uses the power of genetic selection while taking
advantage of in vitro biochemistry. It is a rapid technique that is relatively
easy to implement and can accelerate and simplify nucleic-acid/protein inter-
action studies.
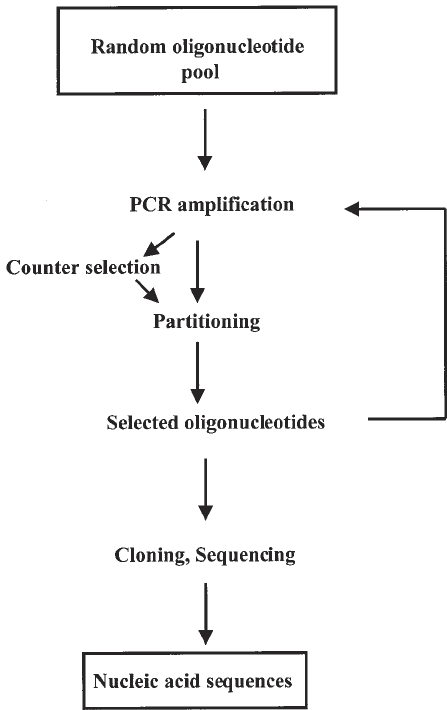
The SELEX procedure involves only the few simple steps described in Fig. 1.
The procedure consists of the selection of a subset of oligonucleotides from a
complex mixture of nucleic acid sequences by repeated rounds of binding to
the protein of interest. First, ligand sequences that bind to the target protein are
partitioned from the unbound sequences. The bound sequences are then ampli-
fied by polymerase chain reaction (PCR). This partitioning and amplification
is repeated until a very significant enrichment of nucleic acid sequences that
bind to the protein with high affinity is obtained. Finally, these sequences are
cloned and analyzed.
604 Bouvet
The strategy is designed to determine an optimal nucleic-acid-binding
sequence, also called an “aptamer” for proteins (4). However, a high-affinity
nucleic acid ligand can be isolated for apparently nonspecific partitioning
agents (e.g., the matrices used for protein immobilization). Therefore, if the
strategy is used to determine the nucleic acid recognition sequence of a pro-
tein, one must realize that the most difficult part of the study will be the analy-
sis of isolated SELEX sequences and the demonstration that these sequences
are relevant to the in vivo function of the protein studied.
Numerous protocols for the SELEX procedure have been used successfully
by different laboratories. In fact, each step of this procedure can be optimized
Fig. 1. Schematic representation of the different steps of SELEX.
Nucleic Acid Recognition Sequences by SELEX 605
(5) and modified as a function of the characteristics of the nucleic-acid-binding
protein being studied.
We provide below a typical protocol that has been used successfully in sev-
eral laboratories (6–9) to identify nucleic acid ligands for RNA-binding pro-
teins. The same synthetic oligonucleotide DNA template can be used for the
selection of DNA sequences by a DNA binding protein. In this case, steps 6
and 18 of the method should be omitted.
2. Materials
1. The following synthetic DNA template (see Note 7) has been used with success by
several laboratories: 5' TGGGCACTATTTATATCAAC (N25) AATGTCGTTG-
GTGGCCC 3' with these flanking primers T
7
5'-CGCGGATCCTAATACG-
ACTCACTATAGGGGCCACCAACGACATT–3' and Rev 5'-CCCGAC
ACCCGCGGATCCATGGGCACTATTTATATCAAC–3'. The T
7
-Xba
primer 5' GGTCTAGATAATACGACTCACTATAGGGG 3' and Rev-HIII
primer 5' ACCGCAAGCTTATGGGCACTATTTATAT 3' can be used for the
final PCR amplification, and will allow an oriented cloning (XbaI and HindIII)
of the PCR product in a cloning vector like pBluescript (Stratagene).
2. Thermocycler.
3. Taq polymerase.
4. TAE (Tris–acetate buffer); 40 mM Tris–acetate and 0.4 mM EDTA (pH 7.5).
5. Partitioning matrix (to be chosen as a function of the studied protein; see Note 1).
6. Nucleic acid electrophoresis system.
7. NT2 buffer: 50 mM Tris-HCl (pH 7.4), 150 mM NaCl, 0.05% NP 40, and 1 mM
MgCl
2
.
8. Binding buffer (BB): 50 mM Tris-HCl (pH 7.5), 150 mM NaCl, 20 mM KCl, 1 mM
dithiothreitol (DTT), 0.05% NP 40, 1 mM MgCl
2
, 2.5% polyvinyl alcohol (PVA),
1 mM EGTA, 50 µg/mL poly(A), 2 µL/mL vanadyl ribonucleoside complex
(VRC), 0.5 µg/mL tRNA, and 125 µg/mL bovine serum albumin (BSA).
9. 5X reverse transcription buffer: 250 mM Tris-HCl (pH 8.5), 40 mM MgCl
2
, 5 mM
DTT, 250 µg/mL BSA, 150 mM KCl.
10. 1X transcription buffer: 40 mM Tris-HCl (pH 7.5), 6 mM MgCl
2
, 2 mM spermi-
dine, 10 mM NaCl, and 10 mM DTT.
3. Method
1. About 10 pmol of synthetic template DNA (N25) (see Note 2) is amplified by
PCR in a standard 100-µL reaction, in a 500-µL test tube, using 2 µL of a mix of
all four dNTPs (10 mM each) and 500 ng of each primer. One unit of Taq poly-
merase is added just before the start of the amplification procedure. If the
thermocycler does not have a hot cover, the reaction mixture is overlayed with
2 drops of mineral oil.
2. Set up the thermocycler with the following cycle conditions: denaturation 1 min
at 94°C, annealing 1 min at 50°C, and elongation 1 min at 72°C (see Note 8).