Nigel S., Chambers S., Johnson R. Operations Management
Подождите немного. Документ загружается.

Assignable causes of variation
Not all variation in processes is the result of common causes. There may be something wrong
with the process which is assignable to a particular and preventable cause. Machinery may
have worn or been set up badly. An untrained person may not be following prescribed pro-
cedures. The causes of such variation are called assignable causes. The question is whether
the results from any particular sample, when plotted on the control chart, simply represent
the variation due to common causes or due to some specific and correctable assignable cause.
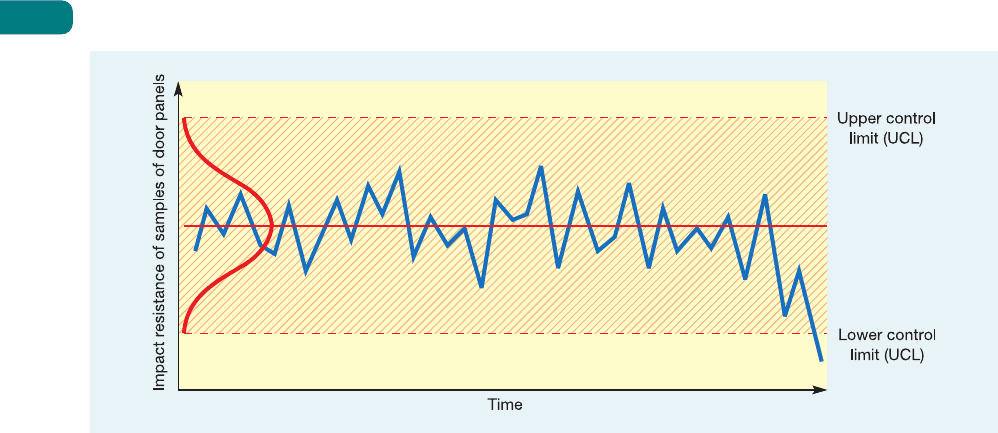
Figure S17.4, for example, shows the control chart for the average impact resistance of samples
of door panels taken over time. Like any process the results vary, but the last three points
seem to be lower than usual. So, is this natural (common cause) variation, or the symptom
of some more serious (assignable) cause?
To help make this decision, control limits can be added to the control chart (the red
dashed lines) which indicates the expected extent of ‘common-cause’ variation. If any points
lie outside these control limits (the shaded zone) then the process can be deemed out of
control in the sense that variation is likely to be due to assignable causes. These control limits
could be set intuitively by examining past variation during a period when the process was
thought to be free of any variation which could be due to assignable causes. But control
limits can also be set in a more statistically revealing manner. For example, if the process
which tests door panels had been measured to determine the normal distribution which
represents its common-cause variation, then control limits can be based on this distribution.
Figure S17.4 also shows how control limits can be added; here they are put at ±3 standard
deviations (of the population of sample means) away from the mean of sample averages. It
shows that the probability of the final point on the chart being influenced by an assignable
cause is very high indeed. When the process is exhibiting behaviour which is outside its
normal ‘common-cause’ range, it is said to be ‘out of control’. Yet there is a small but finite
chance that the (seemingly out of limits) point is just one of the rare but natural results at
the tail of the distribution which describes perfectly normal behaviour. Stopping the process
under these circumstances would represent a type I error because the process is actually
in control. Alternatively, ignoring a result which in reality is due to an assignable cause is a
type II error (see Table S17.1).
Control limits are usually set at three standard deviations either side of the population
mean. This would mean that there is only a 0.3 per cent chance of any sample mean falling
outside these limits by chance causes (that is, a chance of a type I error of 0.3 per cent). The
control limits may be set at any distance from the population mean, but the closer the limits
Part Three Planning and control
524
Figure S17.4 Control chart for the impact resistance of door panels, together with control limits
Control limits
M17B_SLAC0460_06_SE_C17B.QXD 10/20/09 9:52 Page 524

are to the population mean, the higher the likelihood of investigating and trying to rectify a
process which is actually problem-free. If the control limits are set at two standard deviations,
the chance of a type I error increases to about 5 per cent. If the limits are set at one standard
deviation then the chance of a type I error increases to 32 per cent. When the control limits
are placed at ±3 standard deviations away from the mean of the distribution which describes
‘normal’ variation in the process, they are called the upper control limit (UCL) and lower
control limit (LCL).
The Taguchi loss function
Genichi Taguchi proposed a resolution of both the criticisms of SPC described in the critical
commentary box.
12
He suggested that the central issue was the first problem – namely that
the consequences of being ‘off-target’ (that is, deviating from the required process average
performance) were inadequately described by simple control limits. Instead, he proposed a
quality loss function (QLF) – a mathematical function which includes all the costs of poor
quality. These include wastage, repair, inspection, service, warranty and generally, what he
termed, ‘loss to society’ costs. This loss function is expressed as follows:
L = D
2
C
where
L = total loss to society costs
D = deviation from target performance
C = a constant.
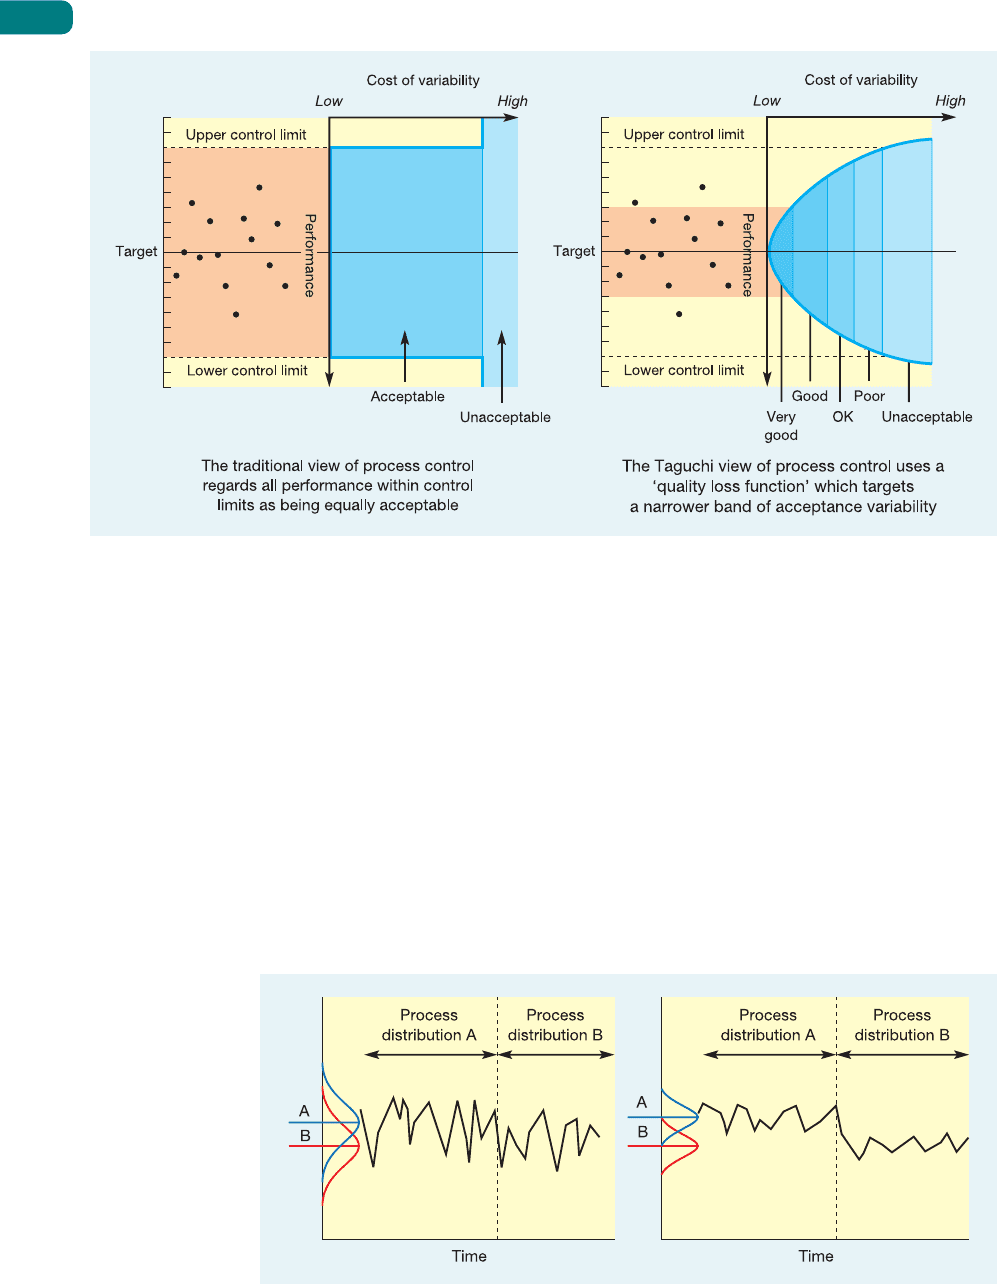
Figure S17.5 illustrates the difference between the conventional and Taguchi approaches
to interpreting process variability. The more graduated approach of the QLF also answers the
second problem raised in the critical commentary box. With losses increasing quadratically
as performance deviates from target, there is a natural tendency to progressively reduce pro-
cess variability. This is sometimes called a target-oriented quality philosophy.
Supplement to Chapter 17 Statistical process control (SPC)
525
Table S17.1 Type I and type II errors in SPC
Actual process state
Decision In control Out of control
Stop process Type I error Correct decision
Leave alone Correct decision Type II error
When its originators first described SPC more than half a century ago, the key issue was only
to decide whether a process was ‘in control’ or not. Now, we expect SPC to reflect common
sense as well as statistical elegance and promote continuous operations improvement.
This is why two (related) criticisms have been levelled at the traditional approach to SPC.
The first is that SPC seems to assume that any values of process performance which lie
within the control limits are equally acceptable, while any values outside the limits are not.
However, surely a value close to the process average or ‘target’ value will be more accept-
able than one only just within the control limits. For example, a service engineer arriving
only 1 minute late is a far better ‘performance’ than one arriving 59 minutes late, even if the
control limits are ‘quoted time ± one hour’. Also, arriving 59 minutes late would be almost
as bad as 61 minutes late! Second, a process always within its control limits may not be
deteriorating, but is it improving. So rather than seeing control limits as fixed, it would be
better to view them as a reflection of how the process is being improved. We should expect
any improving process to have progressively narrowing control limits.
Critical commentary
Upper control limit
Lower control limit
Quality loss function
Target-oriented quality
M17B_SLAC0460_06_SE_C17B.QXD 10/20/09 9:52 Page 525
Why variability is a bad thing
Assignable variation is a signal that something has changed in the process which therefore
must be investigated. But normal variation is itself a problem because it masks any changes
in process behaviour. Figure S17.6 shows the performance of two processes both of which are
subjected to a change in their process behaviour at the same time. The process on the left has
such a wide natural variation that it is not immediately apparent that any change has taken
place. Eventually it will become apparent because the likelihood of process performance
violating the lower (in this case) control limit has increased, but this may take some time.
By contrast, the process on the right has a far narrower band of natural variation. Because
of this, the same change in average performance is more easily noticed (both visually and
statistically). So, the narrower the natural variation of a process, the more obvious are changes
in the behaviour of that process. And the more obvious are process changes, the easier it is to
understand how and why the process is behaving in a particular way. Accepting any variation
in any process is, to some degree, admitting to ignorance of how that process works.
Part Three Planning and control
526
Figure S17.5 The conventional and Taguchi views of the cost of variability
Figure S17.6 Low process variation allows changes in process performance to be readily
detected
M17B_SLAC0460_06_SE_C17B.QXD 10/20/09 9:52 Page 526

Supplement to Chapter 17 Statistical process control (SPC)
527
Control charts for attributes
Attributes have only two states – ‘right’ and ‘wrong’, for example – so the statistic calculated
is the proportion of wrongs (p) in a sample. (This statistic follows a binomial distribution.)
Control charts using p are called ‘p-charts’. In calculating the limits, the population mean (F)
– the actual, normal or expected proportion of ‘defectives’ or wrongs to rights – may not be
known. Who knows, for example, the actual number of city commuters who are dissatisfied
with their journey time? In such cases the population mean can be estimated from the
average of the proportion of ‘defectives’ (F), from m samples each of n items, where m should
be at least 30 and n should be at least 100:
F =
One standard deviation can then be estimated from:
The upper and lower control limits can then be set as:
UCL = F + 3 standard deviations
LCL = F − 3 standard deviations.
Of course, the LCL cannot be negative, so when it is calculated to be so it should be rounded
up to zero.
F(1 − F)
n
p
1
+ p
2
+ p
3
+ ...+ p
n
m
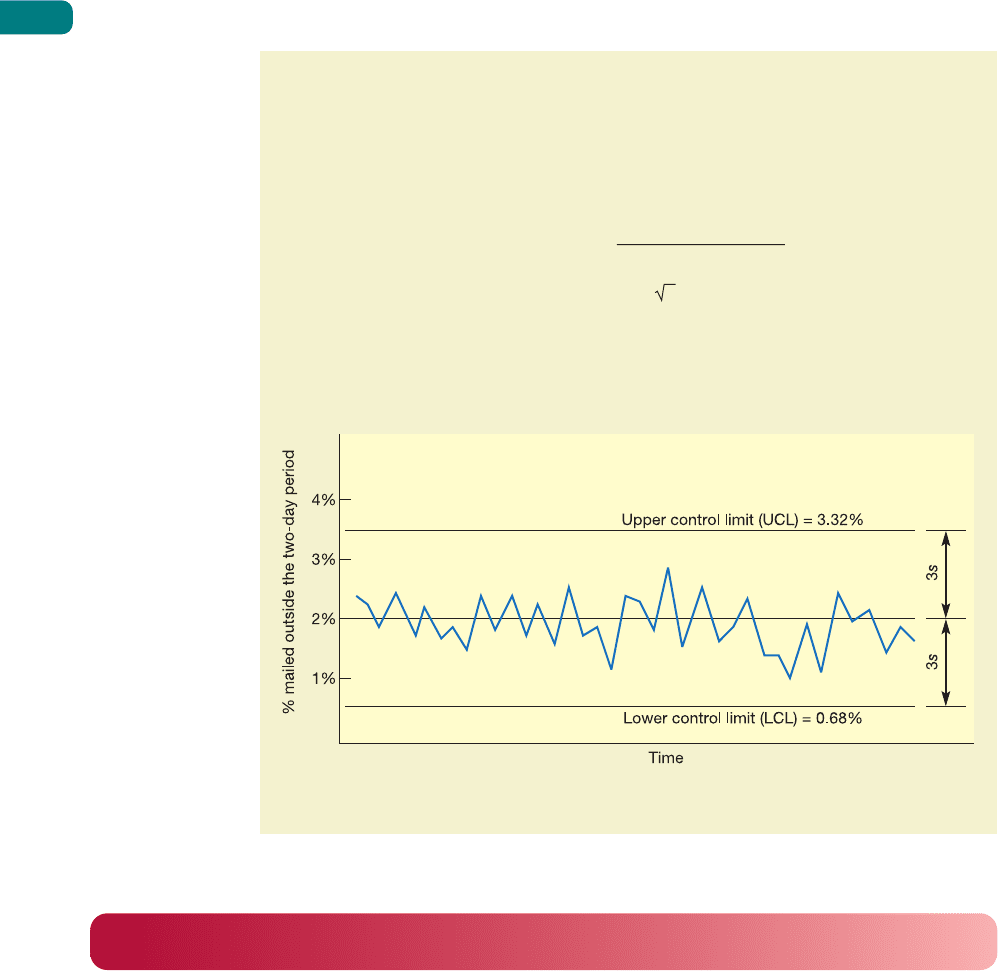
A credit card company deals with many hundreds of thousands of transactions every week.
One of its measures of the quality of service it gives its customers is the dependability
with which it mails customers’ monthly accounts. The quality standard it sets itself is that
accounts should be mailed within two days of the ‘nominal post date’ which is specified
to the customer. Every week the company samples 1,000 customer accounts and records
the percentage which was not mailed within the standard time. When the process is
working normally, only 2 per cent of accounts are mailed outside the specified period,
that is, 2 per cent are ‘defective’.
Control limits for the process can be calculated as follows:
Mean proportion defective, F = 0.02
Sample size n = 1,000
Standard deviation s =
=
= 0.0044
With the control limits at F ±3s:
Upper control limit (UCL) = 0.02 + 3(0.0044) = 0.0332
= 3.32%
and
lower control limit (LCL) = 0.02 − 3(0.0044) = 0.0068
= 0.68%
0.02(0.98)
1,000
F(1 − F)
n
Worked example
➔
M17B_SLAC0460_06_SE_C17B.QXD 10/20/09 9:52 Page 527
Part Three Planning and control
528
Figure S17.7 shows the company’s control chart for this measure of quality over the last
few weeks, together with the calculated control limits. It also shows that the process is in
control. Sometimes it is more convenient to plot the actual number of defects (c) rather
than the proportion (or percentage) of defectives, on what is known as a c-chart. This is
very similar to the p-chart but the sample size must be constant and the process mean
and control limits are calculated using the following formulae:
Process mean E =
Control limits = E ± 3 c
where
c = number of defects
m = number of samples
c
1
+ c
2
+ c
3
+ ...+ c
m
m
Figure S17.7 Control chart for the percentage of customer accounts which are mailed
outside their two-day period
Control chart for variables
The most commonly used type of control chart employed to control variables is the B – R
chart. In fact this is really two charts in one. One chart is used to control the sample average
or mean (B). The other is used to control the variation within the sample by measuring the
range (R). The range is used because it is simpler to calculate than the standard deviation of
the sample.
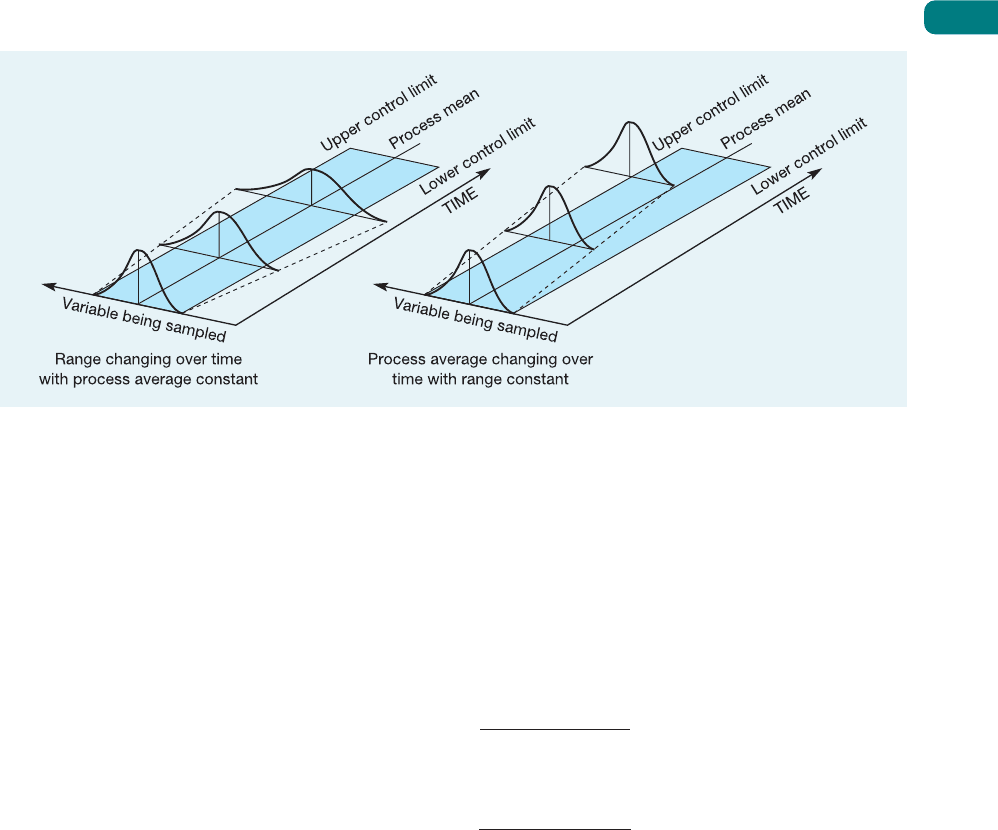
The means (B) chart can pick up changes in the average output from the process being
charted. Changes in the means chart would suggest that the process is drifting generally away
from its supposed process average, although the variability inherent in the process may not
have changed (see Fig. S17.8).
The range (R) chart plots the range of each sample, that is the difference between the largest
and the smallest measurement in the samples. Monitoring sample range gives an indication
of whether the variability of the process is changing, even when the process average remains
constant (see Fig. S17.8).
M17B_SLAC0460_06_SE_C17B.QXD 10/20/09 9:52 Page 528
Control limits for variables control chart
As with attributes control charts, a statistical description of how the process operates under
normal conditions (when there are no assignable causes) can be used to calculate control
limits. The first task in calculating the control limits is to estimate the grand average or
population mean (D) and average range (A) using m samples each of sample size n.
The population mean is estimated from the average of a large number (m) of sample
means:
D =
The average range is estimated from the ranges of the large number of samples:
A =
The control limits for the sample means chart are:
Upper control limit (UCL) = D + A
2
A
Lower control limit (LCL) = D − A
2
A
The control limits for the range charts are:
Upper control limit (UCL) = D
4
A
Lower control limit (LCL) = D
3
A
The factors A
2
, D
3
and D
4
vary with sample size and are shown in Table S17.2.
The LCL for the means chart may be negative (for example, temperature or profit may
be less than zero) but it may not be negative for a range chart (or the smallest measurement
in the sample would be larger than the largest). If the calculation indicates a negative LCL for
a range chart then the LCL should be set to zero.
R
1
+ R
2
+ ...+ R
m
m
B
1
+ B
2
+ ...+ B
m
m
Supplement to Chapter 17 Statistical process control (SPC)
529
Figure S17.8 The process mean or the process range (or both) can change over time
M17B_SLAC0460_06_SE_C17B.QXD 10/20/09 9:52 Page 529

Part Three Planning and control
530
Table S17.2 Factors for the calculation of control limits
Sample size n A
2
D
3
D
4
2 1.880 0 3.267
3 1.023 0 2.575
4 0.729 0 2.282
5 0.577 0 2.115
6 0.483 0 2.004
7 0.419 0.076 1.924
8 0.373 0.136 1.864
9 0.337 0.184 1.816
10 0.308 0.223 1.777
12 0.266 0.284 1.716
14 0.235 0.329 1.671
16 0.212 0.364 1.636
18 0.194 0.392 1.608
20 0.180 0.414 1.586
22 0.167 0.434 1.566
24 0.157 0.452 1.548
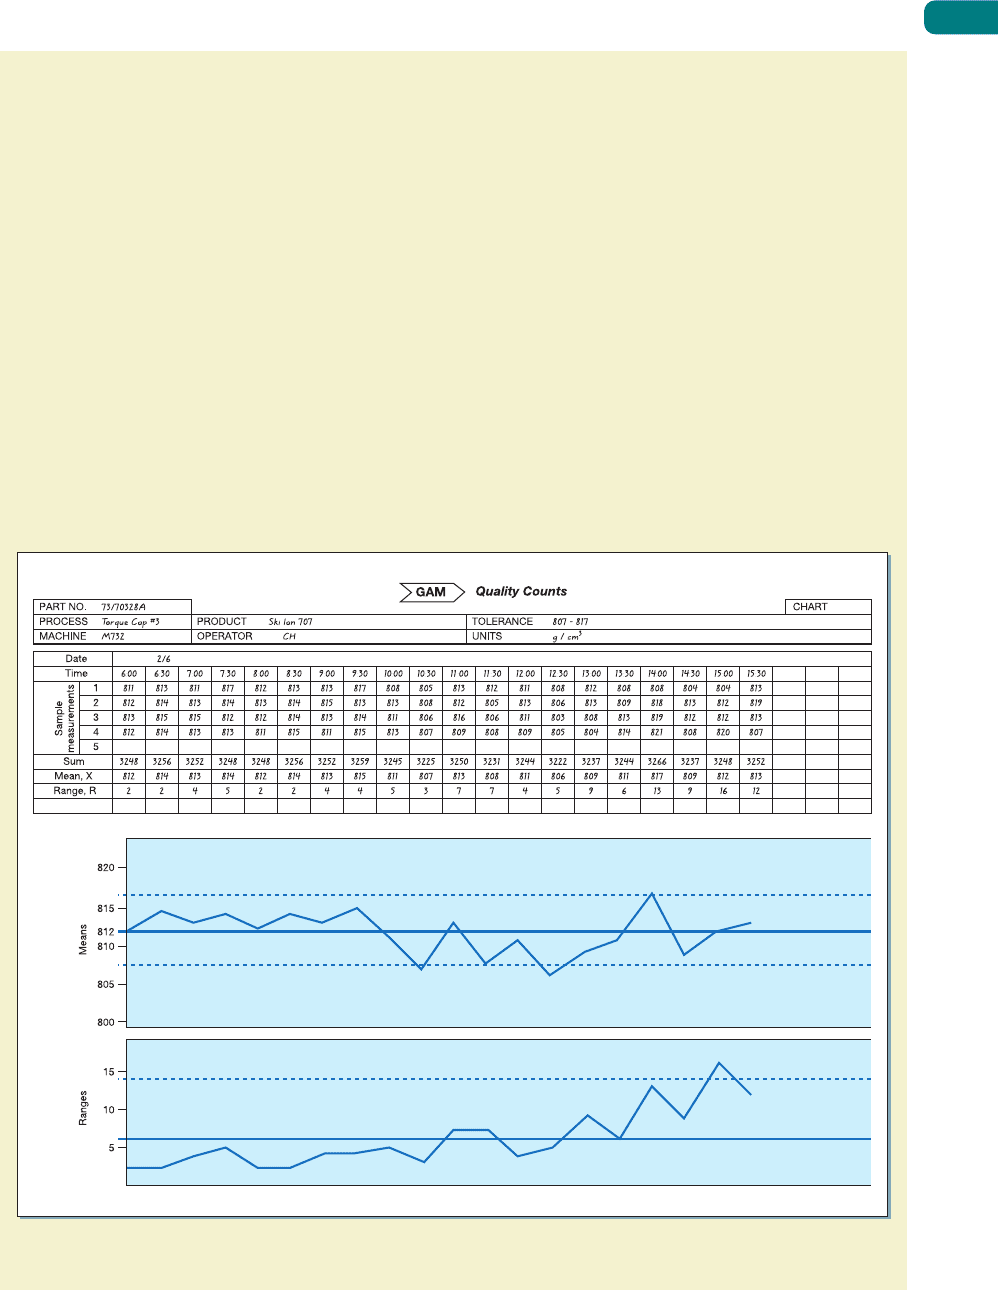
GAM (Groupe As Maquillage) is a contract cosmetics company, based in France but with
plants around Europe, which manufactures and packs cosmetics and perfumes for other
companies. One of its plants, in Ireland, operates a filling line which automatically fills
plastic bottles with skin cream and seals the bottles with a screw-top cap. The tightness
with which the screw-top cap is fixed is an important part of the quality of the filling line
process. If the cap is screwed on too tightly, there is a danger that it will crack; if screwed
on too loosely it might come loose when packed. Either outcome could cause leakage
of the product during its journey between the factory and the customer. The Irish plant
had received some complaints of product leakage which it suspected was caused by
inconsistent fixing of the screw-top caps on its filling line. The ‘tightness’ of the screw
tops could be measured by a simple test device which recorded the amount of turning
force (torque) that was required to unfasten the tops. The company decided to take
samples of the bottles coming out of the filling-line process, test them for their unfasten-
ing torque and plot the results on a control chart. Several samples of four bottles were
taken during a period when the process was regarded as being in control. The following
data were calculated from this exercise:
The grand average of all samples D = 812 g/cm
3
The average range of the sample A = 6 g/cm
3
Control limits for the means (B) chart were calculated as follows:
UCL = D + A
2
A
= 812 + (A
2
× 6)
From Table 17.6, we know, for a sample size of four, A
2
= 0.729. Thus:
UCL = 812 + (0.729 × 6)
= 816.37
LCL = D − (A
2
A)
= 812 – (0.729 × 6)
= 807.63
Worked example
M17B_SLAC0460_06_SE_C17B.QXD 10/20/09 9:52 Page 530
Supplement to Chapter 17 Statistical process control (SPC)
531
Control limits for the range chart (R) were calculated as follows:
UCL = D
4
× A
= 2.282 × 6
= 13.69
LCL = D
3
A
= 0 × 6
= 0
After calculating these averages and limits for the control chart, the company regularly
took samples of four bottles during production, recorded the measurements and plotted
them as shown in Figure S17.9. The control chart revealed that only with difficulty could
the process average be kept in control. Occasional operator interventions were required.
Also the process range was moving towards (and once breaking) the upper control limit.
The process seemed to be becoming more variable. After investigation it was discovered
that, because of faulty maintenance of the line, skin cream was occasionally contaminat-
ing the torque head (the part of the line which fitted the cap). This resulted in erratic
tightening of the caps.
Figure S17.9 The completed control form for GAM’s torque machine showing the mean (X
¯
) and range (R
¯
)
charts
M17B_SLAC0460_06_SE_C17B.QXD 10/20/09 9:52 Page 531
Part Three Planning and control
532
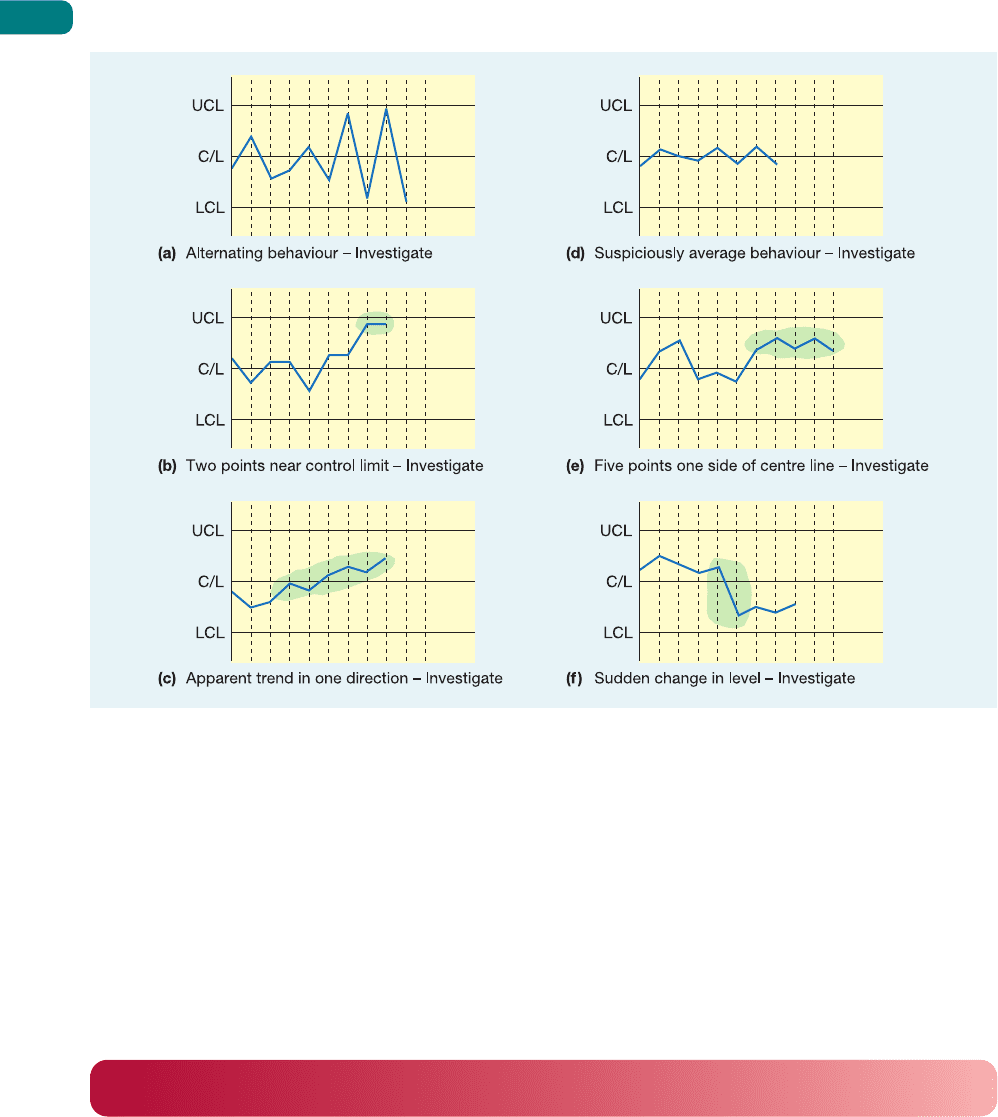
Figure S17.10 In addition to points falling outside the control limits, other unlikely sequences of points should be
investigated
Interpreting control charts
Plots on a control chart which fall outside control limits are an obvious reason for believing
that the process might be out of control, and therefore for investigating the process. This is
not the only clue which could be revealed by a control chart, however. Figure S17.10 shows
some other patterns which could be interpreted as behaviour sufficiently unusual to warrant
investigation.
Process control, learning and knowledge
In recent years the role of process control and SPC in particular, has changed. Increasingly,
it is seen not just as a convenient method of keeping processes in control, but also as an activity
which is fundamental to the acquisition of competitive advantage. This is a remarkable shift
in the status of SPC. Traditionally it was seen as one of the most operational, immediate
and ‘hands-on’ operations management techniques. Yet it is now being connected with an
operation’s strategic capabilities. This is how the logic of the argument goes:
1 SPC is based on the idea that process variability indicates whether a process is in control
or not.
M17B_SLAC0460_06_SE_C17B.QXD 10/20/09 9:52 Page 532

Supplement to Chapter 17 Statistical process control (SPC)
533
2 Processes are brought into control and improved by progressively reducing process vari-
ability. This involves eliminating the assignable causes of variation.
3 One cannot eliminate assignable causes of variation without gaining a better understand-
ing of how the process operates. This involves learning about the process, where its nature
is revealed at an increasingly detailed level.
4 This learning means that process knowledge is enhanced, which in turn means that
operations managers are able to predict how the process will perform under different
circumstances. It also means that the process has a greater capability to carry out its tasks
at a higher level of performance.
5 This increased process capability is particularly difficult for competitors to copy. It cannot
be bought ‘off-the-shelf’. It only comes from time and effort being invested in controlling
operations processes. Therefore, process capability leads to strategic advantage.
In this way, process control leads to learning which enhances process knowledge and
builds difficult-to-imitate process capability.
Acceptance sampling
Process control is usually the preferred method of controlling quality because quality is being
‘built in’ to the process rather than being inspected afterwards. However, sometimes it may
be necessary to inspect batches of products or services either before or after a process. The
purpose of acceptance sampling is to decide whether, on the basis of a sample, to accept or
reject the whole batch, for example a batch of component parts from a supplier. Acceptance
sampling uses the proportion of wrongs to rights (or defectives to acceptable) and is usually
carried out on attributes rather than variables. Again, it is important to understand the
risks inherent in using a sample to make a judgement about a far larger batch. Table S17.3
illustrates the risks of acceptance sampling in the form of type I and type II errors. In accept-
ance sampling the type I risk is often referred to as the producer’s risk because it is the risk
that the operation rejects a batch that is actually of good quality. The type II risk is usually
called the consumer’s risk because it is the risk of accepting a batch that is actually poor and
sending it to the consumer of the product or service.
Table S17.3 The risks inherent in acceptance sampling
Decision The batch actually is
OK Not OK
Reject batch Type I error Correct decision
Accept batch Correct decision Type II error
Sampling plans
Acceptance sampling involves a sample being taken from a batch and a decision to accept
or reject the batch being made by comparing the number of ‘defects’ found in the sample to
a predetermined acceptable number. The sampling plan which describes this procedure is
defined by two factors, n and c, where:
n = the sample size
c = the acceptance number of defects in the sample.
Process knowledge
Sampling plan
M17B_SLAC0460_06_SE_C17B.QXD 10/20/09 9:52 Page 533