Paul Hopkin. Fundamentals of Risk Management
Подождите немного. Документ загружается.

14 Introduction to risk management
The application of risk management tools and techniques to the management of hazard risks
is the best and longest-established branch of risk management, and much of this text will con-
centrate on hazard risks. There is a hierarchy of controls that apply to hazard risks and this will
be discussed in a later chapter. Hazard risks are associated with a source of potential harm or
a situation with the potential to undermine objectives in a negative way. Hazard risks are the
most common risks associated with organizational risk management, including occupational
health and safety programmes.
Control risks are associated with unknown and unexpected events. They are sometimes
referred to as uncertainty risks and they can be extremely diffi cult to quantify. Control risks
are often associated with project management. In these circumstances, it is known that the
events will occur, but the precise consequences of those events are diffi cult to predict and
control. Therefore, the approach is based on minimizing the potential consequences of these
events.
There are two main aspects associated with opportunity risks. There are risks/dangers associ-
ated with taking an opportunity, but there are also risks associated with not taking the oppor-
tunity. Opportunity risks may not be visible or physically apparent, and they are often fi nancial
in nature. Although opportunity risks are taken with the intention of having a positive
outcome, this is not guaranteed. Opportunity risks for small businesses include moving a
business to a new location, acquiring new property, expanding a business and diversifying into
new products.
Risk description
In order to fully understand a risk, a detailed description is necessary so that a common under-
standing of the risk can be identifi ed and ownership/responsibilities may be clearly under-
stood. Table 1.2 provides information on the range of information that must be recorded to
fully understand a risk. The list of information set out in Table 1.2 is most applicable to hazard
risks and the list will need to be modifi ed to provide a full description of control or opportu-
nity risks.
So that the correct range of information can be collected about each risk, the distinction
between hazard, control and opportunity risks needs to be clearly understood. The example
below is intended to distinguish between these three types of risk, so that the information
required in order to describe each type of risk can be identifi ed.

Approaches to defi ning risk 15
Table 1.2 Risk description
Name or title of risk •
Statement of risk, including scope of risk and details of possible events and •
dependencies
Nature of risk, including details of the risk classifi cation and timescale of potential
•
impact
Stakeholders in the risk, both internal and external
•
Risk attitude, appetite, tolerance or limits for the risk •
Likelihood and magnitude of event and consequences should the risk materialize at •
current/residual level
Control standard required or target level of risk
•
Incident and loss experience •
Existing control mechanisms and activities •
Responsibility for developing risk strategy and policy •
Potential for risk improvement and level of confi dence in existing controls •
Risk improvement recommendations and deadlines for implementation •
Responsibility for implementing improvements •
Responsibility for auditing risk compliance •
Computer viruses
In order to understand the distinction between hazard, control and opportunity risks,
the example of the use of computers is useful. Virus infection is an operational or
hazard risk and there will be no benefi t to an organization suffering a virus attack on
its software programs. When an organization installs or upgrades a software package,
control risks will be associated with the upgrade project.
The selection of new software is also an opportunity risk, where the intention is to
achieve better results by installing the new software, but it is possible that the new
software will fail to deliver all of the functionality that was intended and the
opportunity benefi ts will not be delivered. In fact, the failure of the functionality of the
new software system may substantially undermine the operations of the organization.

16 Introduction to risk management
Inherent level of risk
It is important to understand the uncontrolled level of all risks that have been identifi ed. This
is the level of the risk before any actions have been taken to change the likelihood or magni-
tude of the risk. Although there are advantages in identifying the inherent level of risk, there
are practical diffi culties in identifying this with certain types of risks.
Identifying the inherent level of the risk enables the importance of the control measures in
place to be identifi ed. The Institute of Internal Auditors (IIA) has the view that the assessment
of all risks should commence with the identifi cation of the inherent level of the risk. The guid-
ance from the IIA states that ‘in the risk assessment, we look at the inherent risks before con-
sidering any controls.’ The new International Risk Management Standard, ISO 31000,
recommends that risks are assessed at both inherent and current levels.
Often, a risk matrix will be used to show the inherent level of the risk in terms of likelihood
and magnitude. The reduced or current level of the risk can then be identifi ed, after the control
or controls have been put in place. The effort that is required to reduce the risk from its inher-
ent level to its current level can be clearly indicted on the risk matrix.
Terminology varies and the inherent level of risk is sometimes referred to as the absolute risk
or gross risk. Also, the current level of risk is often referred to as the residual level or the
managed level of risk. The example in the box below provides an example of how inherently
high-risk activities are reduced to a lower level of risk by the application of sensible and practi-
cal risk response options.
Crossing the road
Crossing a busy road would be inherently dangerous if there were no controls in place
and many more accidents would occur. When a risk is inherently dangerous, greater
attention is paid to the control measures in place, because the perception of risk is
much higher. Pedestrians do not cross the road without looking and drivers are always
aware that pedestrians may step into the road. Often, other traffi c calming control
measures are necessary to reduce the speed of the motorists or increase the risk
awareness of both motorists and pedestrians.
Risk classifi cation systems
Risks can be classifi ed according to the nature of the attributes of the risk, such as timescale
for impact, and the nature of the impact and/or likely magnitude of the risk. They can also
Approaches to defi ning risk 17
be classifi ed according to the timescale of impact after the event occurs. The source of the
risk can also be used as the basis of classifi cation. In this case, a risk may be classifi ed accord-
ing to its origin, such as counterparty or credit risk.
A further way of classifying risks is to consider the nature of the impact. Some risks can cause
detriment to the fi nances of the organization, whereas others will have an impact on the activ-
ities or the infrastructure. Further, risks may have an impact on the reputation of the organi-
zation or on its status and the way it is perceived in the marketplace.
Individual organizations will decide on the risk classification system that suits them best,
depending on the nature of the organization and its activities. Also, many risk manage-
ment standards and frameworks suggest a specific risk classification system. If the organ-
ization adopts one of these standards, then it will tend to follow the classification system
recommended.
The risk classifi cation system that is selected should be fully relevant to the organization con-
cerned. There is no universal classifi cation system that fulfi ls the requirements of all organiza-
tions. It is likely that each risk will need to be classifi ed in several ways in order to clearly
understand its potential impact. However, many classifi cation systems offer common or
similar structures, as will be described in later chapters.
Risk likelihood and magnitude
Risk likelihood and magnitude are best demonstrated using a risk map, sometimes referred
to as a risk matrix. Risk maps can be produced in many formats. Whatever format is used
for a risk map, it is a very valuable tool for the risk management practitioner. The basic style
of risk map plots the likelihood of an event against the magnitude or impact should the
event materialize.
Figure 1.1 is an illustration of a simple risk matrix, sometimes referred to as a heat map. This
is a commonly used method of illustrating risk likelihood and the magnitude (or severity) of
the event should the risk materialize. The use of the risk matrix to illustrate risk likelihood and
magnitude is a fundamentally important risk management tool. The risk matrix can be used
to plot the nature of individual risks, so that the organization can decide whether the risk is
acceptable and within the risk appetite and/or risk capacity of the organization.
Throughout this book, a standard format for presenting a risk map has been adopted. The
horizontal axis is used to represent likelihood. The term likelihood is used rather than fre-
quency, because the word frequency implies that events will defi nitely occur and the map is
registering how often these events take place. Likelihood is a broader word that includes fre-
quency, but also refers to the chances of an unlikely event happening. However, in risk man-
agement literature, the word probability will often be used to describe the likelihood of a risk
materializing.

18 Introduction to risk management
Magnitude
Likelihood
Low likelihood
High magnitude
High likelihood
High magnitude
Low likelihood
Low magnitude
High likelihood
Low magnitude
Figure 1.1 Risk likelihood and magnitude
The vertical axis is used to indicate magnitude in Figure 1.1. The word magnitude is used
rather than severity, so that the same style of risk map can be used to illustrate hazard, control
and opportunity risks. Severity implies that the event is undesirable and is, therefore, related
to hazard risks.
Figure 1.1 maps likelihood against the magnitude of an event. However, the more important
consideration for risk managers is not the magnitude of the event, but the impact or conse-
quences. For example, a large fi re could occur that completely destroys a warehouse of a dis-
tribution and logistics company. Although the magnitude of the event may be large, if the
company has produced plans to cope with such an event, the impact on the overall business
may be much less than would otherwise be anticipated.
The magnitude of an event may be considered to be the inherent level of the event and the
impact can be considered to be the risk-managed level. Because the impact (or consequences)
of an event is usually more important than its magnitude (or severity), then every risk matrix
used in the remainder of this book will plot impact against likelihood, rather than magnitude
against likelihood.
The risk matrix will be used throughout this book to provide a visual representation of risks.
It can also be used to indicate the likely risk control mechanisms that can be applied. The
risk matrix can also be used to record the inherent, current (or residual) and target levels of
the risk.
Colour coding is often used on the risk matrix to provide a visual representation of the impor-
tance of each risk under consideration. As risks move towards the top right-hand corner of the

Approaches to defi ning risk 19
risk matrix, they become more likely and have a greater impact. Therefore, the risk becomes
more important and immediate and effective risk control measures need to be introduced.
As a practical example of risk management in action at strategic level, consider the uncertain-
ties embedded in the merger involving Delta Airlines and Northwest Airlines. This illustrates
that organizations take strategic decisions that involve high levels of risk and uncertainty.
There will be considerable uncertainties relating to whether all of the benefi ts outlined below
can be delivered in practice.
Uncertainty in strategic decisions
An agreement has been reached and, barring any roadblocks from antitrust authorities,
Delta Airlines and Northwest Airlines are merging and will operate under the Delta
Airlines name. Delta Airlines released information outlining the basic elements of the
deal and the ramifi cations it foresees for the new airline and its passengers.
The list of benefi ts it sees by merging
Combining Delta and Northwest will create a global US carrier that can •
compete with foreign airlines that continue to increase service to the United
States.
Customers and communities will benefi
t from access to a global route system •
and a more fi
nancially stable airline.
More destinations will result in more schedule options and more opportunities •
to earn and redeem frequent fl yer
miles.
Delta customers will benefi
t from Northwest’s routes to Asian markets and •
Northwest’s customers will benefi
t from Delta’s routes to other markets.
Delta and Northwest complementary common membership in the SkyTeam •
alliance will ease the integration risk that has complicated some airline mergers.
2
Impact of risk on organizations
Risk importance
Following the events in the world fi nancial system during 2008, all organizations are taking a
greater interest in risk and risk management. It is increasingly understood that the explicit
management of risks brings benefi ts. By taking a proactive approach to risk and risk manage-
ment, organizations will be able to achieve the following three areas of improvement:
Operations will become more effi cient because events that can cause disruption will be •
identifi
ed in advance and actions taken to reduce the likelihood of these events occur-
ring, reducing the damage caused by these events and containing the cost of the events
that can cause disruption to normal effi
cient production operations.
Processes will be more effective, because consideration will have been given to selection •
of the processes and the risks involved in the alternatives that may be available. Also,
process changes that are delivered by way of projects will be more effectively and reli-
ably delivered.
Strategy will be more effi
cacious in that the risks associated with different strategic •
options will be fully analysed and better strategic decisions will be reached. Effi cacious
refers to the fact that the strategy that will be developed will be fully capable of deliver-
ing the required outcomes.
It is no longer acceptable for organizations to fi
nd themselves in a position whereby unex-
pected events cause fi
nancial loss, disruption to normal operations, damage to reputation and
loss of market presence. Stakeholders now expect that organizations will take full account of
the risks that may cause disruption within operations, late delivery of projects or failure to
deliver strategy.
The exposure presented by an individual risk can be defi ned in terms of the likelihood of the
risk materializing and the impact of the risk when it does materialize. As risk exposure
20

Impact of risk on organizations 21
increases, then likely impact will also increase. Throughout this book, the term impact is used
in preference to the alternative word, consequences. This is because the term impact is pre-
ferred in business continuity planning evaluations.
Injury to key player
A sports club will wish to reduce the chances of a key player being absent through
injury. However, key players do get injured and the club will need to consider the
impact of such an event in advance of it happening. If the injury is serious, the player
may be absent for a signifi cant length of time. There is likely to be a substantial impact,
which will be most obvious on the pitch where the success of the team is likely to be
reduced. However, other consequences may also result and these could include the loss
of revenue from the sale of shirts and other merchandise with that player’s name and
number. Arrangements to reduce the potential for loss of income should also be
considered.
Impact of hazard risks
Hazard risks undermine objectives, and the level of impact of such risks is a measure of their
signifi cance. Risk management has its longest history and earliest origins in the management
of hazard risks. Hazard risk management is closely related to the management of insurable
risks. Remember that a hazard (or pure) risk can only have a negative outcome.
Hazard risk management is concerned with issues such as health and safety at work, fi re pre-
vention, damage to property and the consequences of defective products. Hazard risks can
cause disruption to normal operations, as well as resulting in increased costs and poor public-
ity associated with disruptive events.
Hazard risks are related to business dependencies, including IT and other supporting services.
There is increasing dependence on the IT infrastructure of most organizations and IT systems
can be disrupted by computer breakdown or fi re in server rooms, as well as virus infection and
deliberate hacking or computer attacks.
Theft and fraud can also be signifi cant hazard risks for many organizations. This is especially
true for organizations handling cash or managing a signifi cant number of fi nancial transac-
tions. Techniques relevant to the avoidance of theft and fraud include adequate security pro-
cedures, segregation of fi nancial duties, and authorization and delegation procedures, as well
as the vetting of staff prior to employment.
22 Introduction to risk management
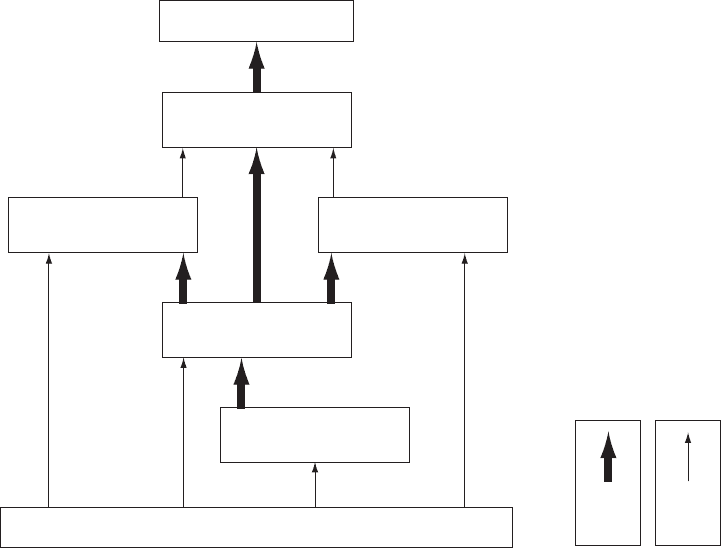
Attachment of risks
Although most standard defi nitions of risk referred to risks as being attached to corporate
objectives, Figure 2.1 provides an illustration of the options for the attachment of risks. Risks
are shown in the diagram as being capable of impacting the key dependencies that deliver the
core processes of the organization. Corporate objectives and stakeholder expectations help
defi ne the core processes of the organization. These core processes are key components of the
business model and can relate to operations, projects and corporate strategy.
The intention of Figure 2.1 is to demonstrate that signifi cant risks can be attached to features
of the organization other than corporate objectives. Signifi cant risks can be identifi ed by con-
sidering the key dependencies of the organization, the corporate objectives and/or the stake-
holder expectations, as well as by analysis of the core processes of the organization.
In the build-up to the recent fi nancial crisis, banks and other fi nancial institutions established
operational and strategic objectives. By analysing these objectives and identifying the risks that
could prevent the achievement of them, risk management made a contribution to the achieve-
ment of the high-risk objectives that ultimately led to the failure of the organizations. This
example illustrates that attaching risks to attributes other than objectives is not only possible
but may well have been desirable in these circumstances.
Mission statement
Signicant risks
Strategic or business plan
(and annual budget)
Corporate objectives Stakeholder expectations
Core processes
Key dependencies
Support
or
deliver
Impact
or
attach
Figure 2.1 Attachment of risks
Impact of risk on organizations 23
It is clearly the case that risks are greater in circumstances of change. Therefore, linking risks
to change objectives is not unreasonable, but the analysis of each objective in turn may not
lead to robust risk recognition/identifi cation. In any case, business objectives are usually stated
at too high a level for the successful attachment of risks.
To be useful to the organization, the corporate objectives should be presented as a full state-
ment of the short, medium and long-term aims of the organization. Internal, annual, change
objectives are usually inadequate, because they may fail to fully identify the operational (or
effi ciency), change (or competition) and strategic (or leadership) requirements of the organi-
zation.
The most important disadvantage associated with the ‘objectives-driven’ approach to risk and
risk management is the danger of considering risks out of the context that gave rise to them.
Risks that are analysed in a way that is separated from the situation that led to them will not
be capable of rigorous and informed evaluation. It can be argued that a more robust analysis
can be achieved when a ‘dependencies-driven’ approach to risk management is adopted.
It remains the case that many organizations continue to use an analysis of corporate objectives
as a means of identifying risks, because some benefi ts do arise from this approach. For example,
using this ‘objectives-driven’ approach facilitates the analysis of risks in relation to the positive
and uncertain aspects of the events that may occur, as well as facilitating the analysis of the
negative aspects.
If the decision is taken to attach risks to the objectives of the organization, then it is important
that these objectives have been fully and completely developed. Not only do the objectives
need to be challenged to ensure that they are full and complete, but the assumptions that
underpin the objectives should also receive careful and critical attention.
Core processes will be discussed later in this book and may be considered as the high level
processes that drive the organization. In the example of a sports club, one of the key processes
is the operational process ‘delivering successful results on the pitch’. Risks may be attached to
this core process, as well as being attached to objectives and/or key dependencies.
Although risks can be attached to other features of the organization, the standard approach is
to attach risks to corporate objectives. One of the standard defi nitions of risk is that it is some-
thing that can impact (undermine, enhance or cause doubt) the achievement of corporate
objectives. This is a useful defi nition, but it does not provide the only means of identifying sig-
nifi cant risks.
Risk and reward
Another feature of risk and risk management is that many risks are taken by an organization
in order to achieve a reward. Figure 2.2 illustrates the relationship between the level of risk and