Principles of Finance with Excel (Основы финансов c Excel)
Подождите немного. Документ загружается.

PFE Chapter 28, Charts and graphs in Excel page 3
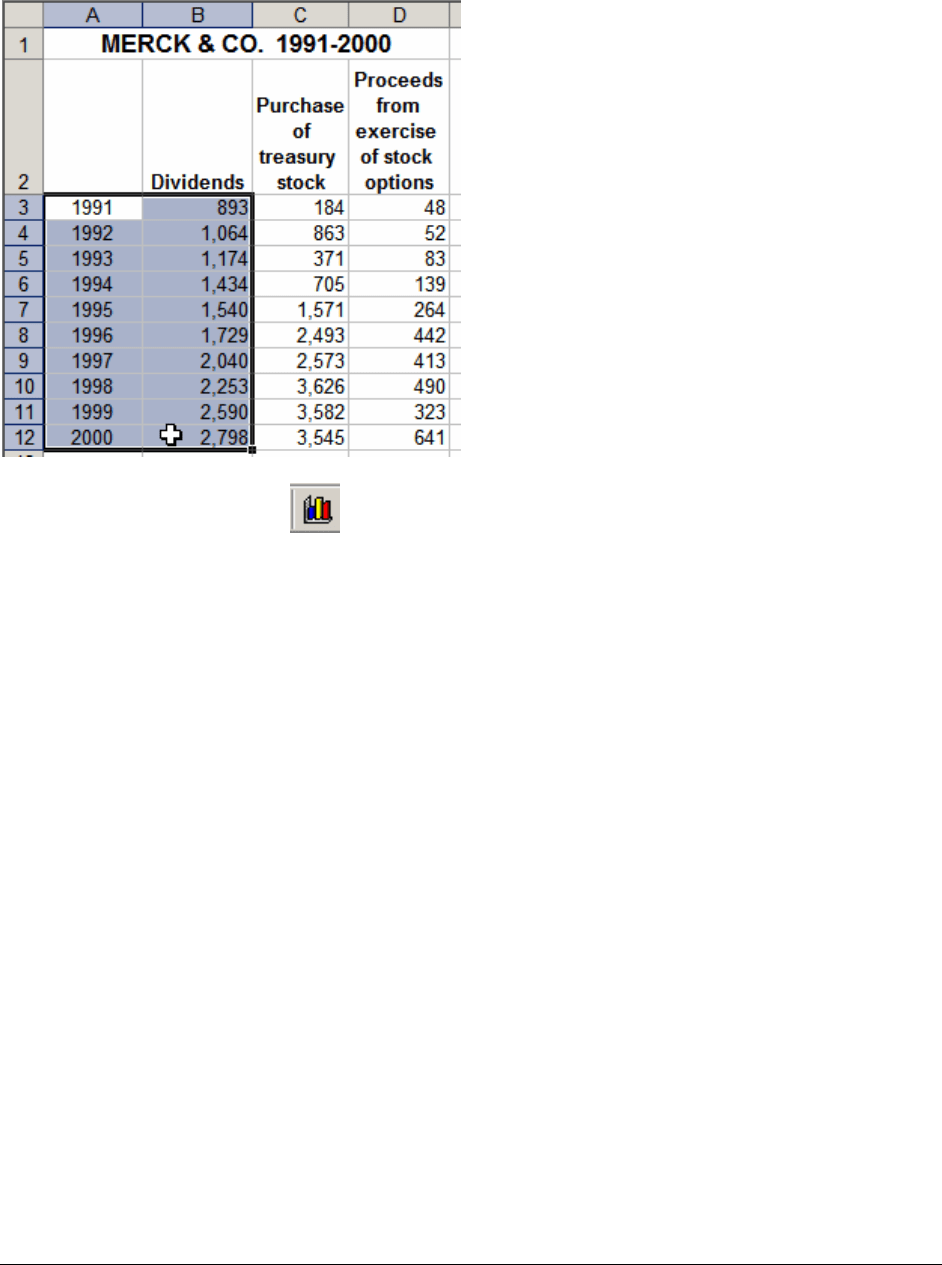
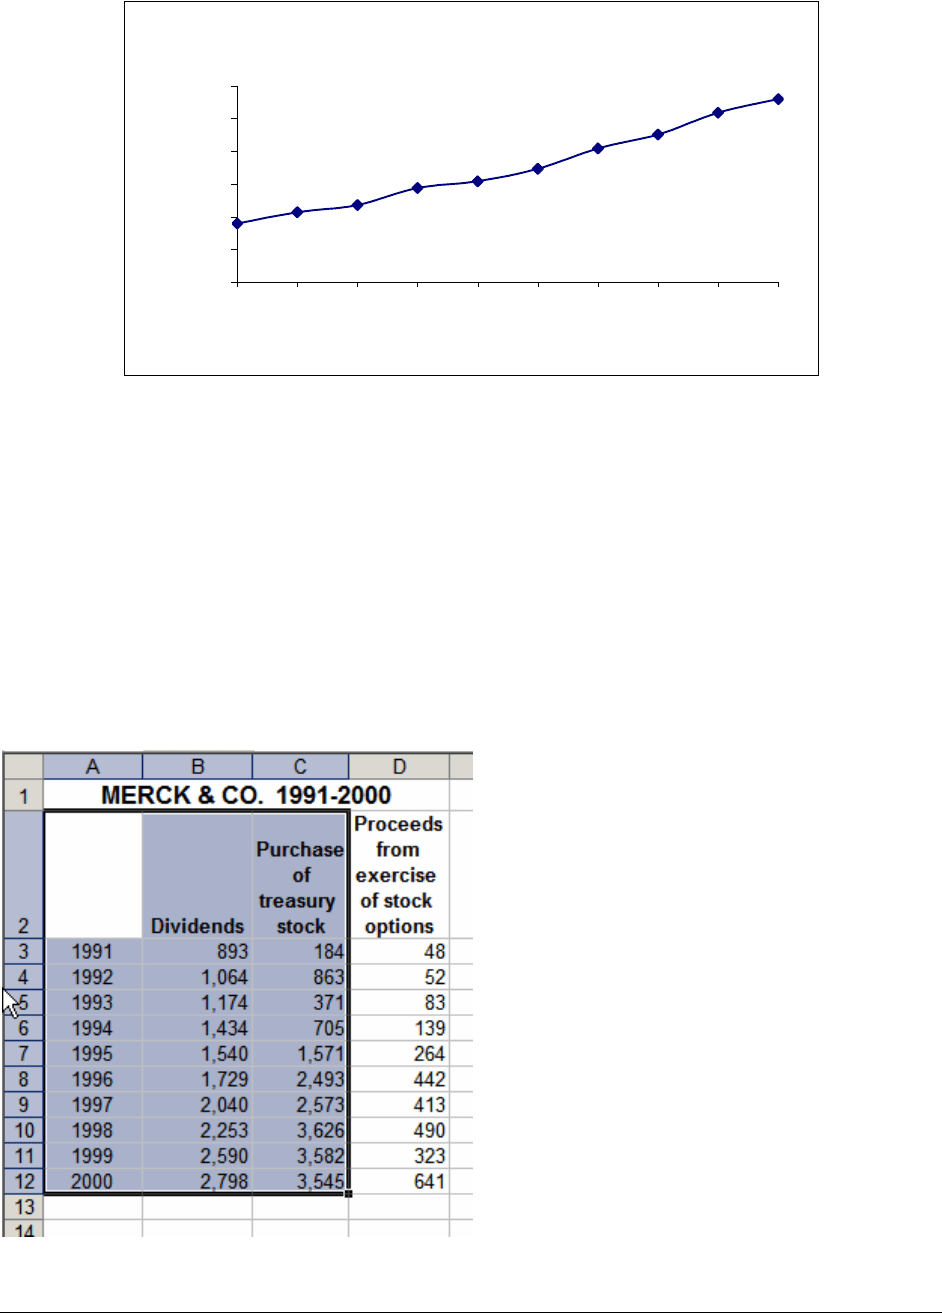
To create a graph that shows the dividends paid each year, we mark the relevant data:
Clicking on the chart icon on the toolbar brings up the chart menu, which gives a
bewildering variety of chart options. Being finance people, we’re primarily interested in the XY
(Scatter) chart option. We usually want to draw a connected line (shown here as the chosen
“Chart sub-type”):
PFE Chapter 28, Charts and graphs in Excel page 4
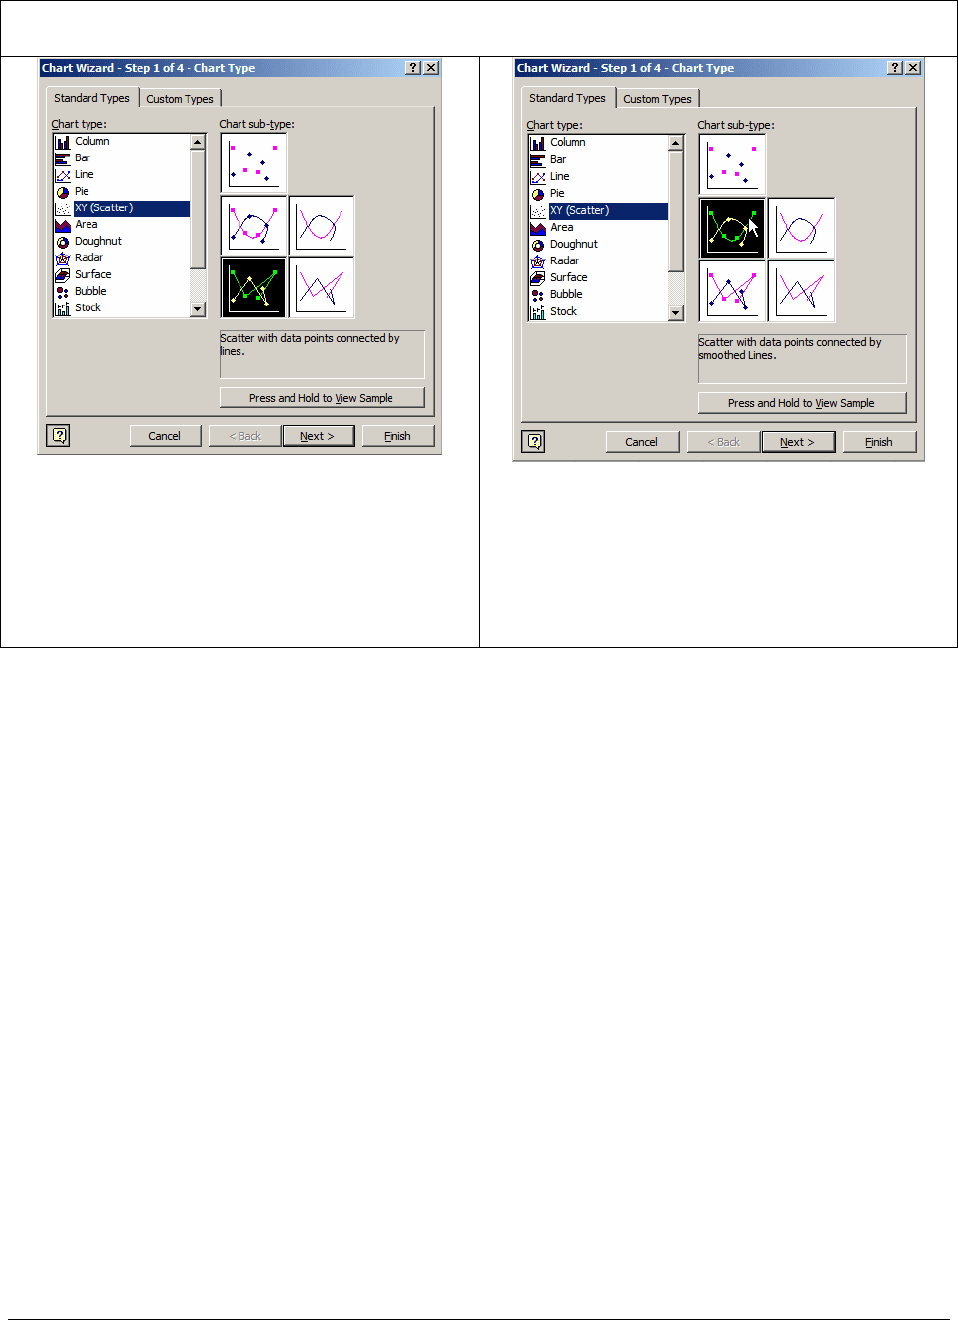
Two options for “connected” Excel XY Charts
This creates a “jagged” XY chart (the points
are connected by line segments. It is the
option we generally use in this book
This smooths the lines connecting the points.
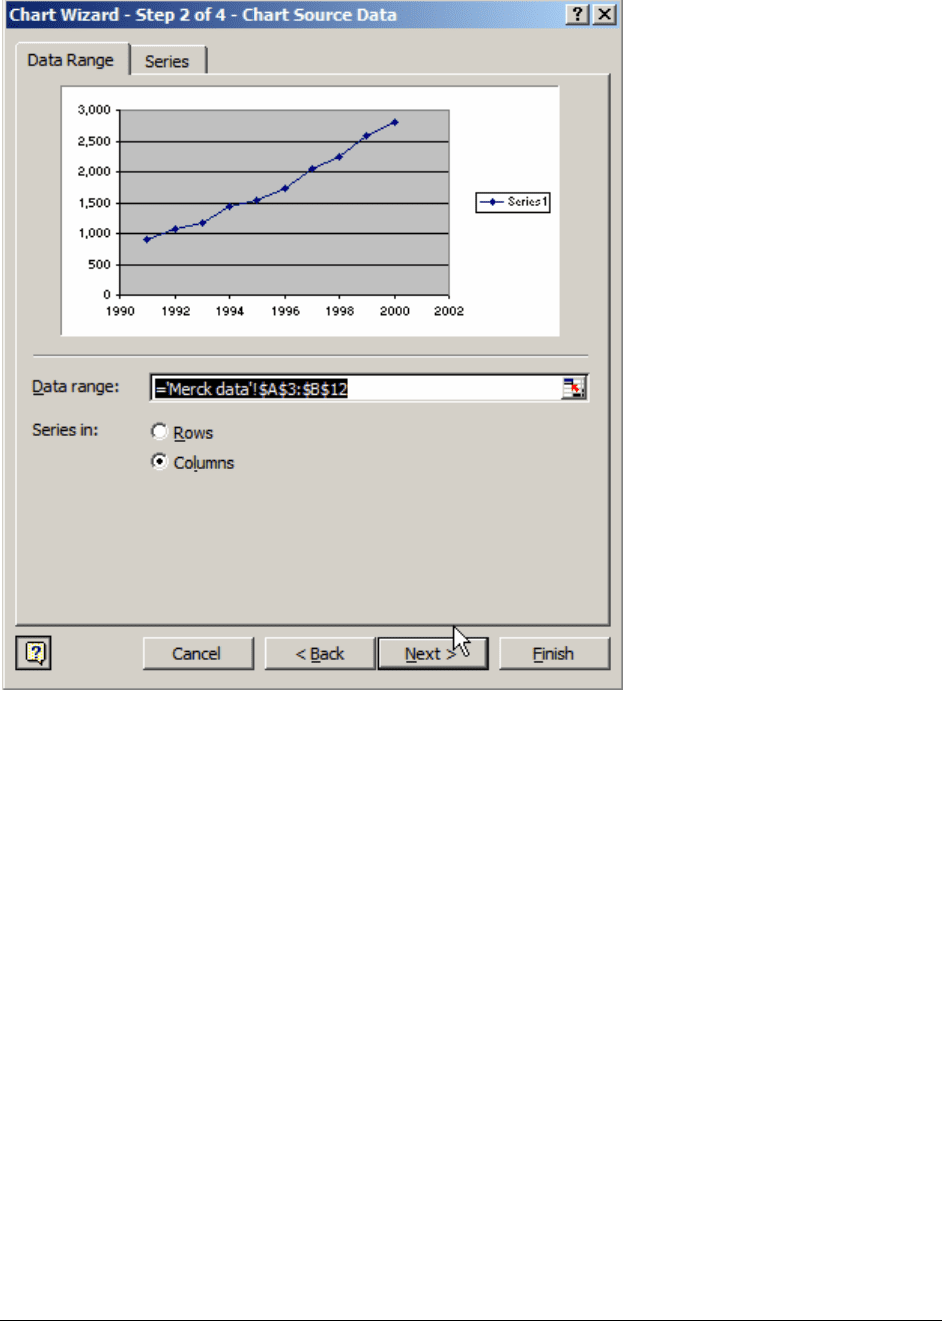
Going to the next step in the chart wizard, you’ll see:
PFE Chapter 28, Charts and graphs in Excel page 5
There’s nothing much to do here, so press Next and go on to the next step, which allows
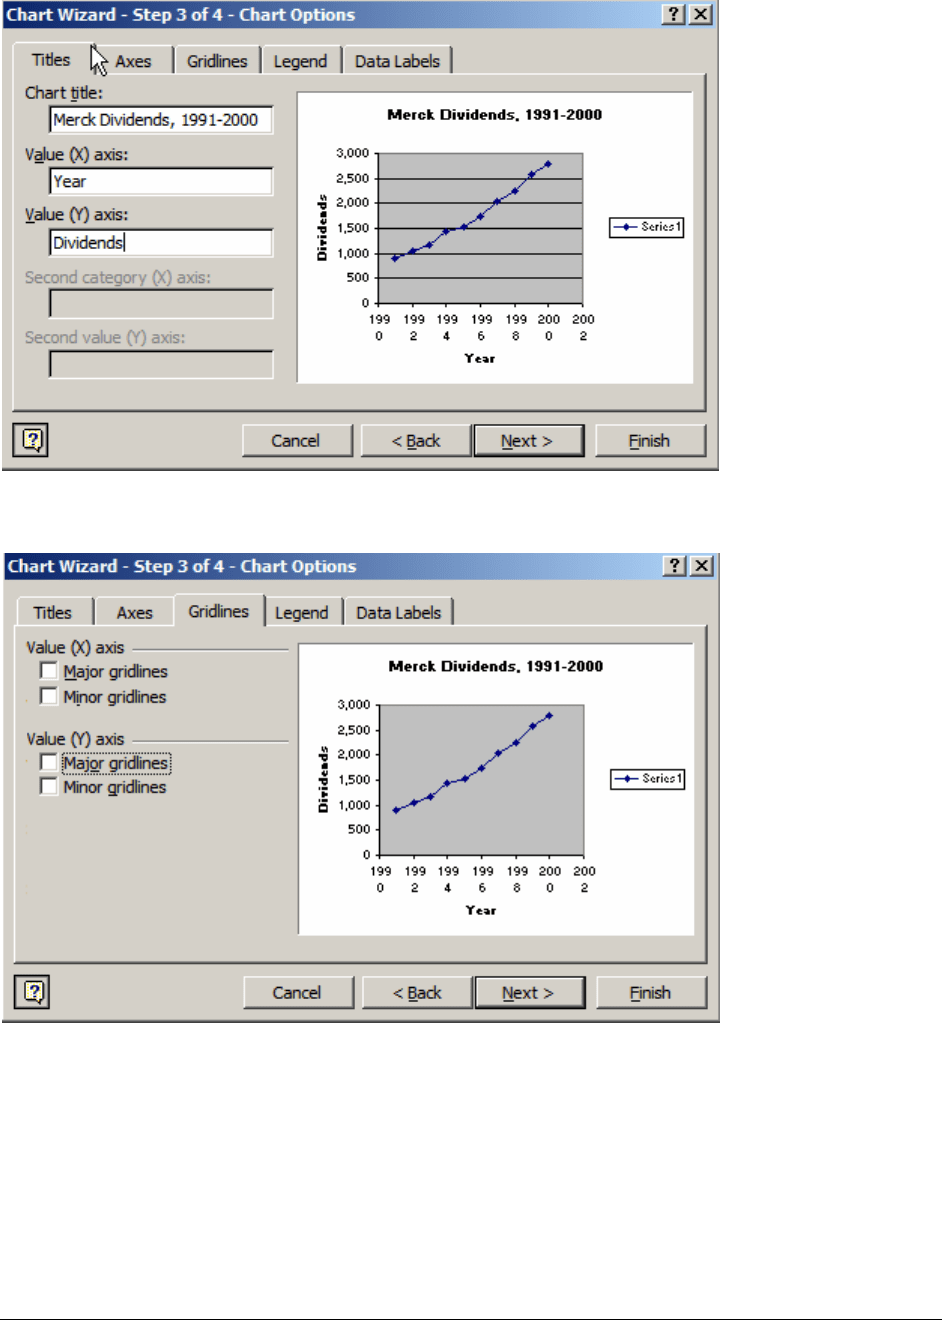
you to annotate the graph with titles:
PFE Chapter 28, Charts and graphs in Excel page 6
This author doesn’t like gridlines of any sort!:
Nor does he like legends very much ... though sometimes there’s room for one (see
Section ???):
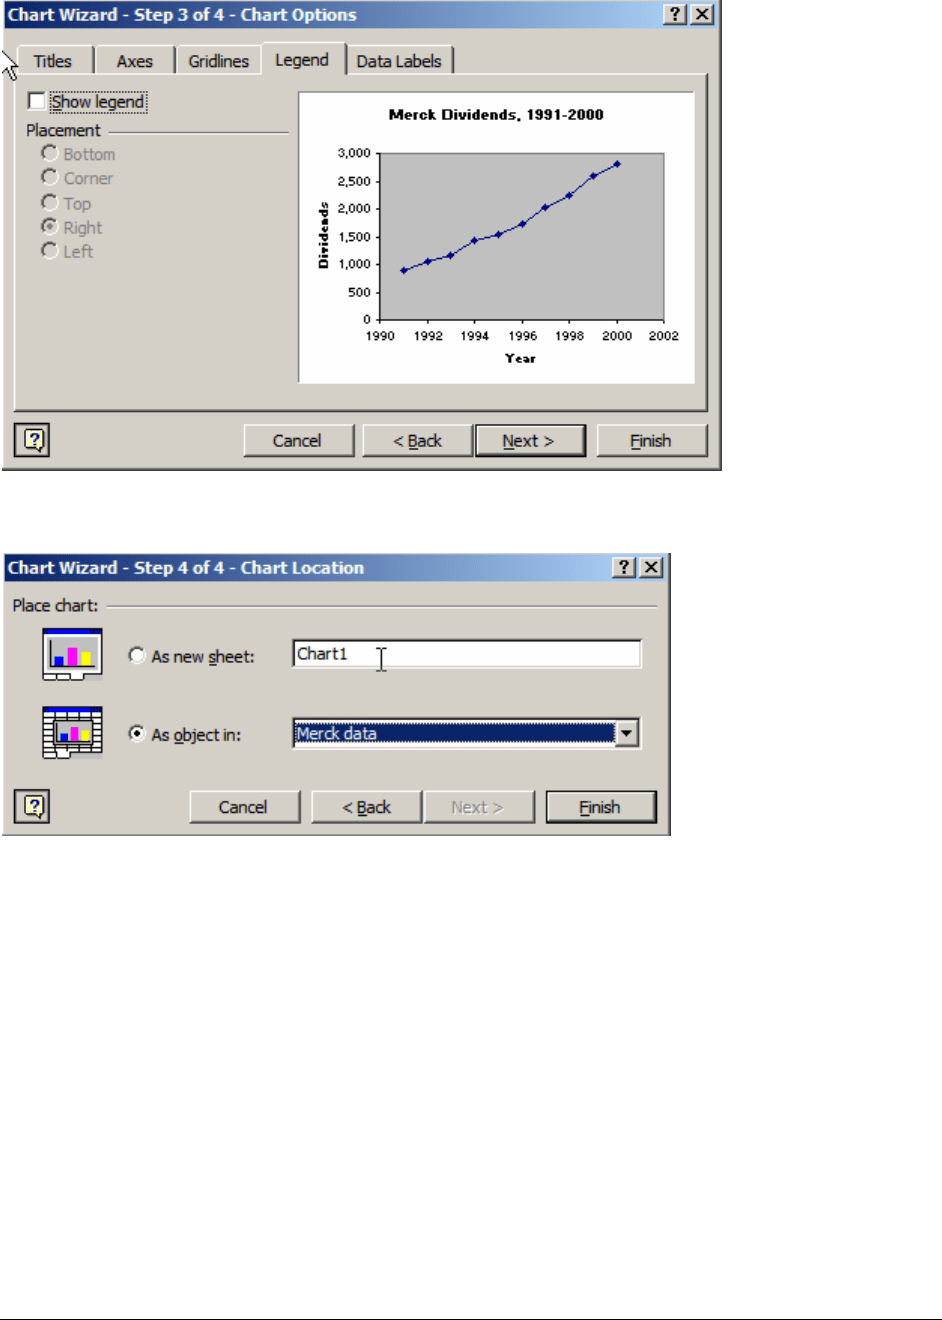
PFE Chapter 28, Charts and graphs in Excel page 7
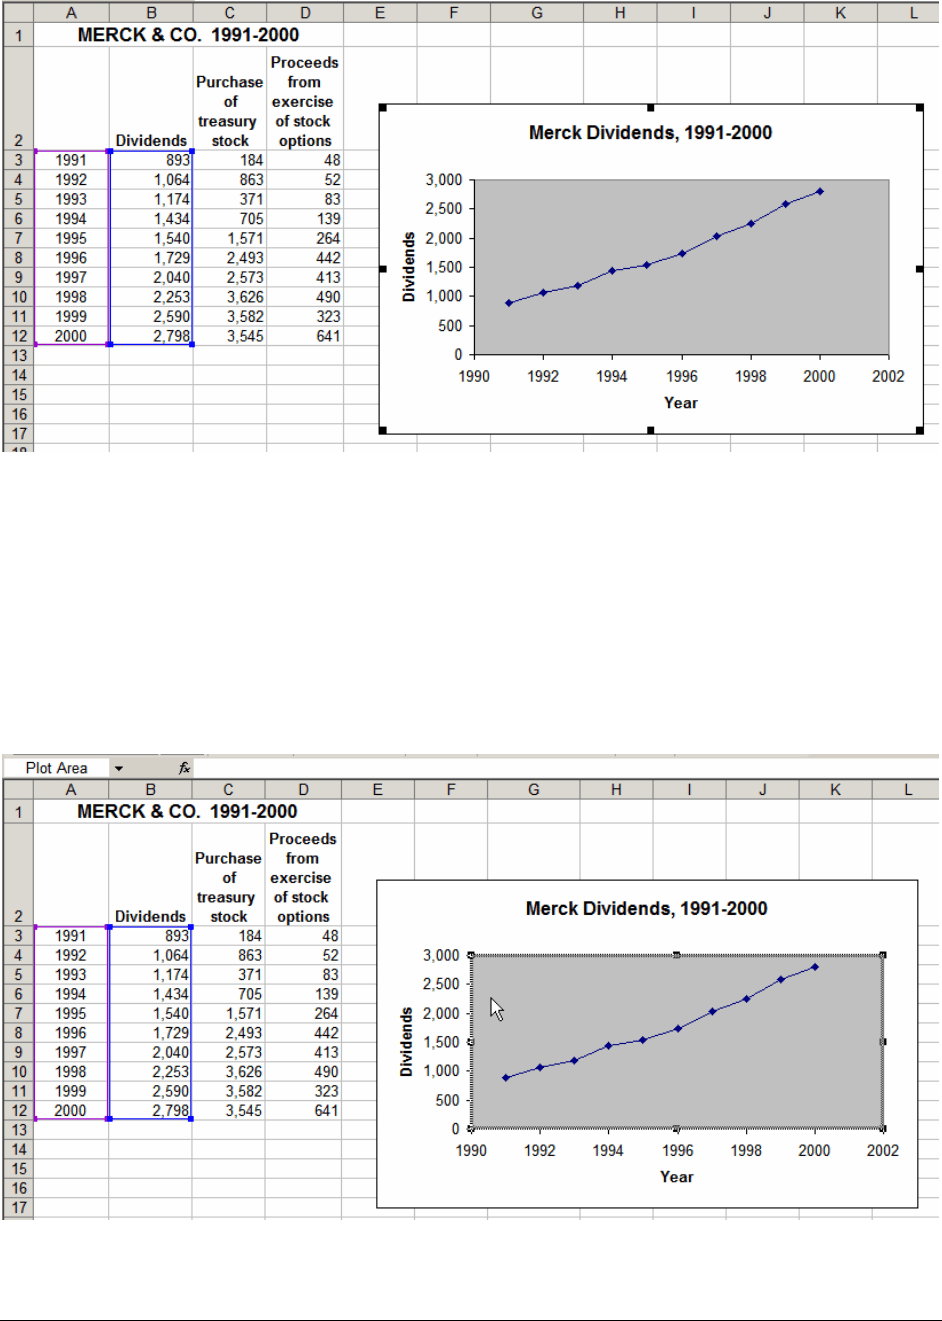
Pressing [Enter] gets you to:
Tell Excel where to put the graph (in this case, on the spreadsheet labeled “Merck data”, which is
also the spreadsheet where our data is stored.
Pushing Finish gives the following graph:
PFE Chapter 28, Charts and graphs in Excel page 8
More changes
Change 1: The Excel default graph has a murky gray area where the data is graphed.
This looks alright on the screen, but it looks terrible when you print it. All the graphs in this
book have this -gray graph area blanked out. To do this, mark the graph area:
Now double-click on the graph area; this brings up the following box:
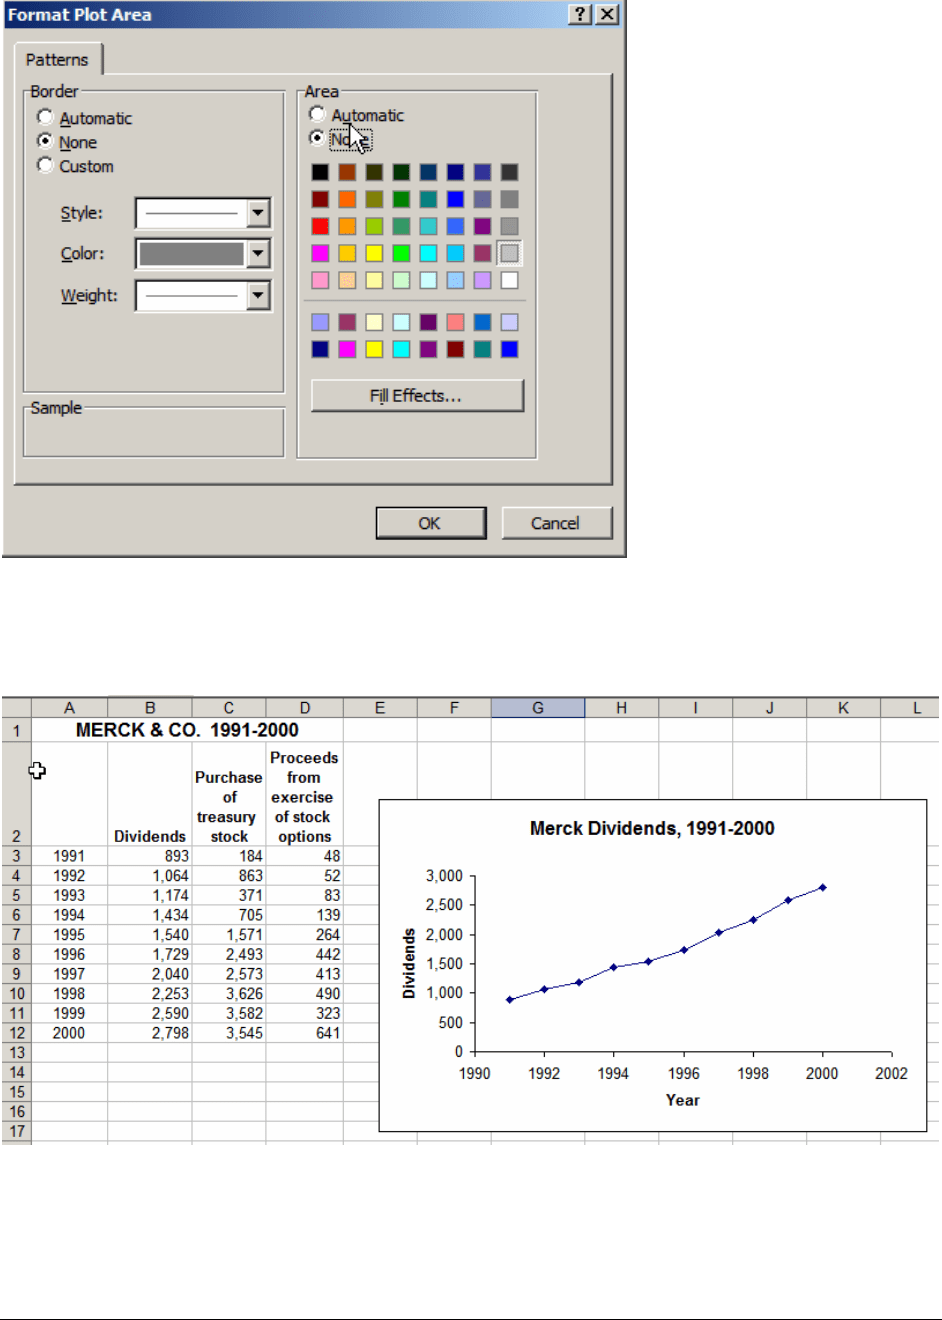
PFE Chapter 28, Charts and graphs in Excel page 9
In the Format Plot Area box above, we always mark Border—None and Area—None.
Here’s the result:
PFE Chapter 28, Charts and graphs in Excel page 10
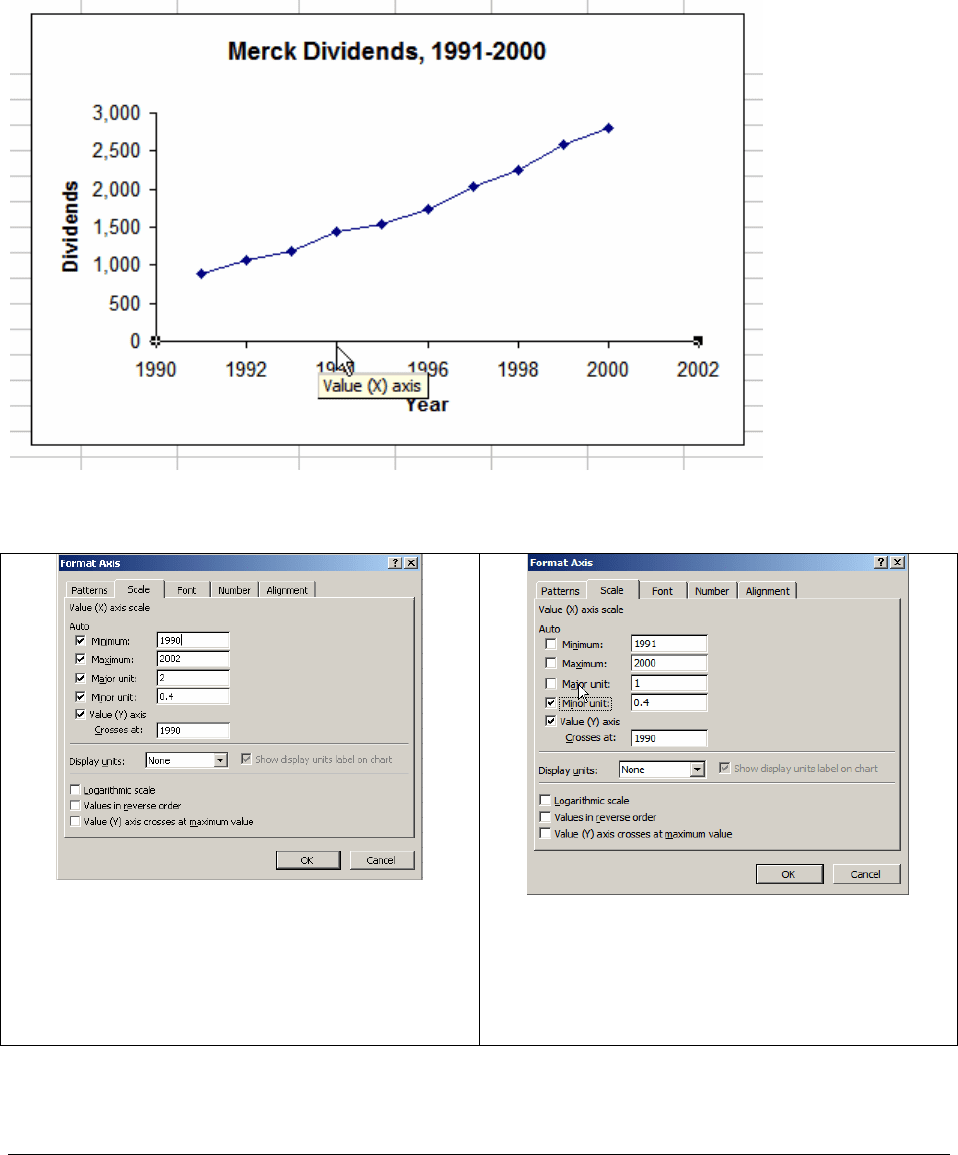
One more change
Although our data only goes from 1991 – 2000, the x-axis on our chart goes from 1990 to
2002. To change this, mark the x-axis of the graph with a gentle click on the left mouse button:
(Notice the square marks at either end of the x-axis.) Now right-click with the mouse and
Before: A checked box indicates the Excel
defaults. At this point the chart is set to show
every other year on the x-axis (Major unit =
2). Minor unit indicates the number of ticks
between the major units (not relevant here).
After. Note that we’ve changed both the
Minimum and the Maximum, as well as the
Major Unit.
Here’s the result:
PFE Chapter 28, Charts and graphs in Excel page 11
Merck Dividends, 1991-2000
0
500
1,000
1,500
2,000
2,500
3,000
1991 1992 1993 1994 1995 1996 1997 1998 1999 2000
Year
Dividends
28.2. Creative use of legends
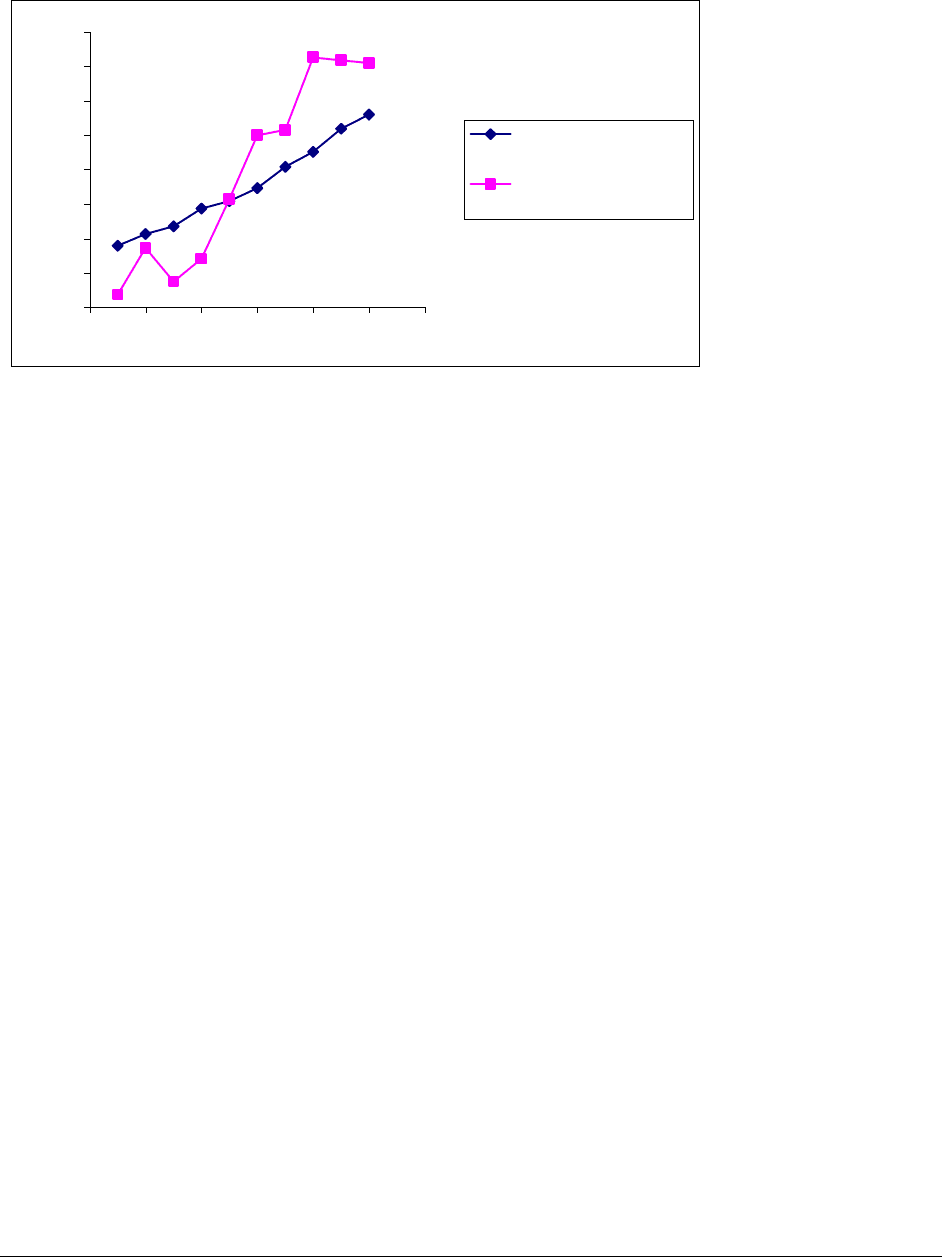
If you build your XY chart with data that includes legends, then Excel will generally
transfer them in the proper way to the graph. Here’s an example: We’ve marked the data to
include the column headings:
PFE Chapter 28, Charts and graphs in Excel page 12
Here’s the resulting graph:
0
500
1,000
1,500
2,000
2,500
3,000
3,500
4,000
1990 1992 1994 1996 1998 2000 2002
Dividends
Purchase of treasury
stock
28.3. Graphing non-contiguous data
Suppose you want to make a graph of columns A, C and D of the Merck data. To mark
these three columns:
• Mark the first column (that is, press the left mouse button and “paint” cells A3:A12)
• Press the [Ctrl] key and mark columns C and D (again, pressing the left mouse button).
At this point your spreadsheet looks like this: