Salby M.L. Fundamentals of Atmospheric Physics
Подождите немного. Документ загружается.

20
I A Global View
.{ ~/'" ".:~,-.--~-." 7 ...... 7.11 ....................... "
:'z. .,"~"%~..-..,- . .., .. [...~.~.~. ....... ....j
.~--(b) 5OO rob: Jan-Mar, 1984
,:.-~
,.~ ,,..~.'.~ ,..
:,
"--.;
"-..
-" % :-"
../% ..... --'"
9 ..~. - . .....
.....,"\ . "-,
2'.-, ,_/ <_.....-.,.<2/ "' ...a .,' -. v-, "-, /
9 " .."
.
,.,,.~>,.~,_~._ ...'-" .... , ..... 9 .....
, , , --~.. e.. ,.. , ,-.. .~ ........... 2:.,. ............. " ..:
- I ~
"" \-''-
. ~.8 72
,,
t 9 : \
:
I
U
,
.i 5 ,
~' ..3
H g
t
5860)/I:..:
! 7--.. .... -
........
I
J
~ :"
.. *** _ .......
9 .o ..-" ......... --
9 e
....
I"
: d
\
\,
%%
%,%
%
40 m/s
.........................
-.....
'"-.-.-\.-~7 ----=." "
9 . r ....... . ,,,, .,.%;
....... "-._ ~"H~ .-.~::.'- .......... ""'" ............ )../~ ....
~b.6.4,.-..../"
:- ..--""
:. .o"~
.-:: ,,o,,~176
~ oo~176176
...... ~'~176176
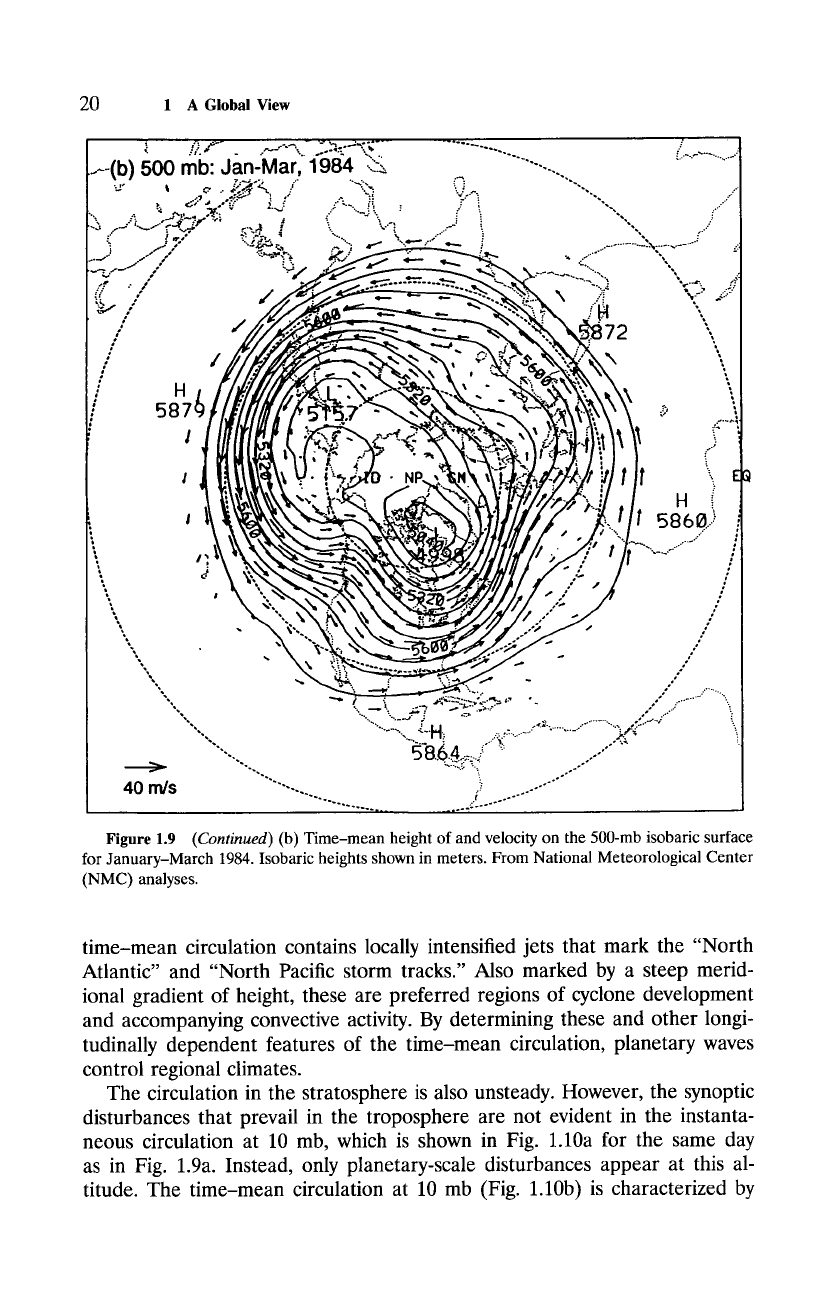
Figure 1.9
(Continued)
(b) Time-mean height of and velocity on the 500-mb isobaric surface
for January-March 1984. Isobaric heights shown in meters. From National Meteorological Center
(NMC) analyses.
time-mean circulation contains locally intensified jets that mark the "North
Atlantic" and "North Pacific storm tracks." Also marked by a steep merid-
ional gradient of height, these are preferred regions of cyclone development
and accompanying convective activity. By determining these and other longi-
tudinally dependent features of the time-mean circulation, planetary waves
control regional climates.
The circulation in the stratosphere is also unsteady. However, the synoptic
disturbances that prevail in the troposphere are not evident in the instanta-
neous circulation at 10 mb, which is shown in Fig. 1.10a for the same day
as in Fig. 1.9a. Instead, only planetary-scale disturbances appear at this al-
titude. The time-mean circulation at 10 mb (Fig. 1.10b) is characterized by

1.2 Composition and Structure 21
........
(a) Omb: Mar , 4
9 .........
...---~ .,, .:.".:::" " ".,.!..."'-~ ",,
9 ".-:
.... ,-.- _~..:" ~; :.j ,.
""-44
_/ ........... j~.... +
"" "'~" ..... :2:-'""+ ..... .-, l . ...........
~. i;~-~.i..+..'~ '~...?f-,:,~+801~, ~... ~---." .................. +'.,,,, .................. .-:
:. i
.:.-
. :;.
..-- .... ...
.~/'
. : !:.-'+ .____-J_ i
9 " d ]
I
l +l
: Z
i
30,7,,,
lg,l-,
+ /1
9 ... ....:"
\
\
\
\,
:'""'""-- r-''""
9
,"
s S
]o
]
]
s;
........... :" ...... "
: --
9
..
63 m/s
H
313875
.... ...+
...... ~..-, "....
~. " ........ . ," +,... :"
......~ ..~r.~.;..... ..... . ..... "'".: ~' "-i .....
- -.
,
: ~176
[" ~176176
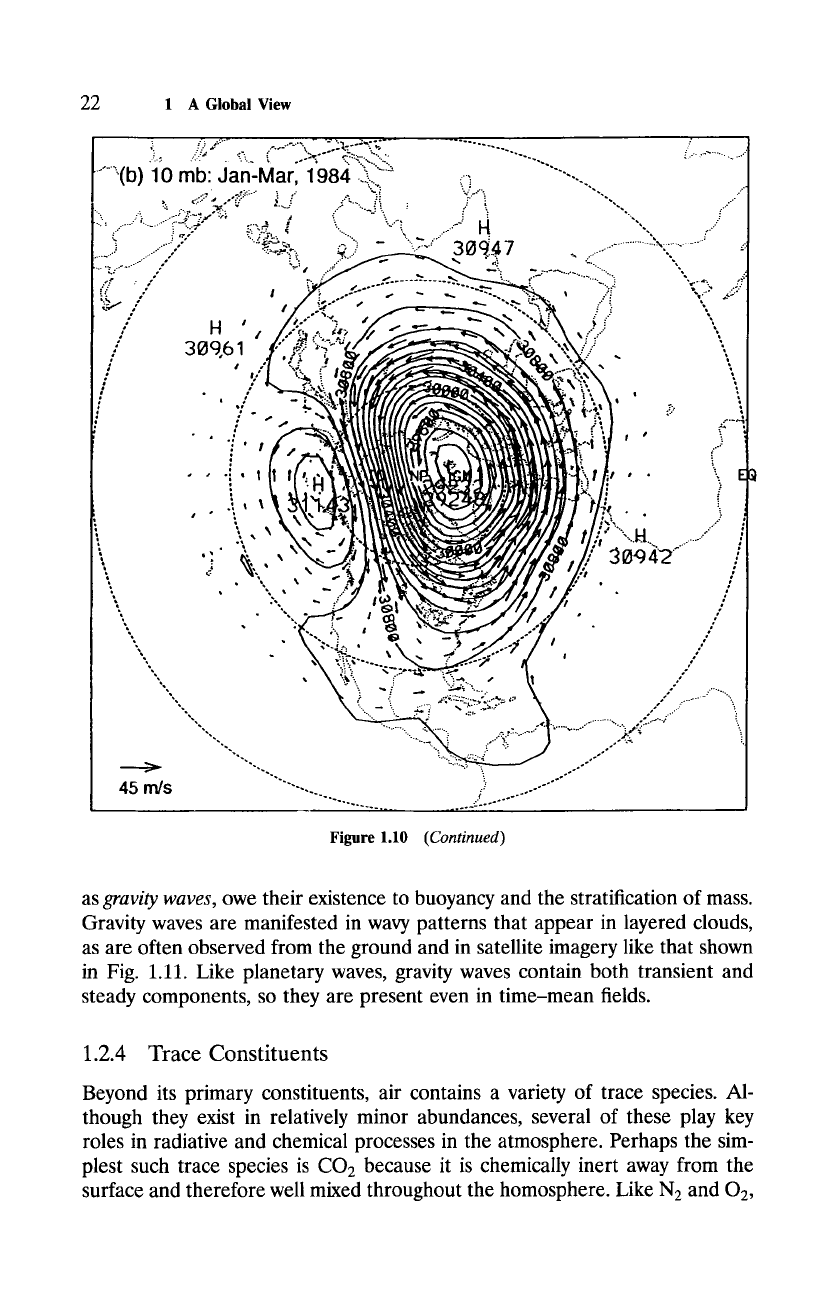
Figure 1.10 As in Fig. 1.9, but for the 10-mb isobaric surface.
(continues)
strong westerly flow that corresponds to the polar-night jet in Fig. 1.8 and to a
circumpolar vortex. Like motion at 500 mb, the time-mean circulation is dis-
turbed from zonal symmetry by steady planetary waves that are not eliminated
by averaging over time. The instantaneous circulation in Fig. 1.10a is much
more disturbed than the time-mean circulation. Counterclockwise motion as-
sociated with the polar-night vortex has been displaced well off the pole and
highly distorted by a clockwise circulation that has amplified and temporarily
invaded the polar cap. This anomalous feature deflects the air stream through
large excursions in latitude, which transport air from one radiative environ-
ment to another.
In addition to the large-scale features described, the circulation is also
disturbed on smaller dimensions that are not resolved in the global analyses
shown in Figs. 1.9 and 1.10. These small-scale disturbances, which are known
22
1 A Global View
...... "(b)
1"0
m b:Ja'n-i~lar:";'984 ~i;: Z:~ c- ............... " ......
,
'".. i~. ..... >7.":. ,,"~>;~ j ":. "-'.. ,, ~ "
".,, ,.-"
.... ,,.:
..............
i7"> §
:'~., t
' ..... "'., ......
"
H "... ;.
"-. ...-: ;" "-.zE,-:C,.- "": - -" .-'"
"_4-
. ............... :.,, ................ ..
....... : .......... ,-" "~-.,~'..-, ~.,, .........
30q.. 7
............
,," "
9
....
,,-
. .:
..,. ,~
9 ~
.:... ",
.... "'7,-" .... ," '"" # ..:" ---". -- ..-.----. .... "".-. ", .
../,
l
/
I
i
/
I
%
I
%
a #
309.61
#
/3
%
f
::"
<"/
.
9 ,
,,"
...'(
o
" " ":' I
I
.'1 I
9 9
o
"\
')
9 %
""
t
f,
",
,L
. \
s
e...
" " _ .-~~'v'<"~S""r
. ,~ .~b.'A '~
,i .....
-,,
~- "x-... ,
", c -': ~'-~.:'-'-'." --,. ,,'~ .- ',,=.
,-~
"%
. 9
..-:.
%. . ,-. .... -
% "
........ ..
,.. .... ,....-..~[-'" ...
%, ""--.....
. .
45 m/s
.....................
tl
ql
u 9
!
#
! 9
! e 9
o
!r .
J , -"S,.
OS 0
. .,,-"
:.. ,.,,-"
{
...---'"
%
%
%
q
:....--"
'd
..e.
"4"2""'" ...... :
l
/
/
o,
l
,
l
.. ......
/" .......... -
z
o, ...--: ?
'....----i -
Figure 1.10
(Continued)
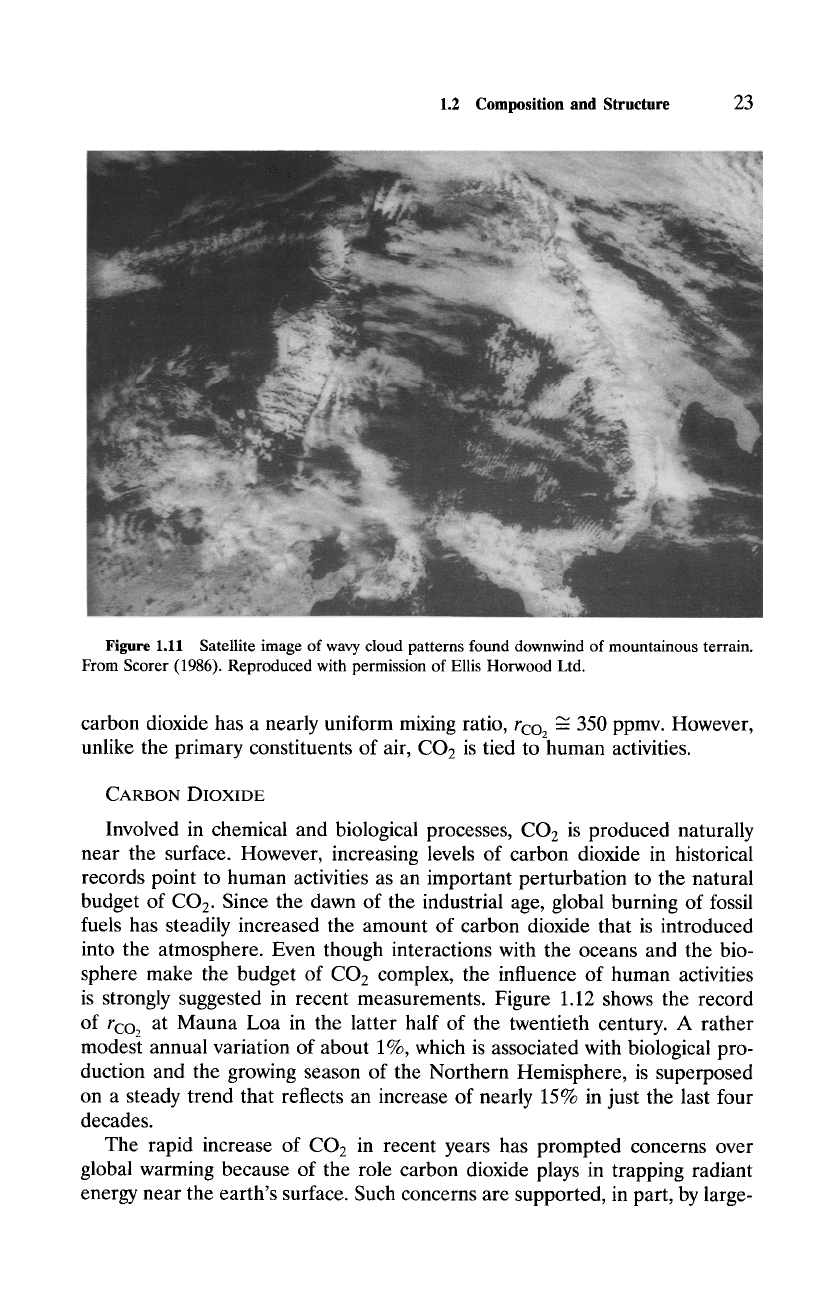
as
gravity waves,
owe their existence to buoyancy and the stratification of mass.
Gravity waves are manifested in wavy patterns that appear in layered clouds,
as are often observed from the ground and in satellite imagery like that shown
in Fig. 1.11. Like planetary waves, gravity waves contain both transient and
steady components, so they are present even in time-mean fields.
1.2.4 Trace Constituents
Beyond its primary constituents, air contains a variety of trace species. Al-
though they exist in relatively minor abundances, several of these play key
roles in radiative and chemical processes in the atmosphere. Perhaps the sim-
plest such trace species is CO2 because it is chemically inert away from the
surface and therefore well mixed throughout the homosphere. Like N2 and 02,
1.2 Composition and Structure
23
Figure 1.11 Satellite image of wavy cloud patterns found downwind of mountainous terrain.
From Scorer (1986). Reproduced with permission of Ellis Horwood Ltd.
carbon dioxide has a nearly uniform mixing ratio, rco 2 ~ 350 ppmv. However,
unlike the primary constituents of air, CO2 is tied to human activities.
CARBON DIOXIDE
Involved in chemical and biological processes, CO2 is produced naturally
near the surface. However, increasing levels of carbon dioxide in historical
records point to human activities as an important perturbation to the natural
budget of CO2. Since the dawn of the industrial age, global burning of fossil
fuels has steadily increased the amount of carbon dioxide that is introduced
into the atmosphere. Even though interactions with the oceans and the bio-
sphere make the budget of CO2 complex, the influence of human activities
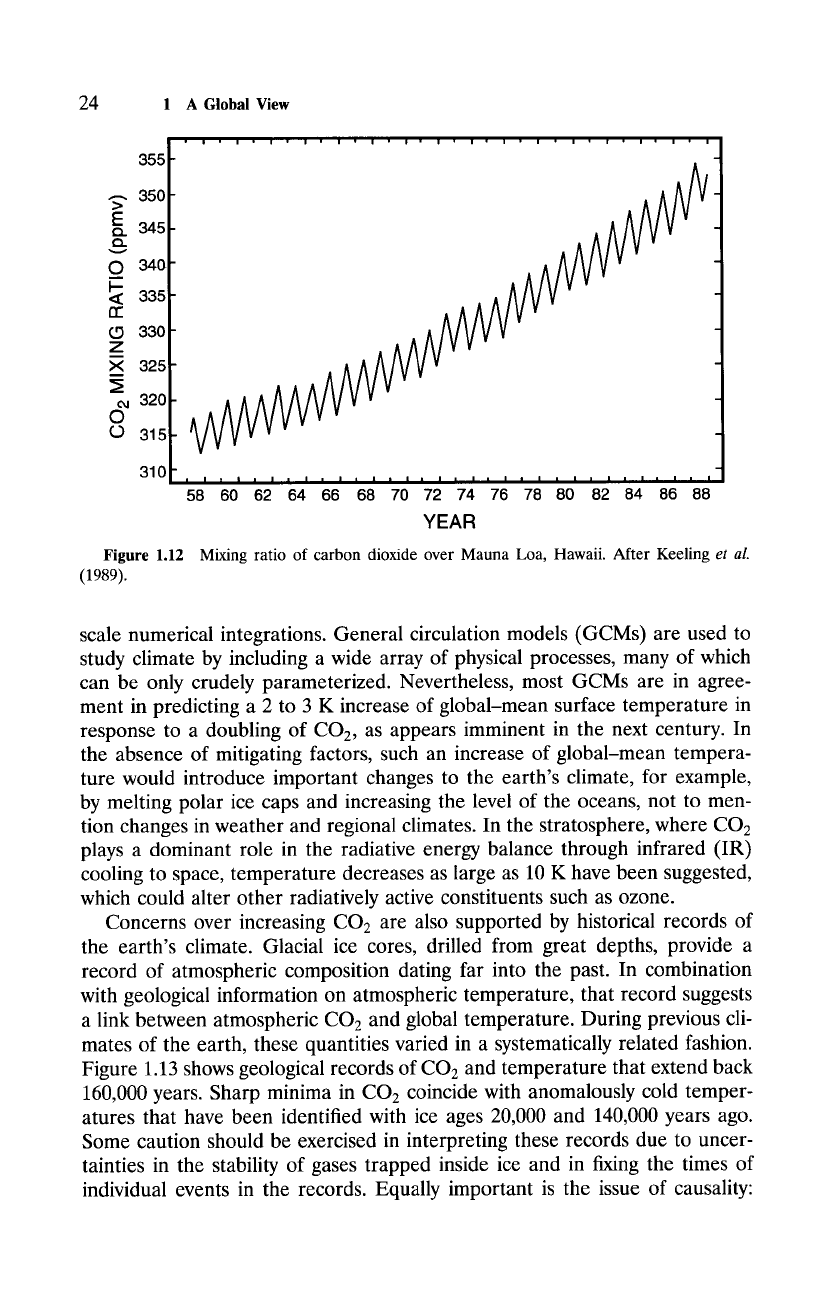
is strongly suggested in recent measurements. Figure 1.12 shows the record
of rco 2 at Mauna Loa in the latter half of the twentieth century. A rather
modest annual variation of about 1%, which is associated with biological pro-
duction and the growing season of the Northern Hemisphere, is superposed
on a steady trend that reflects an increase of nearly 15% in just the last four
decades.
The rapid increase of CO2 in recent years has prompted concerns over
global warming because of the role carbon dioxide plays in trapping radiant
energy near the earth's surface. Such concerns are supported, in part, by large-
24
1 A Global View
355
~, 350-
>
E
c}.. 345-
(D..
0 340-
I--
< 335-
n"
330-
Z
X 325-
oj 320
0
0 315
310
Figure 1.12
(1989).
9 i | i | i | l ! i ! a | i | i | I ! i ! i ! i | i | i | i | l
I I l I l I I I I I I I . I . i . I . I . l . I . I . a . I . I
58 60 62 64 66 68 70 72 74 76 78 80 82 84 86 88
YEAR
Mixing ratio of carbon dioxide over Mauna Loa, Hawaii. After Keeling et aL
scale numerical integrations. General circulation models (GCMs) are used to
study climate by including a wide array of physical processes, many of which
can be only crudely parameterized. Nevertheless, most GCMs are in agree-
ment in predicting a 2 to 3 K increase of global-mean surface temperature in
response to a doubling of CO2, as appears imminent in the next century. In
the absence of mitigating factors, such an increase of global-mean tempera-
ture would introduce important changes to the earth's climate, for example,
by melting polar ice caps and increasing the level of the oceans, not to men-
tion changes in weather and regional climates. In the stratosphere, where CO2
plays a dominant role in the radiative energy balance through infrared (IR)
cooling to space, temperature decreases as large as 10 K have been suggested,
which could alter other radiatively active constituents such as ozone.
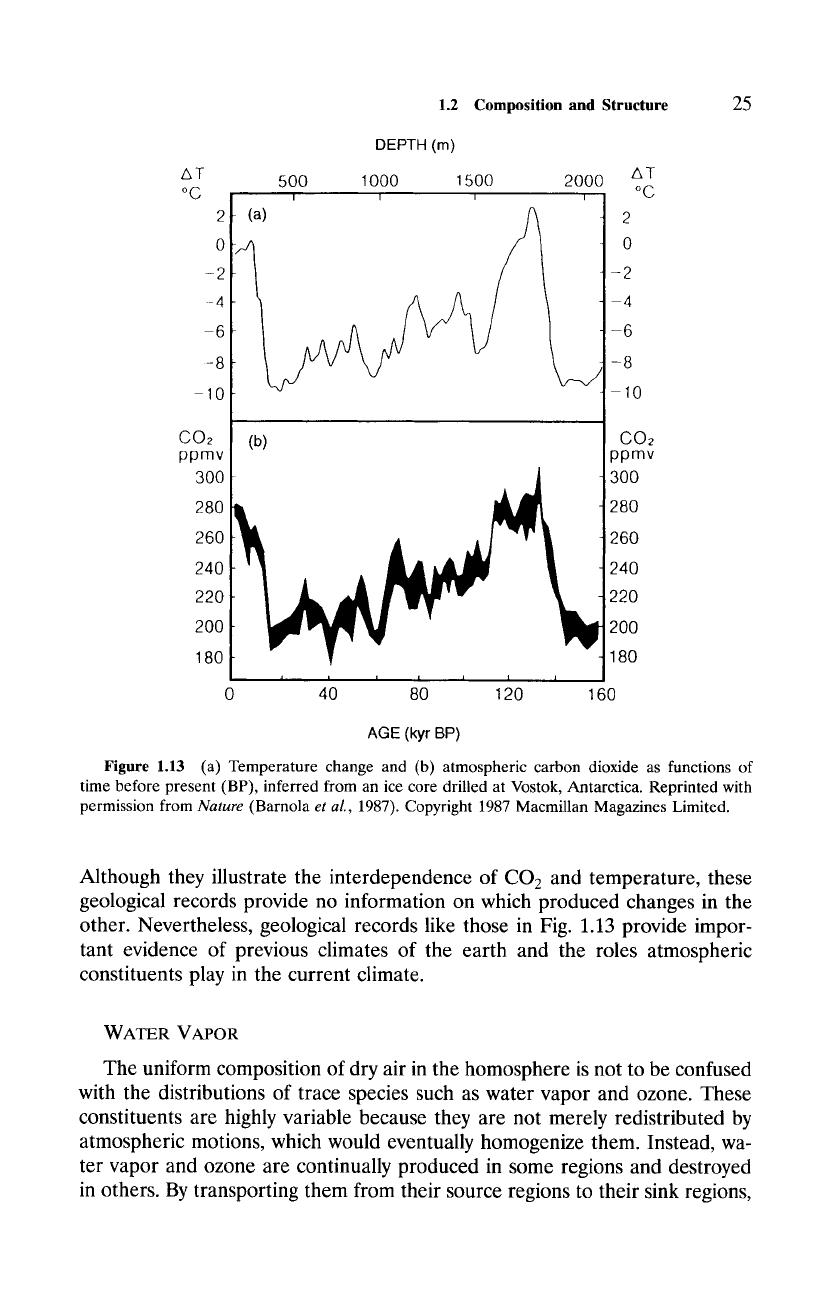
Concerns over increasing CO2 are also supported by historical records of
the earth's climate. Glacial ice cores, drilled from great depths, provide a
record of atmospheric composition dating far into the past. In combination
with geological information on atmospheric temperature, that record suggests
a link between atmospheric CO2 and global temperature. During previous cli-
mates of the earth, these quantities varied in a systematically related fashion.
Figure 1.13 shows geological records of CO2 and temperature that extend back
160,000 years. Sharp minima in CO2 coincide with anomalously cold temper-
atures that have been identified with ice ages 20,000 and 140,000 years ago.
Some caution should be exercised in interpreting these records due to uncer-
tainties in the stability of gases trapped inside ice and in fi~ng the times of
individual events in the records. Equally important is the issue of causality:
DEPTH (m)
AT
o C
2
0
-2
-4
-6
---8
-10
CO2
ppmv
300
280
260
240
220
200
180
500 1000 1500 2000
I I I I
1.2 Composition and Structure 25
(b)
0 40 80 120
AT
o C
2
0
-2
-4
-6
-8
-10
CO~
ppmv
30O
280
26O
240
220
J
200
-
180
160
AGE (kyr BP)
Figure 1.13 (a) Temperature change and (b) atmospheric carbon dioxide as functions of
time before present (BP), inferred from an ice core drilled at Vostok, Antarctica. Reprinted with
permission from
Nature
(Barnola
et aL,
1987). Copyright 1987 Macmillan Magazines Limited.
Although they illustrate the interdependence of CO2 and temperature, these
geological records provide no information on which produced changes in the
other. Nevertheless, geological records like those in Fig. 1.13 provide impor-
tant evidence of previous climates of the earth and the roles atmospheric
constituents play in the current climate.
WATER VAPOR
The uniform composition of dry air in the homosphere is not to be confused
with the distributions of trace species such as water vapor and ozone. These
constituents are highly variable because they are not merely redistributed by
atmospheric motions, which would eventually homogenize them. Instead, wa-
ter vapor and ozone are continually produced in some regions and destroyed
in others. By transporting them from their source regions to their sink regions,

26
1 A Global
View
the circulation exerts an important influence on these species and makes their
distributions dynamic.
Owing to its involvement in radiative processes, cloud formation, and in
exchanges of energy with the oceans, water vapor is the single most important
trace species in the atmosphere. The zonal-mean distribution of water vapor
is shown in Fig. 1.14 as a function of latitude and altitude. Water vapor is
confined almost exclusively to the troposphere. Its zonal-mean mixing ratio
?I~2O decreases steadily with altitude, from a maximum of about 20 g kg -1
at the surface in the tropics to a minimum of a few parts per million at the
tropopause. The absolute concentration of water vapor, or
absolute humidity,
Piano (shaded area) decreases with altitude even more rapidly. From (1.14),
the density of the ith constituent is just its mixing ratio times the density of
dry air
Pi -- riPd.
(1.24)
Because
Pd
decreases exponentially with altitude, water vapor tends to be con-
centrated in the lowest 2 km of the atmosphere. The zonal-mean mixing ratio
also decreases with latitude, falling to under 5 g kg -1 poleward of 60 ~ These
characteristics of water vapor reflect its production at the earth's surface, re-
distribution by the atmospheric circulation, and destruction at altitude and at
middle and high latitudes through condensation and precipitation.
Owing to those production and destruction mechanisms and the rapid trans-
port of air between source and sink regions, tropospheric water vapor is short
Water Vapor (g kg "1)
' I ' ' I ' ' I ' ' I ' ' I '
200 -
s ,..~ .....- ~ J .....~ .~
uJ 400 - 1 -- .. -- .. ........ " -- -- .. .. " -- -- -- ...... _
co 600 1
i / / .4
-80 ~ ~ -60 ~ .50 ~ .40 ~ .30~ ~ -10 ~ 0 ~ 10 ~ 20 ~ 30 ~ 40 ~ 50 ~ 60 ~ 70 ~ 80 ~
LATITUDE
Figure 1.14 Zonal-mean mixing ratio of water vapor (contoured) and density of water vapor
or absolute humidity (shaded), as functions of latitude and pressure. The shaded levels correspond
to 20, 40, and 60% of the maximum value.
Source: Oort and Peixoto (1983).
1.2 Composition and Structure 27
lived. A characteristic lifetime, which may be defined as the time for rn2 o in-
side an individual parcel to change significantly, is of order days. Every few
days, an air parcel encounters a warm ocean surface, where it absorbs mois-
ture through evaporation, or a region of cloudiness, where it loses water vapor
through condensation and precipitation.
Most of the water vapor in Fig. 1.14 originates near the equator at warm
ocean surfaces. Consequently, transport by the circulation plays a key role
in determining the mean distribution ~H20- Vertical and horizontal transport,
which are referred to as
convection
and
advection,
respectively, each contributes
to the redistribution of rH2 o. Introduced at the surface of the tropical atmo-
sphere, water vapor is carried aloft by deep convective cells and horizontally
by large-scale eddies that disperse rH20 across the globe in complex fashion.
Some bodies of air escape production and destruction long enough for rH20
to be rearranged as a tracer.
Figure 1.15 presents for the day shown in Fig. 1.9 an image from the
6.3-/zm water vapor channel of the geostationary satellite Meteosat-2, which
observes the earth from above the Greenwich meridian (see Fig. 1.24 for
geographical landmarks). The gray scale in Fig. 1.15 represents cold emis-
sion temperatures (high altitudes) as bright, and warm emission temperatures
(low altitudes) as dark. Since the water vapor column is optically thick at
this wavelength (i.e., outgoing radiation is emitted by H20 at the highest
levels), behavior in Fig. 1.15 corresponds to the top of the moisture layer.
Bright regions indicate moisture at high altitudes and deep convective dis-
placements of surface air, whereas dark regions indicate moisture that remains
close to the earth's surface. Thus, Fig. 1.15 reflects the horizontal distribution
of rile O.
Unlike the mean distribution in Fig. 1.14, which is fairly smooth, the global
distribution of water vapor on an individual day is quite variable. The mois-
ture pattern is granular in the tropics, where water vapor has been displaced
vertically by deep convective cells that have dimensions of tens to a few hun-
dred kilometers. At middle and high latitudes, the pattern is smoother, but
still complex. Swirls of light and dark mark bodies of air that are rich and
lean in water vapor, respectively, for example, air that originated in tropical
and extratropical regions and has been rearranged by the circulation. The lo-
cal abundance reflects the history of the air parcel residing at that location,
namely, where that parcel has been and what processes influencing water vapor
have acted on it. A tongue of water vapor stretches northeastward from deep
convection over the Amazon Basin (see Fig. 1.24), across the Atlantic, and
into Africa, where it joins a tongue of drier air that is being drawn southward
behind a cyclone in the eastern Atlantic (compare Fig. 1.9a). In the Southern
Hemisphere, a band of high moisture is sharply delineated from neighboring
lower moisture along a front that trails behind a cyclone in the South Atlantic.
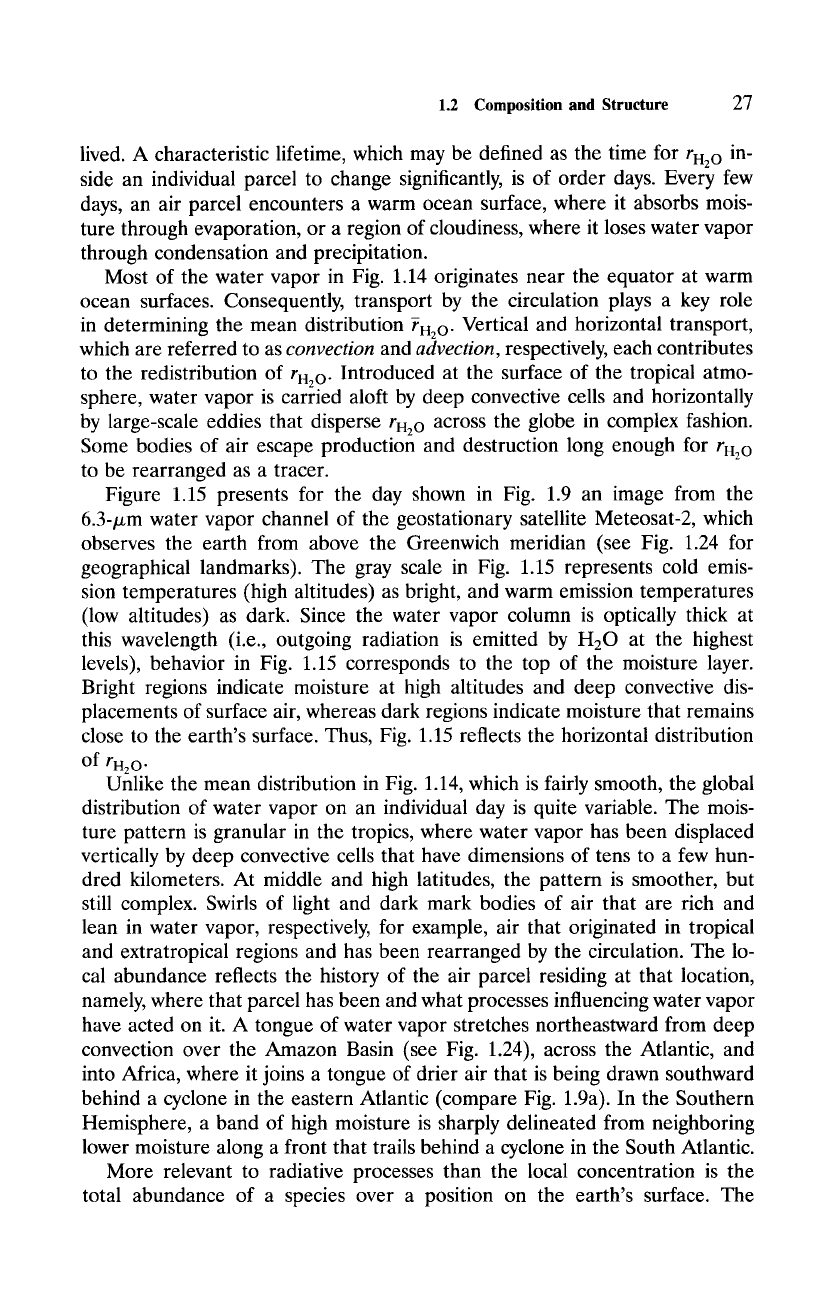
More relevant to radiative processes than the local concentration is the
total abundance of a species over a position on the earth's surface. The

28
1 A Global View
Figure 1.15 Water vapor image on March 4, 1984, from the 6.3-/xm channel of Meteosat-
2, which is in geostationary orbit over the Greenwich meridian. Gray scale displays equivalent
blackbody temperature from warmest (black) to coldest (white). (See Fig. 1.24 for geographical
landmarks.) Supplied by the European Space Agency.
column abundance,
fo ~176
Zi -- pidz
__
1 f ps
ridp~
Jo
g
(1.25)
describes the mass of the ith species contained by an atmospheric column of
unit cross-sectional area. Figure 1.16 displays the distribution of EH~O, which
is referred to as
total precipitable water vapor
and expressed in millimeters of
liquid water, for the day shown in Fig. 1.15. Sharply confined to the tropics,
EH2O resembles the distribution of temperature. Signatures of deep convec-
tion appear in enhanced column abundance (e.g., over tropical Africa, South
America, and the eastern Atlantic), but EH2O is distributed more uniformly
than rH~ o. In part, this feature of the water vapor distribution follows from
90
March 4, 1984
1.2
Composition and Structure
29
60
30
-30
-60
-90
0 60 120 180 240 300 360
0 Y.H20 (mm) 60
Figure
1.16 Global distribution of the column abundance of water vapor, or
total precipitable
water vapor,
on March 4, 1984, derived from the TIROS Operational Vertical Sounder (TOVS).
Data courtesy of I. Wittmeyer and T. Vonderharr (CSU).
the concentration of PH20 in the lowest 2 km. But it also indicates that, at
higher altitudes, even deep convective towers contain comparatively little wa-
ter in vapor phase.
Together, the zonal-mean and horizontal distributions illustrate the pre-
vailing mechanisms controlling atmospheric water vapor. Large values of FH20
at the earth's surface in the tropics reflect production of water vapor through
evaporation of warm tropical oceans. Only inside convective towers and in
analogous features of greater dimension are large mixing ratios found far
above the ground. Even there, vertical transport of H20 is limited by thermo-
dynamic constraints that prevent water vapor from reaching great altitudes,
where it would be photodissociated by energetic solar radiation.
OZONE
Another radiatively active trace gas, ozone plays a key role in supporting
life at the earth's surface. By intercepting harmful UV radiation, ozone allows
life as we know it to exist. In fact, the evolution of the earth's atmosphere
and the formation of the ozone layer are thought to be closely related to the
development of life on Earth.