Saltzman B. (editor) Anomalous Atmospheric Flows and Blocking
Подождите немного. Документ загружается.

344
STEFAN0
TIBALDI
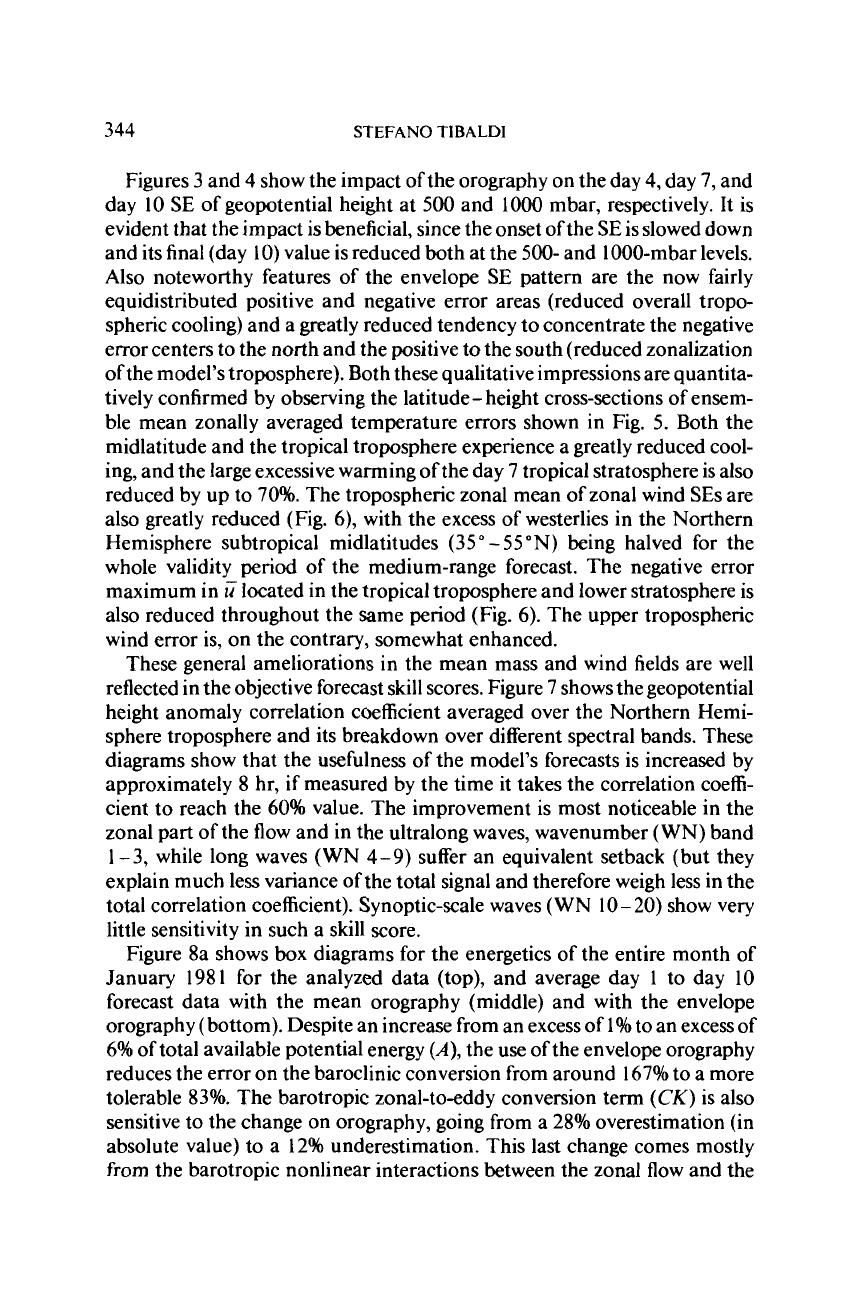
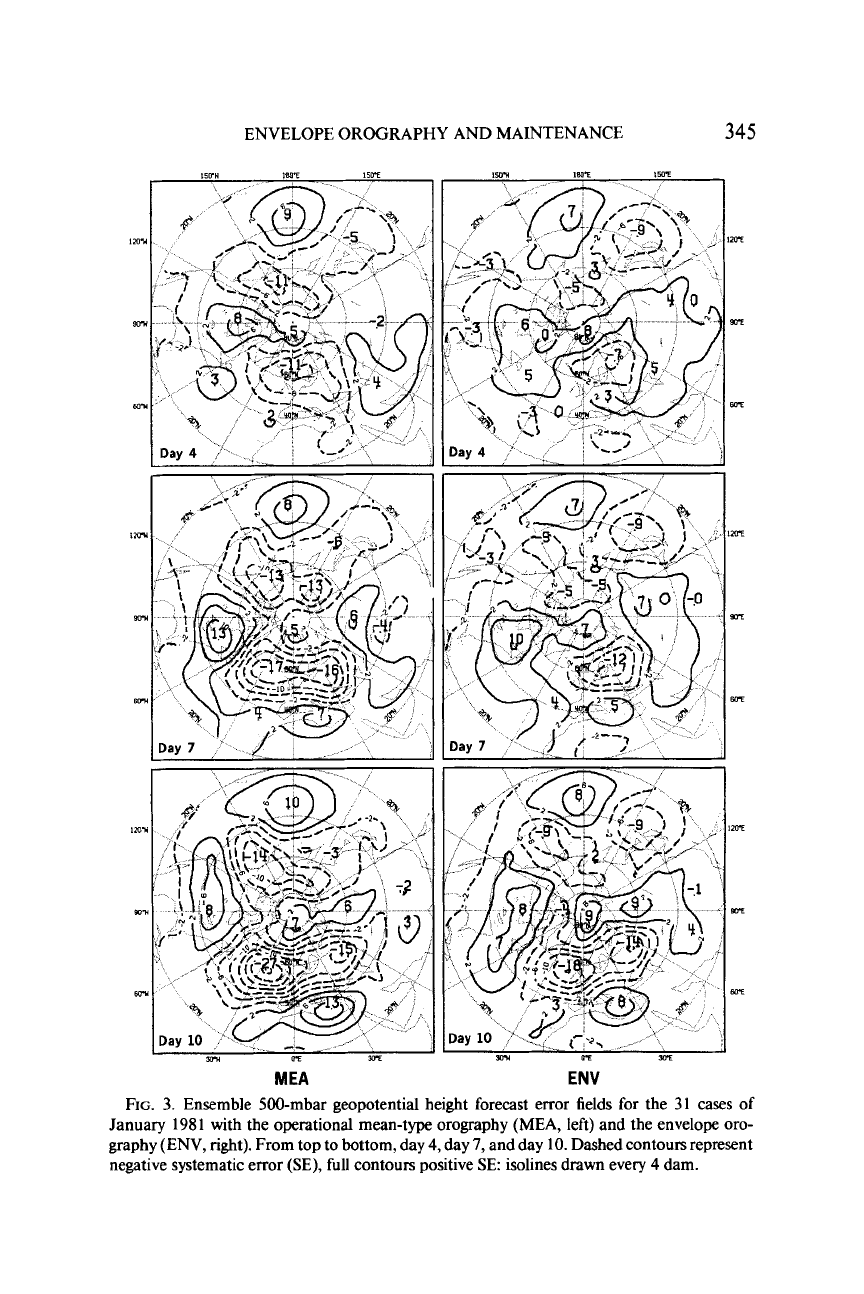
Figures 3 and
4
show the impact
of
the orography on the day
4,
day 7, and
day
10
SE
of geopotential height at
500
and
1000
mbar, respectively. It is
evident that the impact
is
beneficial, since the onset of the
SE
is slowed down
and its final (day
10)
value is reduced both at the
500-
and 1000-mbar levels.
Also noteworthy features of the envelope
SE
pattern are the now fairly
equidistributed positive and negative error areas (reduced overall tropo-
spheric cooling) and a greatly reduced tendency to concentrate the negative
error centers
to
the north and the positive to the south (reduced zonalization
of
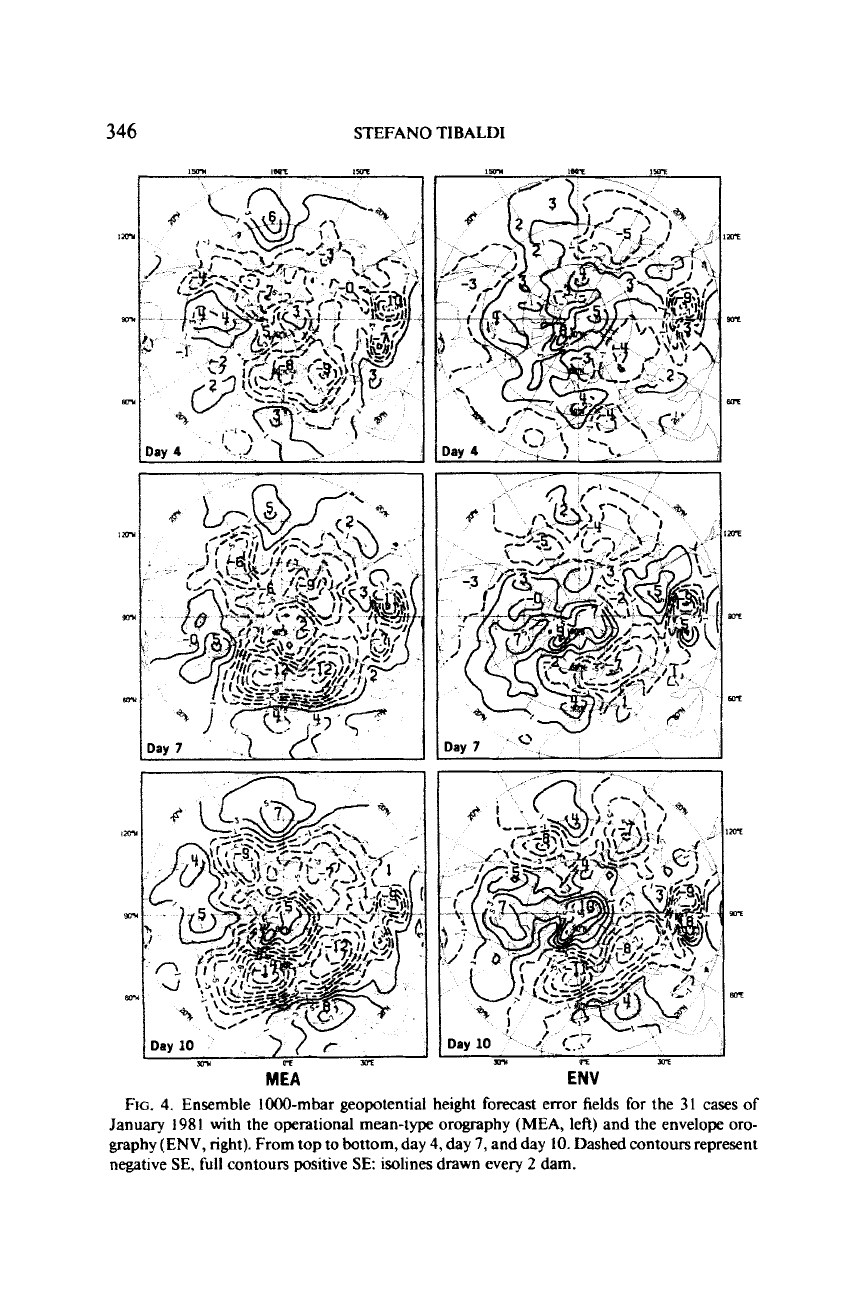
the model's troposphere). Both these qualitative impressions are quantita-
tively confirmed by observing the latitude- height cross-sections of ensem-
ble mean zonally averaged temperature errors shown in Fig.
5.
Both the
midlatitude and the tropical troposphere experience a greatly reduced cool-
ing, and the large excessive warming
of
the day
7
tropical stratosphere is also
reduced by up to
70%.
The tropospheric zonal mean of zonal wind
SEs
are
also greatly reduced (Fig. 6), with the excess of westerlies in the Northern
Hemisphere subtropical midlatitudes (35"
-
55"N) being halved for the
whole validity
period
of the medium-range forecast. The negative error
maximum in
U
located in the tropical troposphere and lower stratosphere is
also reduced throughout the same period (Fig. 6). The upper tropospheric
wind error is, on the contrary, somewhat enhanced.
These general ameliorations in the mean mass and wind fields are well
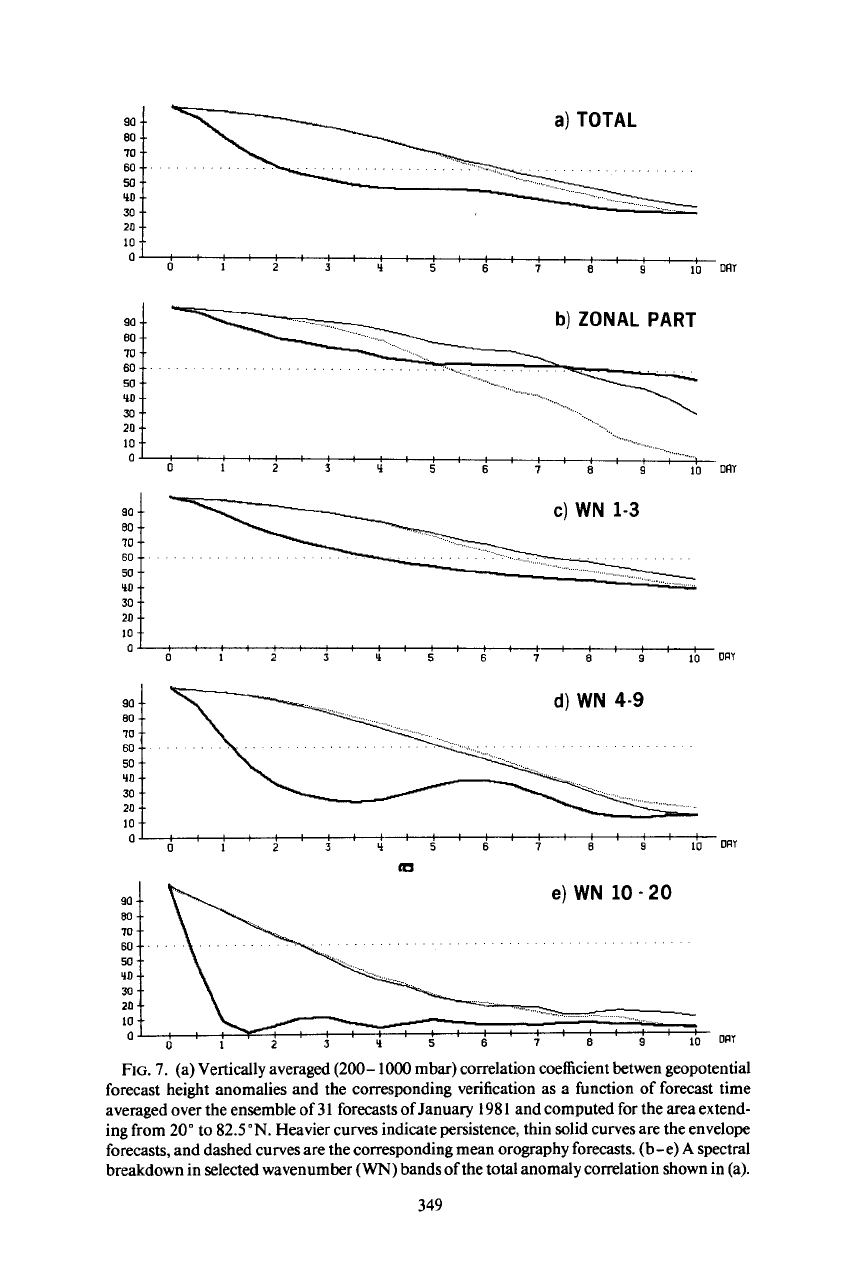
reflected in the objective forecast skill scores. Figure 7 shows the geopotential
height anomaly correlation coefficient averaged over the Northern Hemi-
sphere troposphere and its breakdown over different spectral bands. These
diagrams show that the usefulness of the model's forecasts is increased by
approximately
8
hr, if measured
by
the time it takes the correlation coeffi-
cient to reach the
60%
value. The improvement is most noticeable in the
zonal part of the flow and in the ultralong waves, wavenumber (WN) band
1
-
3, while long waves (WN
4
-
9)
suffer an equivalent setback (but they
explain much less variance
of
the total signal and therefore weigh less in the
total correlation coefficient). Synoptic-scale waves
(
WN
I0
-
20)
show very
little sensitivity in such a skill score.
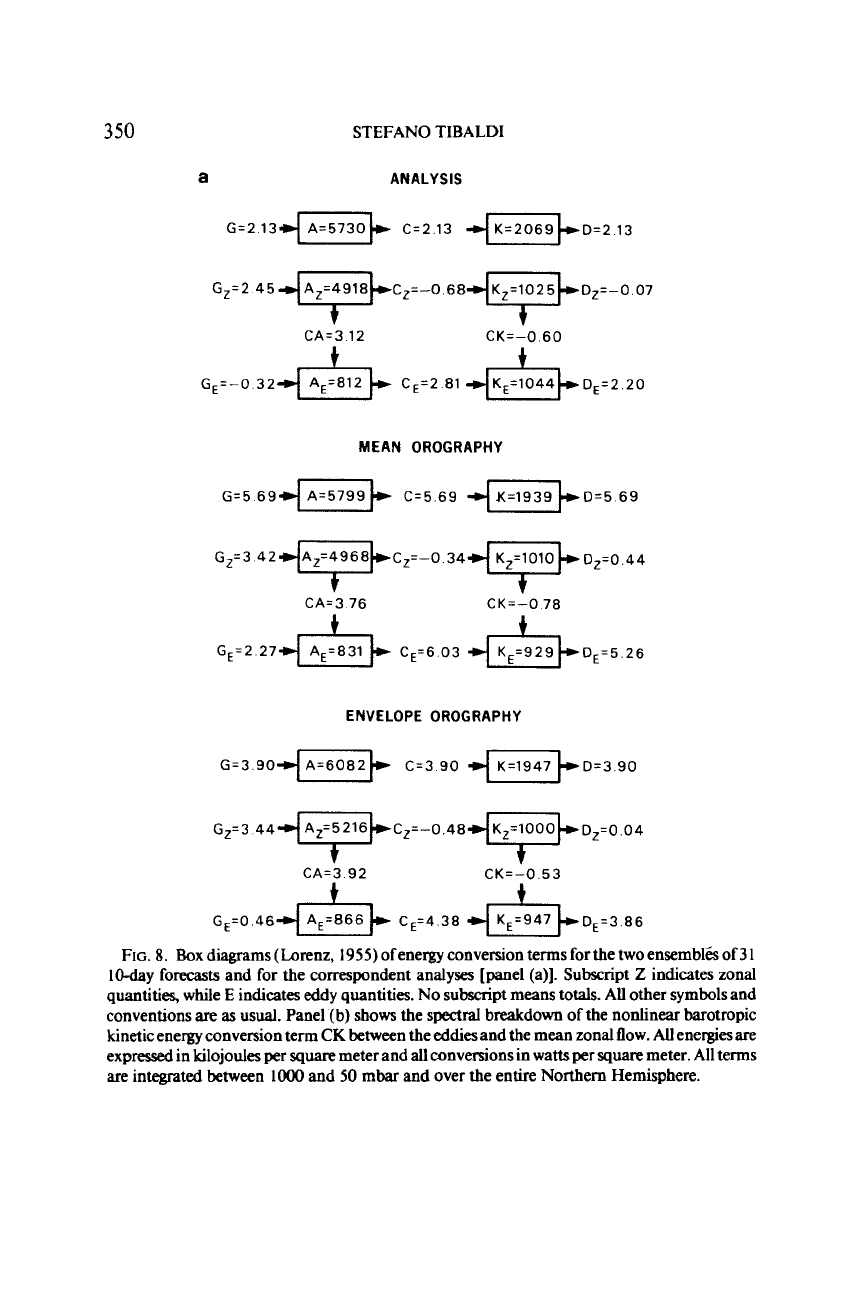
Figure 8a shows
box
diagrams for the energetics
of
the entire month of
January 1981 for the analyzed data (top), and average day
1
to day
10
forecast data with the mean orography (middle) and with the envelope
orography (bottom). Despite an increase from an excess of
1
%to an excess of
6%
of total available potential energy
(A),
the use of the envelope orography
reduces the error on the baroclinic conversion from around 167% to a more
tolerable 83%. The barotropic zonal-to-eddy conversion term
(CK)
is also
sensitive to the change on orography, going from a 28% overestimation (in
absolute value) to a
12%
underestimation. This last change comes mostly
from the barotropic nonlinear interactions between the zonal flow and the
ENVELOPE OROGRAPHY AND MAINTENANCE
345
MEA
S0.y
0.E
JOT
ENV
FIG.
3.
Ensemble 500-mbar geopotential height forecast error fields for the
31
cases
of
January
1981
with the operational mean-type orography (MEA, left) and the envelope
oro-
graphy (ENV,
right).
From top to bottom, day
4,
day
7,
and day
10.
Dashed contours represent
negative systematic error (SE), full contours positive SE: isolines drawn every
4
dam.
346
STEFAN0 TIBALDI
MEA
ENV
FIG.
4.
Ensemble
1000-mbar
geopotential height
forecast
error fields
for
the
31
cases of
January
1981
with the operational mean-type orography (MEA, left) and the envelope
oro-
graphy (ENV, right). From top to bottom, day
4,
day
7,
and day
10.
Dashed contours represent
negative SE, full contours positive
SE
isolines
drawn
every
2
dam.
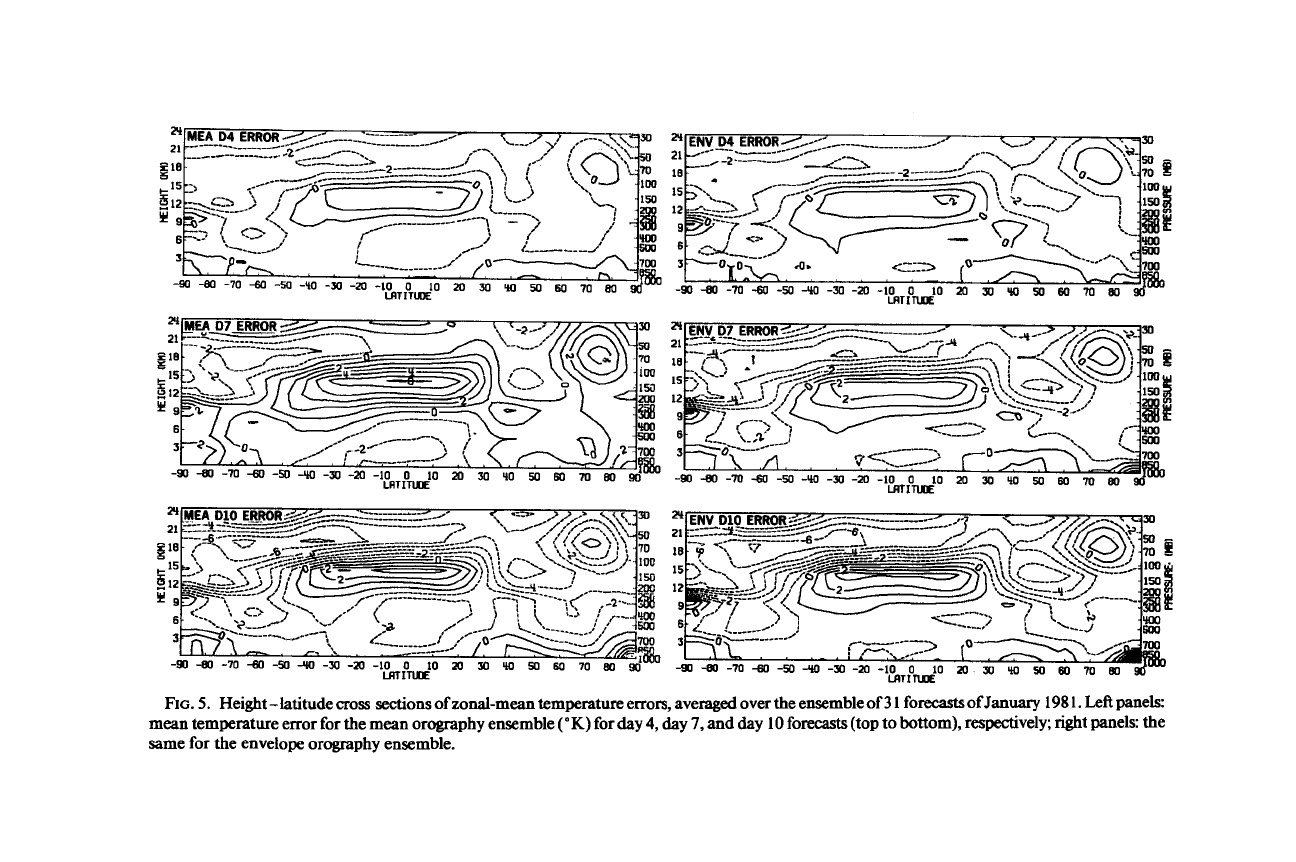
FIG.
5.
Height
-
latitude
cross
sections
of zonal-mean temperature errors, averaged over the ensemble of
3
1
forecasts
of
January
198
1.
Left
panels:
mean temperature error for the mean orography ensemble
(OK)
for day
4,
day
7,
and day 10 forecasts (top
to
bottom), respectively; right Panels: the
same for the envelope orography ensemble.

348
FIG.
6.
Height -latitude cross sections ofzonal mean
of
zonal wind errors, averaged over the ensemble of
3
1
forecasts
of
January
198
1.
Lett
panels:
mean zonal wind error for the mean orography ensemble (meters
per
second) for the day
4,
day
7,
and day
10
forecasts (top to bottom), respectively;
right panels: the same for the envelope orography ensemble.
30
b)
ZONAL
PART
60
50
30
0
....................
1
'...
.........,.
,
..
...
"
........,
20
10
I
5
6
7
8
9
I0
my
C)
WN
1-3
60
50
-
$0
80
-.
70
60
..
50
.-
30
I0
..
In
..
zn
--
I-
--
oJ
:
:
::
::
::
: :
::
:;
::
::
::
5
m
e)
WN
10
-
20
FIG.
7.
(a) Vertically averaged (200-
1000
mbar) correlation coefficient betwen geopotential
forecast height anomalies and the corresponding verification as a function of forecast time
averaged over the ensemble of
3
I
forecasts of January
198
1
and computed for the area extend-
ing from
20" to 82.5"N. Heavier curves indicate persistence, thin solid curves are the envelope
forecasts, and dashed curves are the corresponding mean orography forecasts. (b-e)
A
spectral
breakdown
in
selected wavenumber
(WN)
bands ofthe total anomaly correlation shown
in
(a).
349
3
50
STEFAN0 TIBALDI
a
ANALYSIS
G=2 134-l C=2 13 4-bD=2 13
Gz=2 4547bCz=-0 6847kDz=-0 07
CA.3 12 CK=-0 60
GEz-0 32
4-k
CE=2 81 4&bDE=2 20
MEAN OROGRAPHY
G,=3 4247kCz=-0 34-W7FDz=0 44
CA=3 76 CK=-0 78
#
ENVELOPE OROGRAPHY
G=3
9OA-F
C=3
90
4zkD=3 90
G,=3 444ybCz=-0 4847+Dz=0
04
+CA=[
92k -WCK=+O 53+
GE=O 46 A,=866 CE=4 38 K,=947 DE=3 86
FIG.
8.
Box
diagrams (Lorenz, 1955) of energy conversion terms for the two ensemblk of
3
1
10-day forecasts and for
the
correspondent analyses [panel
(a)].
Subscript
Z
indicates zonal
quantities, while
E
indicates eddy quantities. No subscript means totals.
All
other symbols and
conventions
are as
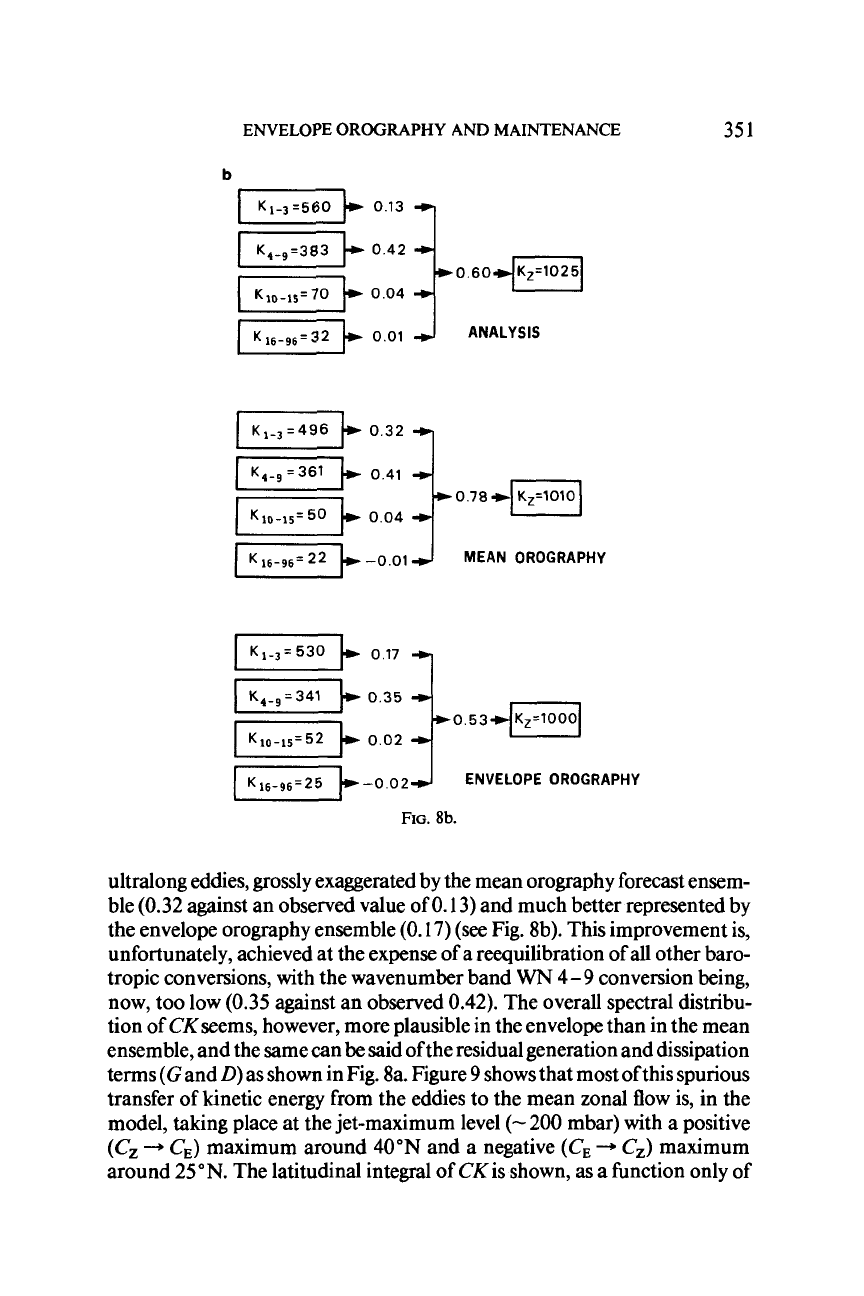
usual. Panel
(b)
shows
the
spectral
breakdown
of
the nonlinear barotropic
kinetic energy conversion term
CK
between the eddies and the
mean
zonal flow.
AU
energks
are
expressed
in
kilojoules
per
square
meter and
all
conversions in watts
per
square
meter.
All
terms
are integrated between
lo00
and
50
mbar and over the entire Northern Hemisphere.
ENVELOPE
OROGRAPHY
AND MAINTENANCE
35
1
b
m'k
-0.01
J
MEAN OROGRAPHY
0.5
3
4-1
ENVELOPE
OROGRAPHY
Fb
0.35
Fk
0.02
Fk-0
02
FIG.
8b.
ultralong eddies, grossly exaggerated by the mean orography forecast ensem-
ble
(0.32
against an observed value of
0.13)
and much better represented by
the envelope orography ensemble
(0.17)
(see Fig. 8b). This improvement is,
unfortunately, achieved at the expense of a reequilibration
of
all other baro-
tropic conversions, with the wavenumber band
WN
4-9
conversion being,
now, too low
(0.35
against an observed
0.42).
The overall spectral distribu-
tion of
CK
seems, however, more plausible in the envelope than in the mean
ensemble, and the same can be said ofthe residual generation and dissipation
terms
(G
and
D)
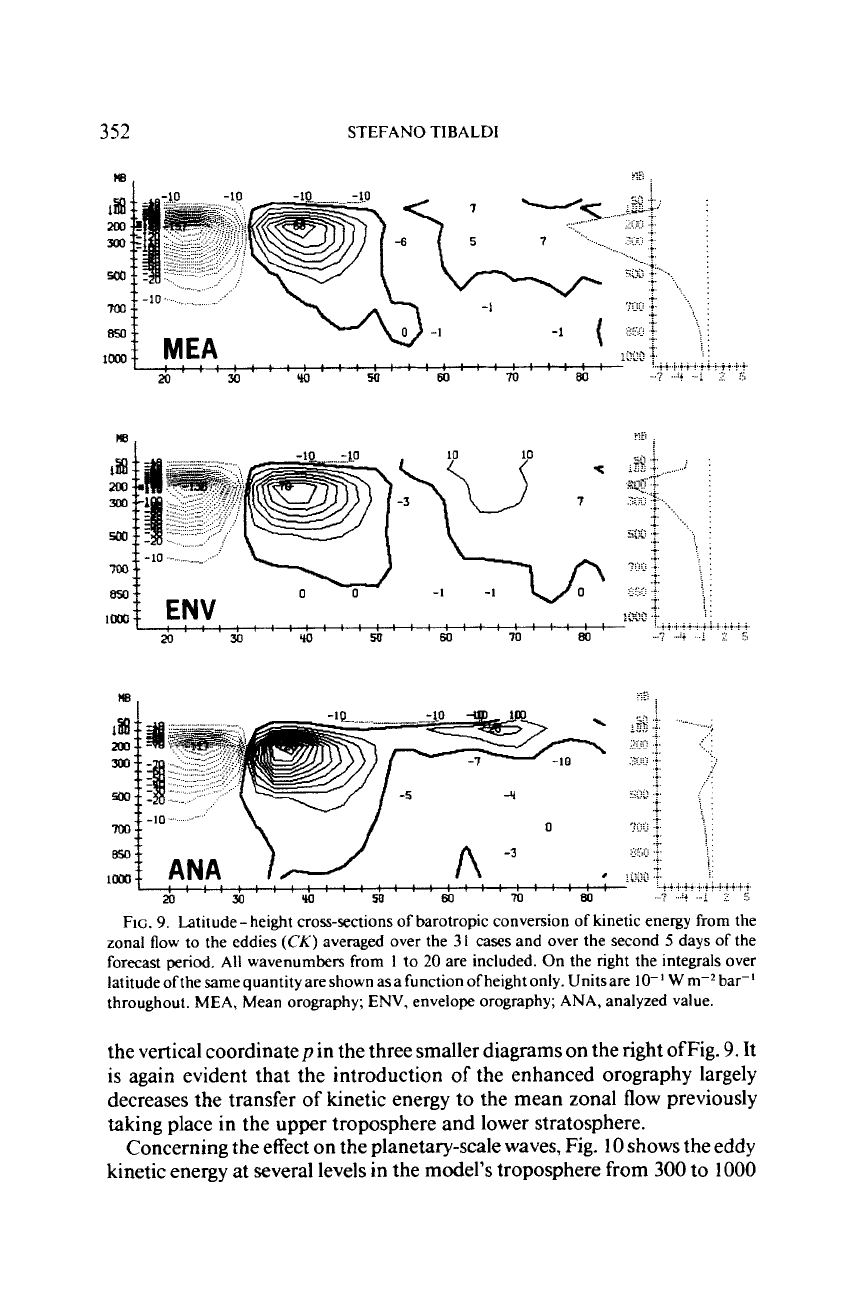
as shown in Fig. 8a. Figure
9
shows that most of this spurious
transfer of kinetic energy from the eddies to the mean zonal flow
is,
in the
model, taking place at the jet-maximum level
(-
200
mbar) with a positive
(C,
+
C,)
maximum around
40"N
and a negative
(C,
+
C,)
maximum
around
25"N.
The latitudinal integral of
CK
is shown,
as
a function only of
352
STEFAN0
TIBALDI
....
iii.
.
FIG.
9.
Latitude- height cross-sections
of
barotropic conversion of kinetic energy from the
zonal flow to the eddies
(CK)
averaged over the
3
I
cases and over the second
5
days of the
forecast period.
All
wavenumbers from
1
to
20
are included. On the right the integrals over
latitude of the same quantity are shown as a function of height only. Unitsare
lo-'
W
m-*
bar-'
throughout. MEA, Mean orography; ENV, envelope orography; ANA, analyzed value.
the vertical coordinatep in the three smaller diagrams on the right ofFig.
9.
It
is
again evident that the introduction
of
the enhanced orography largely
decreases the transfer
of
kinetic energy to the mean zonal flow previously
taking place in the upper troposphere and lower stratosphere.
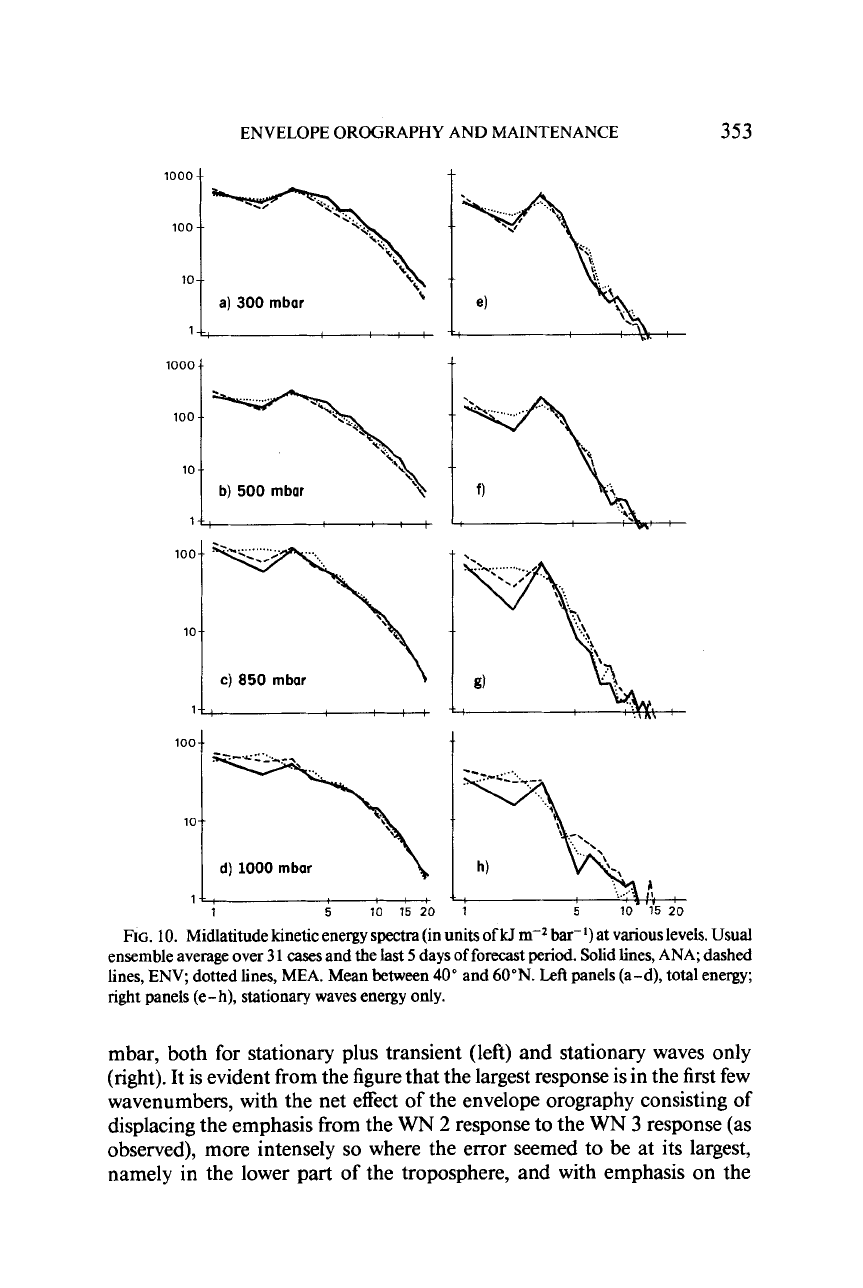
Concerning the effect on the planetary-scale waves,
Fig.
10
shows
the eddy
kinetic energy at several levels in the
model's
troposphere from
300
to
1000
ENVELOPE OROGRAPHY AND MAINTENANCE
353
1000
4
100
--
7
-<.,
10.-
'i
a)
300
mbar
1000
100
10
1
b)
500
mbar
n*.
...............
'>-;
~
".
1004
t
14:
t
1
5
10 15
20
:
'
.-.
...
'.
..,
,
'-
..
......
5 10 15
20
1
FIG.
10.
Midlatitude kinetic energy spectra (in units of
W
m--2
bar-') at
various
levels.
Usud
ensemble average over
3
1
cases
and the last
5
days
of
forecast
period.
Solid lines, ANA; dashed
lines, ENV, dotted lines, MEA. Mean between
40"
and
60"N.
Left
panels (a-d), total energy;
right
panels (e-h), stationary waves energy only.
mbar, both for stationary plus transient (left) and stationary waves only
(right). It is evident from the figure that the largest response is in the first few
wavenumbers, with the net effect
of
the envelope orography consisting
of
displacing the emphasis from the
WN
2
response to the
WN
3
response (as
observed), more intensely
so
where the error seemed to be at its largest,
namely in the lower part of the troposphere, and with emphasis on the