Sarma D.D. Geostatistics with Applications in Earth Sciences
Подождите немного. Документ загружается.

106 Geostatistics with Applications in Earth Sciences
samples as the area is small. It can be seen from Fig. 6.5, based on
lOft
averaged values, that while 17.9%
of
the total values (385 out
of
2154)
remained below 3 dwts/ton, the corresponding figures for 30 ft averaged
block and 100 ft averaged block values were 16.6% (119 out
of
718) and
10.2% (22 out
of
215) respectively. Further, while the mean value remained
the same at 6.9 dwts, the standard deviation was 15.7% for 10 ft values,
10.9% for 30 ft values and 8.8% for 100 ft average values .
6.5.2 Example: Lode Z: gold field 2
In this lode, the units
of
measurement are: gms/tonne
of
ore for grade, ems
for width
of
the
reef
and cm-gms for accumulation. A total
of
4, I79 grade
values distributed over four levels
-each
separated in depth by approxi-
mately 30 m have been considered. These samples were drawn at I m
interval
of
distance. These can also be viewed as point samples drawn from
blocks
of
size I m x 3 m. Figures 6.6 a and b shows the distribution
of
assay
values and averaged over blocks
of
size 30 m x 30 m. These averaged block
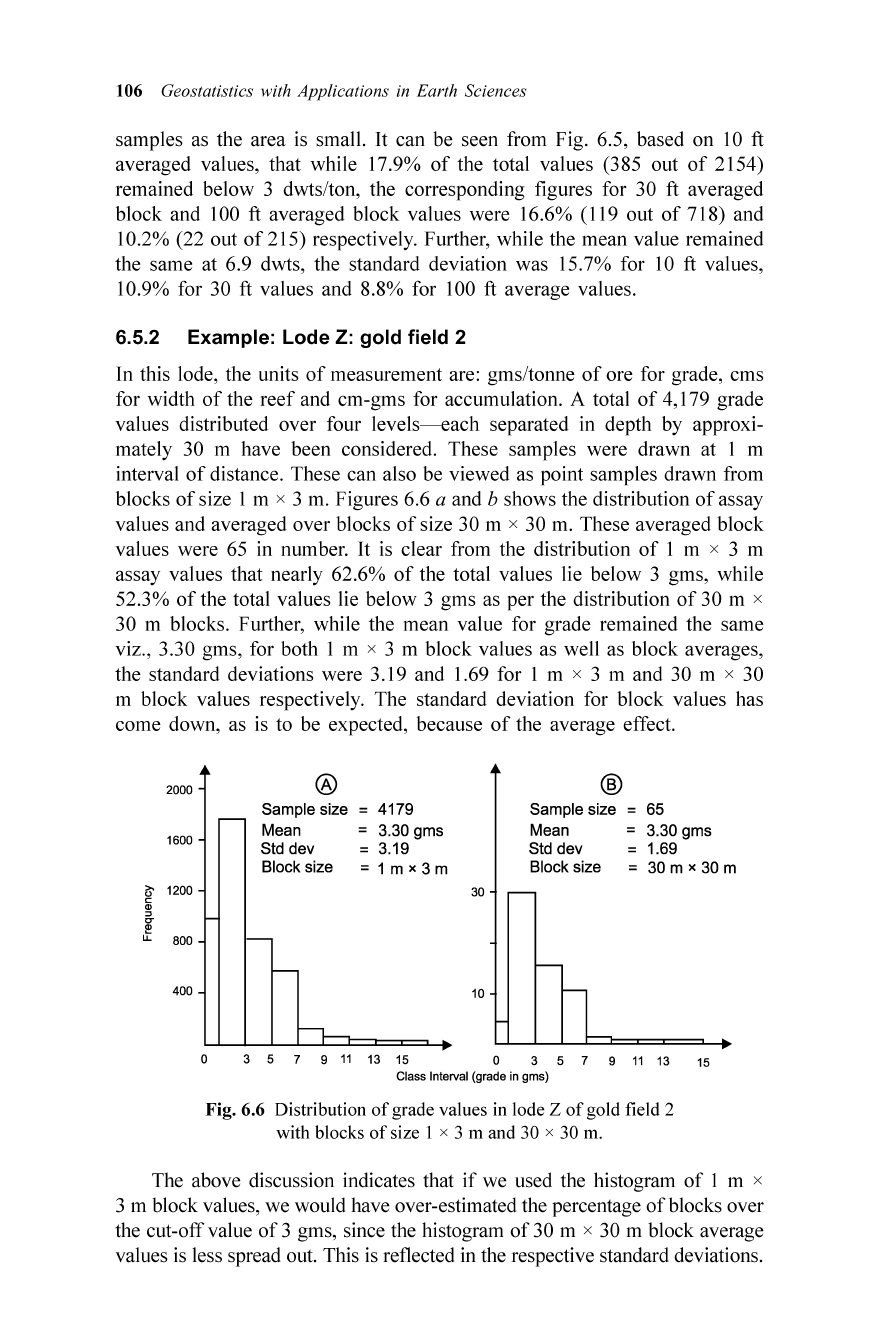
values were 65 in number. It is clear from the distribution
of
I m x 3 m
assay values that nearly 62.6%
of
the total values lie below 3 gms, while
52.3%
of
the total values lie below 3 gms as per the distribution
of
30 m x
30 m blocks. Further, while the mean value for grade remained the same
viz., 3.30 gms, for both I m x 3 m block values as well as block averages,
the standard deviations were 3.I9 and 1.69 for I m x 3 m and 30 m x 30
m block values respectively. The standard deviation for block values has
come down, as is to be expected, because
of
the average effect.
30 -
65
3.30 gms
= 1.69
= 30 m x 30 m
1
-
®
Sample size =
Mean
SId dev
Block size
10
=4179
= 3.30 gms
= 3.19
< f m x z rn
-
®
Sample size
Mean
SId dev
Block size
-
-
400
2000
1600
go
1200
'"
"
C7
£ 800
o 3 5 7 9 11 13 15 0 3 5 7 9 11 13 15
Class Interval (grade in gms)
Fig. 6.6 Distribution
of
grade values in lode Z
of
gold field 2
with blocks
of
size I x 3 m and 30 x 30 m.
The above discussion indicates that if we used the histogram
of
I m x
3 m block values, we would have over-estimated the percentage
of
blocks over
the cut-off value
of
3 gms, since the histogram
of
30 m x 30 m block average
values is less spread out. This is reflected in the respective standard deviations .
Regularised Models,
Vo
lum
e-V
arian
ce Re
lation
ships and
Economi
cs
107
Therefore, defining the ore depends on the unit
of
selection in terms
of
size
and shape. If our deposit is divided in terms
of
blocks
of
size 30 m x 30 m
which is the usual practice, then it is proper to draw inferences on the
percentage
of
blocks below cut-off based on this unit. Let us discuss this
point a little further.
Let us suppose that in a deposit, we have core samples
of
length
Land
blocks with volume v. We also assume that we have the variograms "Mh) and
yv(h)
with sill values C
L
and C
v
respectively. Since the average values
XL
and
Xv(for cores and the averaged block values respectively) are one and the
same, we represent this as
X. Also, given the variogram model for the point
samples, we can arrive at the variogram model for cores
of
length
Land
vice-versa. If we consider a core
of
length L and two points p and
p',
separated by a distance h, we can compute the difference in grades for
various possible pairs
of
p and
p'
, which exist within this core length. Here
the diameter
of
the core is negligible compared to core length. Hence the
sample can be considered as having zero volume and the core length as a
straight line. This gives us a measure
of
the variability
of
the grades and
leads us to the computation
of
variogram function, which in turn gives us the
variance
of
the grades within the core length L. This within variance in the
core length
L is the
one
which is removed
if
we considered only the
average grade
over
L. Mathematically, this within variation [C - C
L
]
may
be expressed as:
LL
(12(0
/L) =
~
ff
y(p
-
p'
)dpdp' (6.7)
L
00
The same logic is applicable to point samples vs panels each
of
size
L x B, i.e. 2D panels. In this case, we have to evaluate quadruple integrals
since the points
p and
p'
can move throughout the whole panel. This is
discussed in more detail in Chapter 7.
6.6 THE WITHIN VARIATION IN CORE LENGTH L:
DIFFERENT CASES
In the case
of
linear variogram, i.e., when y(h) = mh, this within variation
reduces to
mL/3.
In
the
case
of
exponential variogram
of
the type:
y(h) = C[I -
exp(
-h
/a)] for h
~
0, the within variation reduces to:
C
[1-2
~
+
:~
{1-eXP(-L)a}],
and corresponds exactly with the difference
in the point and regularised semi-variograms. For spherical models, this within
. . . C L [ L
2
)
variation IS: - -
10-
2
for
L < a and
20 a a
C [ I a
2
)
20
20-15~+4
L2 for L
~
a (see Clark, 1979).
108 Geostatistics with Applications in Earth Sciences
6.7 DISTRIBUTIONS BASED ON CORE SAMPLE STATISTICS
AND DERIVED ONES FOR POINT SAMPLES
Let us now study the economic implications posed in tonnage and grade
above the cut-off grade due to a change in the support. For this, we should
know the distribution
of
samples. Usually the element concentrations in
massive types
of
ore bodies such as iron and bauxite (elements Fe
20
3
, AI
20
3
etc.) follow approximately normal distribution . The element concentrations
in precious mineral deposits such as gold, uranium etc., follow a positively
skewed distribution. We have seen that in the case
of
Fe
20
3
element
of
the
bauxite example, the distribution is approximately normal. We recall the
following statistics with respect to these examples.
Element Fe
20
3
:
Core length 0.5 m; Distribution: Normal; Sample size = 60
Case Mean Std. dev.
I. Distribution
of
cores
of
0.5 m 25.17% s =
m%
= 5.29%
2.
Distribution
of
point samples 25.17% s = .J30.48% = 5.52%
(derived)
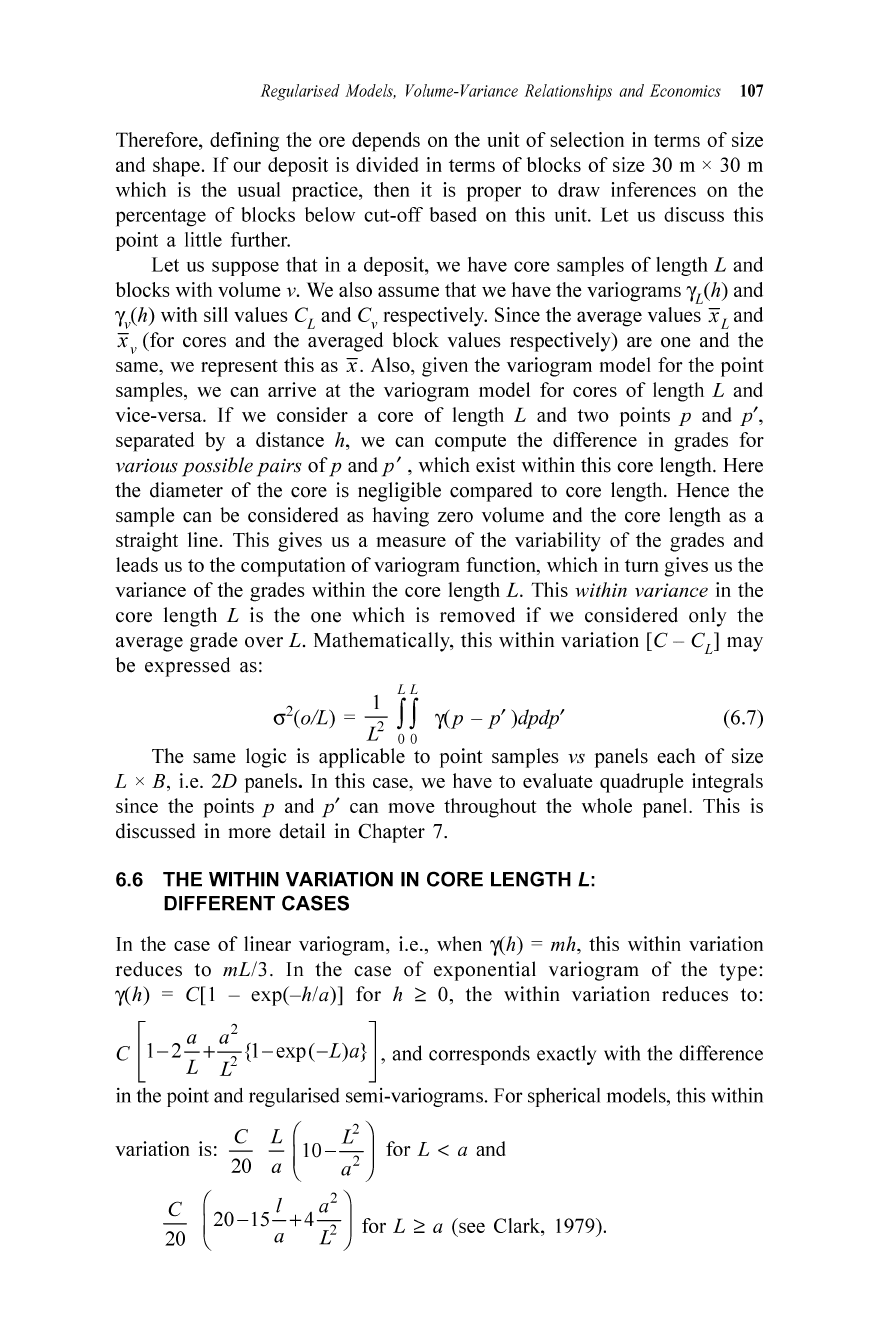
Given the mean and the variance, the distributions can be worked by
standardising the variable. The distributions
of
Fe
20
3
with mean 25.17% and
standard deviations
5.52% (derived) for point samples and 5.29% for core
samples are shown in Fig.
6.7.
20
~
c
~
10
c::r
~
LL.
o
10
,,
'-
.
. ,
/ .
. \
I •
\
I
. \
I ,
I
25
(Grade in
'Yo)
\\/
Point samples
40
Fig. 6.7 Distribution
of
Fe
20
3
element values with mean 25.17% and variances
(A) 28.0(%)2 (cores) and
(8)
30.48(%)2 (derived sill value for point samples).
Regularised Models,
Vo
lum
e-V
arian
ce Re
lation
ships and
Economi
cs 109
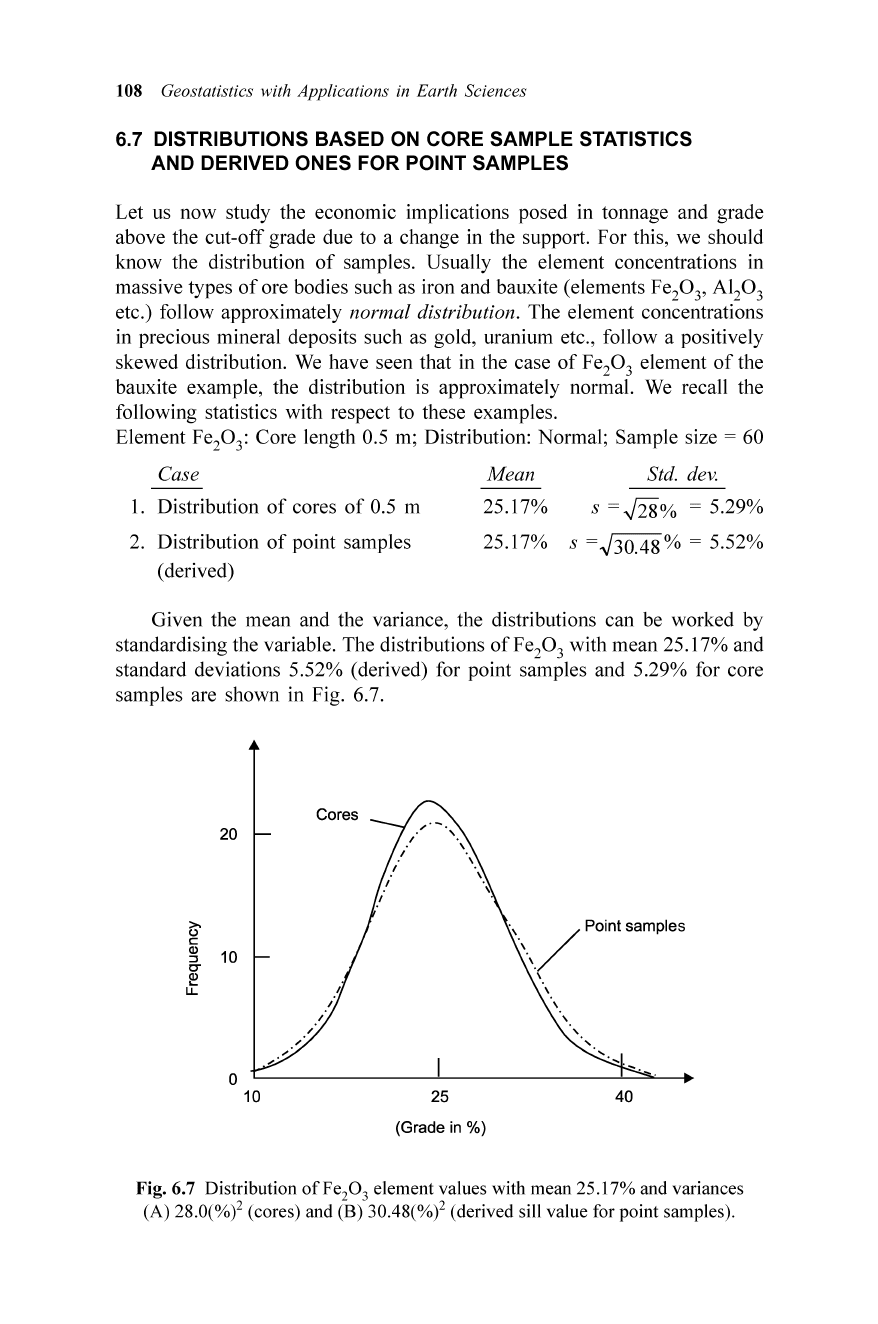
Table 6.6 Fitting normal distribution to Fe
20
3
element values with
x = 25.17% and standard deviation
(s)
= 5.29% (core samples) in case 1
x-x
X
sl'
Probability
y
10 - 15.2/5.29
= - 2.86 0.0067 x 60 =
0.40
15 - 10.2/5.29
= - 1.92
0.063
x 60 =
3.78
20 - 5.2/5.29
= - 1.03 0.235
x 60 =
14.10
25 0.2/5.29 = 0.03
0.34 14
x 60 =
20.48
30 4.8/5.29 = 0.85
0.2689
x 60 =
16.13
35 9.8/5.29 = 1.85
0.072 1
x 60 =
4.32
40 14.8/5.29 = 2.69
0.0107
x 60 =
0.31
59.52
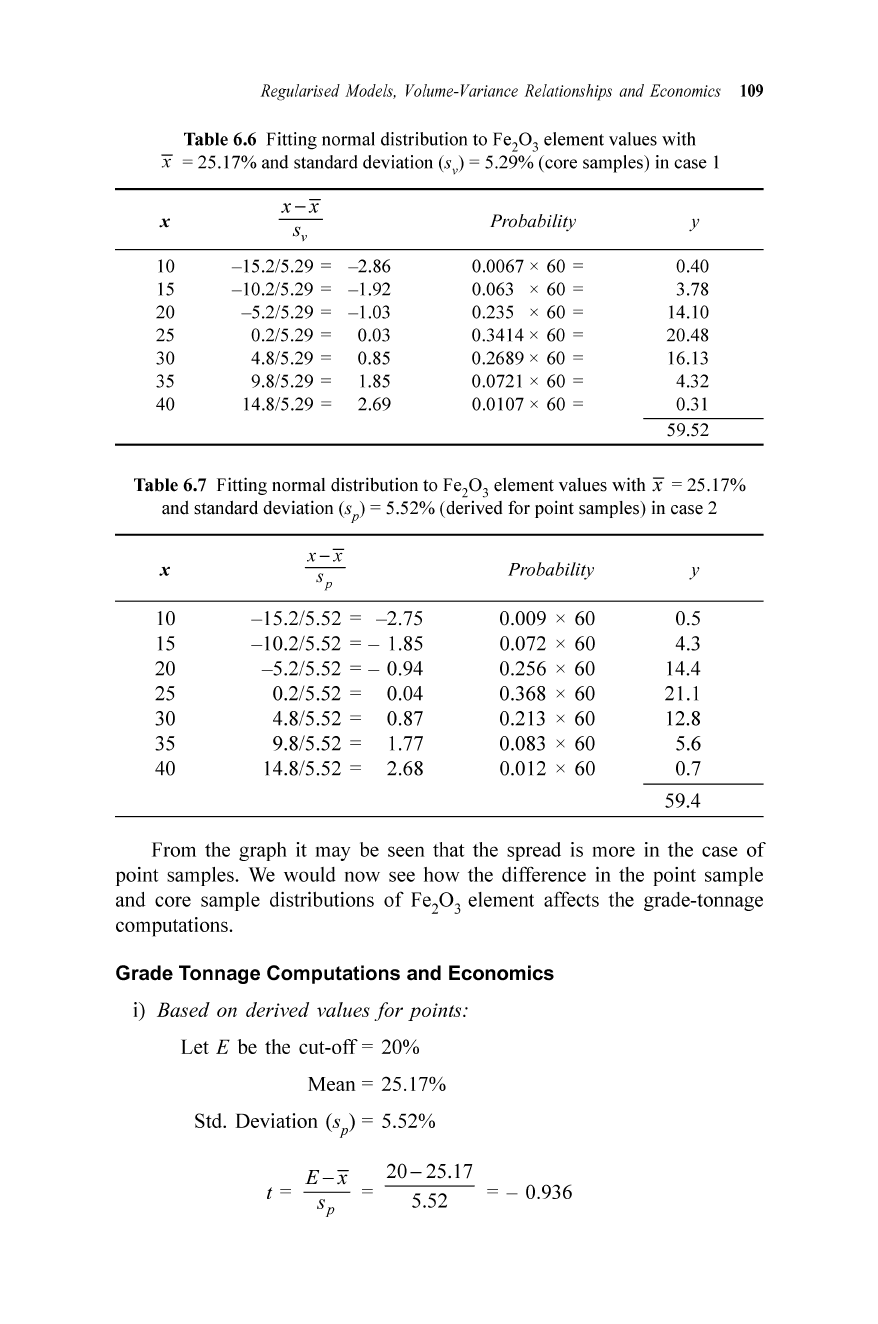
Table 6.7 Fitting normal distrib ution to
Fe.O, element values with x = 25.17%
and standard deviation
(sp) = 5.52% (derived for point samp les) in case 2
x-x
x
--
Probability y
sp
10 - 15.2/5.52 = - 2.75 0.009 x 60
0.5
15
- 10.2/5.52
= - 1.85 0.072 x 60
4.3
20
- 5.2/5.52
= - 0.94 0.256 x 60
14.4
25
0.2/5.52
=
0.04
0.368
x 60
21. 1
30
4.8/5.52
=
0.87
0.2 13
x 60
12.8
35
9.8/5.52
=
1.77
0.083
x 60
5.6
40
14.8/5.52
=
2.68
0.0 12
x 60
0.7
59.4
From the graph it may be seen that the spread is more in the case
of
point samp les. We would now see how the differe nce in the point sample
and core sample distributions
of
Fe
20
3
element affects the grade-tonnage
computations.
Grade Tonnage Computations and Economics
i) Based on derived values
for
points:
Let E be the cut
-off
= 20%
Mean
= 25.17%
Std. Deviation
(sp) = 5.52%
t =
20
-25
.17
5.52
= - 0.936
110 Geostatistics with Applications in Earth Sciences
Consulting the standard normal tables (which are available in any standard
text book on Statistics), we have
<I>(t)
= 0.256 so that p (the proportion
of
ore
above cut-oft) = I - 0.178 = 0.824. The average grade
of
this ore which is
s
above cut
off
is: xE = X + :
<I>(t)
, where
<I>(t)
is the height
of
the standard
. I
normal curve at value t, I.e.,
<I>(t)
=
~exp(
-P).
Here
<I>(t)
=
<1>(
-0.936)
=
v2n
0.256. Therefore, xE = 25.17 + 5.52 x 0.256 = 25.17 + 1.71 = 26.88%
0.824
==
26.9%. Thus, 82.4%
of
the ore lies above the cut-off
of
20% and this has
an average grade
of
approximately 26.9%.
ii)
Based on Core Samples
of
Length 0.5 m:
E (cut oft) = 20%
Mean x = 25.17%
Std. Deviation
(s)
= 5.29%
The proportion p
of
the distribution above cut-off is given by: Pr
(x
>E). The standardised variable t = (E - x )/svworks out to : (20 - 25.17)/
5.29 = (- 0.977). Consulting the standard normal tables,
<I>(t)
- the proportion
of
ore lying below cut-off i.e., the area in the standard normal curve lying
below t = 0.162 so that the proportion
of
ore lying above the cut-off = I
-
<I>(t)
= 0.838 . We now would like to know the average grade
of
this 83.8%.
s
The average grade above cut-off is given by: xE = X + ;
<I>(t)
, where
<I>(t)
is the height
of
standard normal curve at t = - 0.977.
With respect to our example, we have:
<I>(t)
=
<1>(
-0
.977) = 0.247 so that
_ _ Sv 5.29
x E = x +p<l>(t) = 25.17 + 0.838 x 0.247 = 25.17 + 1.56 = 26.79%.
Therefore, 83.8%
of
the ore lying above the cut-off has an average grade
of
26.79%.
iii) Based on actual 1 m core length variogram values:
E (cut oft) = 20%, Mean = 25.17%, Std. Dev. = 4.58
t = - 5. 17/4.58 = - 1.163;
<I>(t)
= 0.23,
and p = 0.877 .
<I>(t)
=
<1>(
-1.13)
.
s 4.58
x E = X + ;
<I>(t)
= 25.17 + 0.87 x 0.211 = 25.17 + 1.02 = 26.27%.
Regularised
Models
,
Volume-Varian
ce Relationships and
Economics
111
Therefore, 87.7% of the ore will be above the cut-off and this average
grade is approximately 26.27%. Table 6.8 gives a comparison of these
observations.
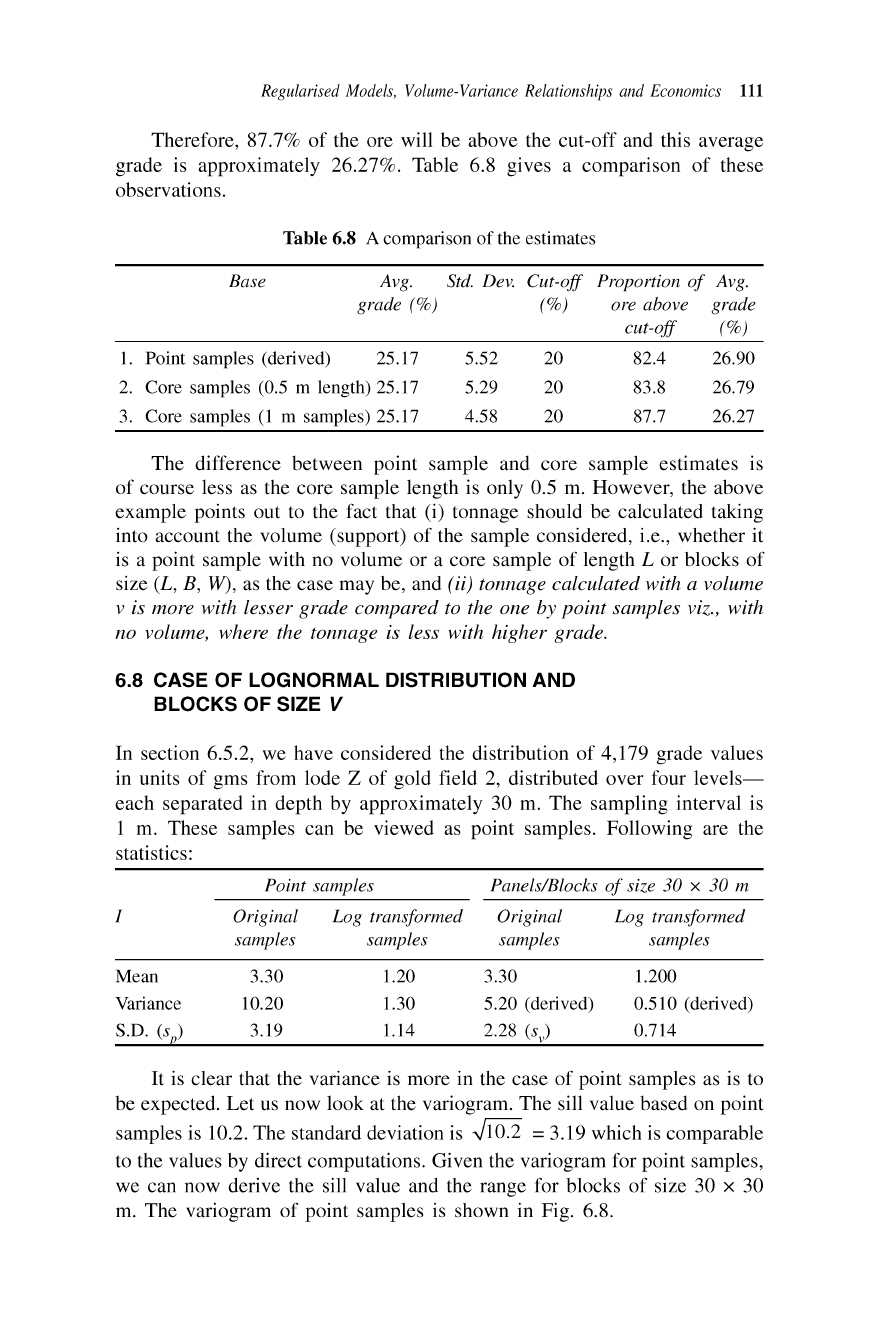
Table 6.8 A comparison of the estimates
Base
Avg
. Std. De v. Cut
-off
grade (%) (%)
Proportion
of
Avg.
ore above grade
cut
-off
(%)
I. Point samples (derived) 25.17
2. Core samples (0.5 m length) 25.17
3. Core samples
(I
m samples) 25.17
5.52
5.29
4.58
20
20
20
82.4 26.90
83.8 26.79
87.7 26.27
The difference between point sample and core sample estimates is
of course less as the core sample length is only 0.5 m. However, the above
example points out to the fact that (i) tonnage should be calcu lated taking
into account the volume (suppo rt) of the sample considered, i.e., whether it
is a point sample with no volume or a core sample of length L or blocks of
size (L, E, W), as the case may be, and
(ii)
tonnage calculated with a volume
v is more with lesser grade compared to the one
by point samples viz., with
no volume, where the tonnage is less with higher grade.
6.8 CASE OF LOGNORMAL DISTRIBUTION AND
BLOCKS OF SIZE
V
In
section 6.5.2, we have considered the distribution of 4,179 grade values
in units of gms from lode Z of gold field 2, distributed over four level
s-
each separated in dep th by approximately 30 m. The sampling interva l is
I m. These samples can be viewed as point samples. Following are the
statistics :
I
Point samples
Original Log transformed
samples samples
Panels/Blocks
of
size 30 x 30 m
Original Log transformed
samples samples
Mean
Variance
S.D.
(s,,)
3.30
10.20
3.19
1.20
1.30
I.l
4
3.30
5.20 (derived)
2.28 (
s)
1.200
0.510 (derived)
0.714
It is clear that the variance is more in the case of point samples as is to
be expected. Let us now look at the variogram . The sill value based on point
samples is 10.2. The standard deviation is
~
1O
.
2
= 3.19 which is comparable
to the values by direct computations . Given the variogram for point samples,
we can now derive the sill value and the range for blocks of size 30 x 30
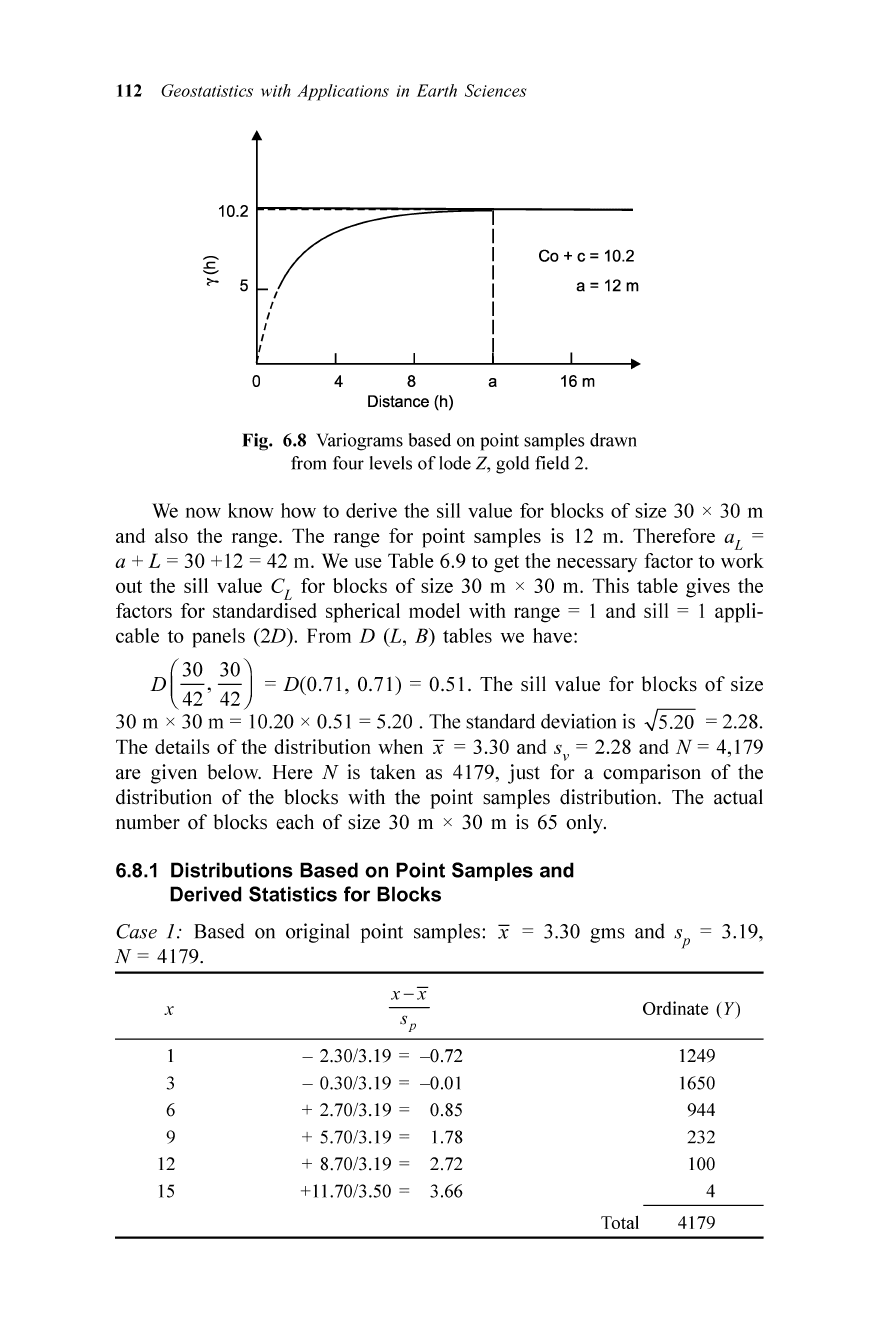
m. The variogram of point samples is shown in Fig. 6.8.
112 Geostatistics with Applications in Earth Sciences
10.2
t------::==-~------
I
I
I
I
I
I
o 4 8 a
Distance (h)
Co
+ c =10.2
a = 12 m
16 m
Fig. 6.8 Variograms based on point samples drawn
from four levels
of
lode Z, gold field 2.
We now know how to derive the sill value for blocks
of
size 30 x 30 m
and also the range. The range for point samples is 12 m. Therefore a
L
=
a + L = 30 +12 = 42 m. We use Table 6.9 to get the necessary factor to work
out the sill value C
L
for blocks
of
size 30 m x 30 m. This table gives the
factors for standardised spherical model with range = I and sill = I appli-
cable to panels (2D). From D (L, B) tables we have:
D(~~,
~~)
= D(0 .71, 0.71) = 0.51. The sill value for blocks
of
size
30 m x 30 m = 10.20 x 0.51 = 5.20 . The standard deviation is .J5.20 = 2.28.
The detail s
of
the distribution when x = 3.30 and Sv = 2.28 and N = 4,179
are given below. Here N is taken as 4179, just for a comparison
of
the
distribution
of
the blocks with the point samples distribution. The actual
number
of
blocks each
of
size 30 m x 30 m is 65 only.
6.8.1 Distributions Based on Point Samples and
Derived Statistics for Blocks
Cas e 1: Based on original point samples: x = 3.30 gms and sp = 3.19,
N = 4179.
x
1
3
6
9
12
15
- 2.30/3.19
= - 0.72
- 0.30/3.19 = - 0.0 I
+ 2.70/3.19 = 0.85
+ 5.70/3.1
9=
1.78
+ 8.70/3.1
9=
2.72
+ 11.70/3.50 = 3.66
Total
Ordinate
(Y)
1249
1650
944
232
100
4
4179
Regularised Models,
Vo
lume-Variance Relationships and
Eco
nomics
113
Case 2: Based on derived statistics for blocks
of
size 30 m x 30 m: x =
3.30, derived standard deviation value (
s)
= 2.28 and N = 4179.
x
1
3
6
9
12
- 2.30/2.28
= - 1.0 I
- 0.30/2.28 = - 0.13
2.70/2.28
= 1.18
5.70/2.28
= 2.50
8.70/2.28
= 3.81
Total
Ordinate
(Y)
1036
1737
1048
323
35
4179
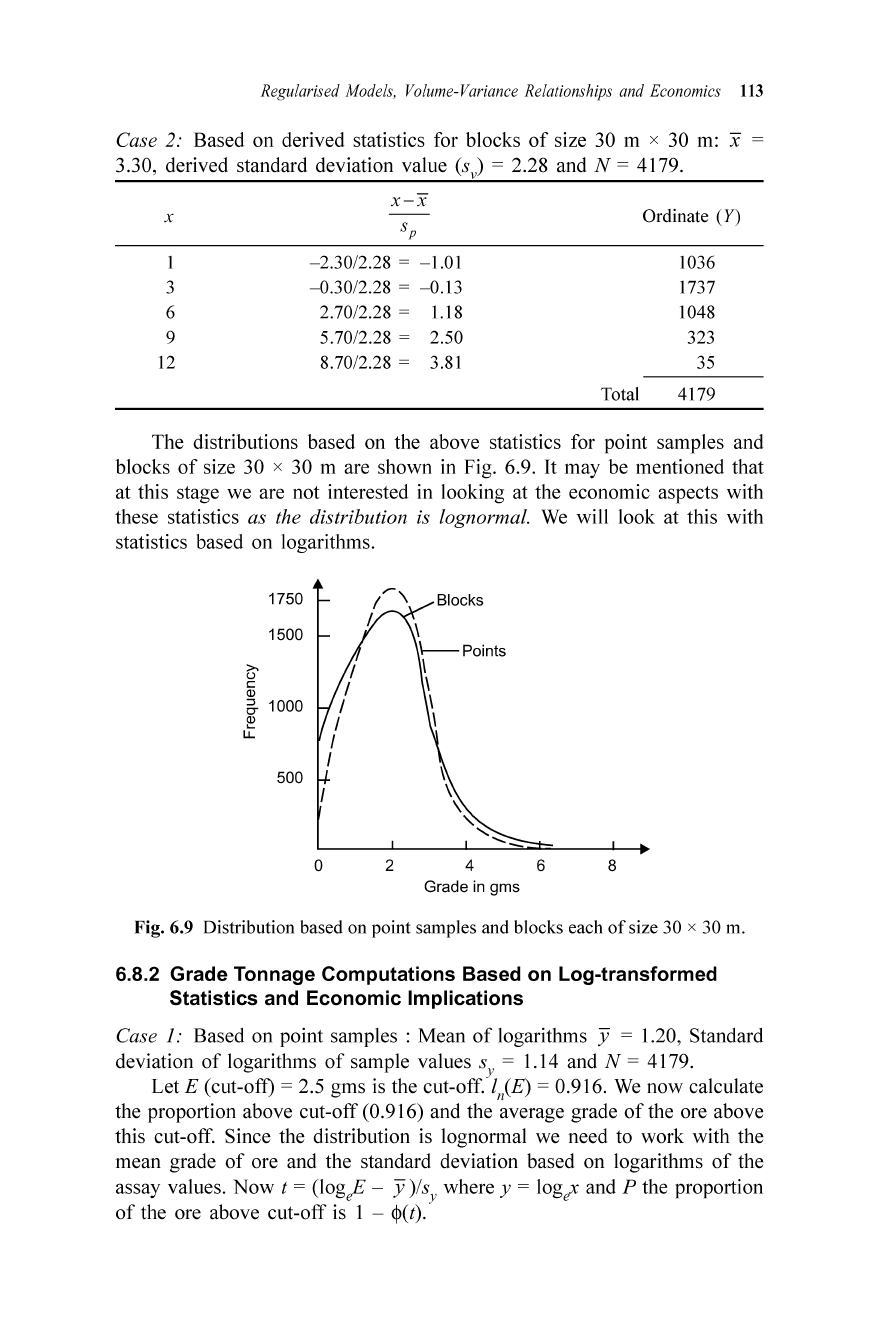
The distributions based on the above statistics for point samples and
blocks
of
size 30 x 30 m are shown in Fig. 6.9. It may be mentioned that
at this stage we are not interested in looking at the economic aspects with
these statistics as the distribution is lognormal. We will look at this with
statistics based on logarithms.
1750
1500
~
c::
Ql
g.
1000
~
lL.
500
o 2 4 6
Grade in gms
8
Fig. 6.9 Distribution based on point samples and blocks each
of
size 30 x 30 m.
6.8.2 Grade Tonnage Computations Based on Log-transformed
Statistics and Economic Implications
Case 1: Based on point samples : Mean
of
logarithm s y = 1.20, Standard
deviation
of
logarithms
of
s
a
~
p
l
e
values
Sy
= 1.14 and N = 4179.
Let E (cut-oft) = 2.5 gms IS the cut-off. In(E) = 0.916. We now calculate
the proportion above cut-off (0.916) and the averag e grade
of
the ore above
this cut-off. Since the distribution is lognormal we need to work with the
mean grade
of
ore and the standard deviation based on logarithms of the
assay values. Now t = (logeE -
Y)
/Sy where y = logex and P the proportion
of
the ore above cut-off is I -
<1>(t)
.
114 Geostatistics with Applications in Earth Sciences
The
average grade above
cut-off
is given by IfE = ; If where Q = 1 -
<I>(t
- 8), and If =
(x)
= mean = 3.30
gms
. Since the
cut-off
is 2.5 gms/ton ,
loge E - Y
0.916-1.20
we have t = = - 0.249. Therefore, the proportion
Sy 1.14
of
ore below the
cut-off
= 0.4013 and P the proportion
of
the ore above the
cut-off'> 1 -
<I>(t)
= 0.5987. This means the point samples tell us that
59.87%
of
the deposit will be above cut-off.
The
average value
of
the ore above this
cut-off
is given by (QIP) where Q = 1 -
<I>(t
- S
y).
Q = 1 -
<1>(
-0.249
- 1.14) = I -
<1>(
-1.389)
= 1 - 0.0823 = 0.9177.
_ 0.9177
g E = 0.5987 x 3.30 = 5.05
gms
.
That is
59.87%
of
the deposit will be above
cut-off
and this has an
average grade
of
5.05
gms
.
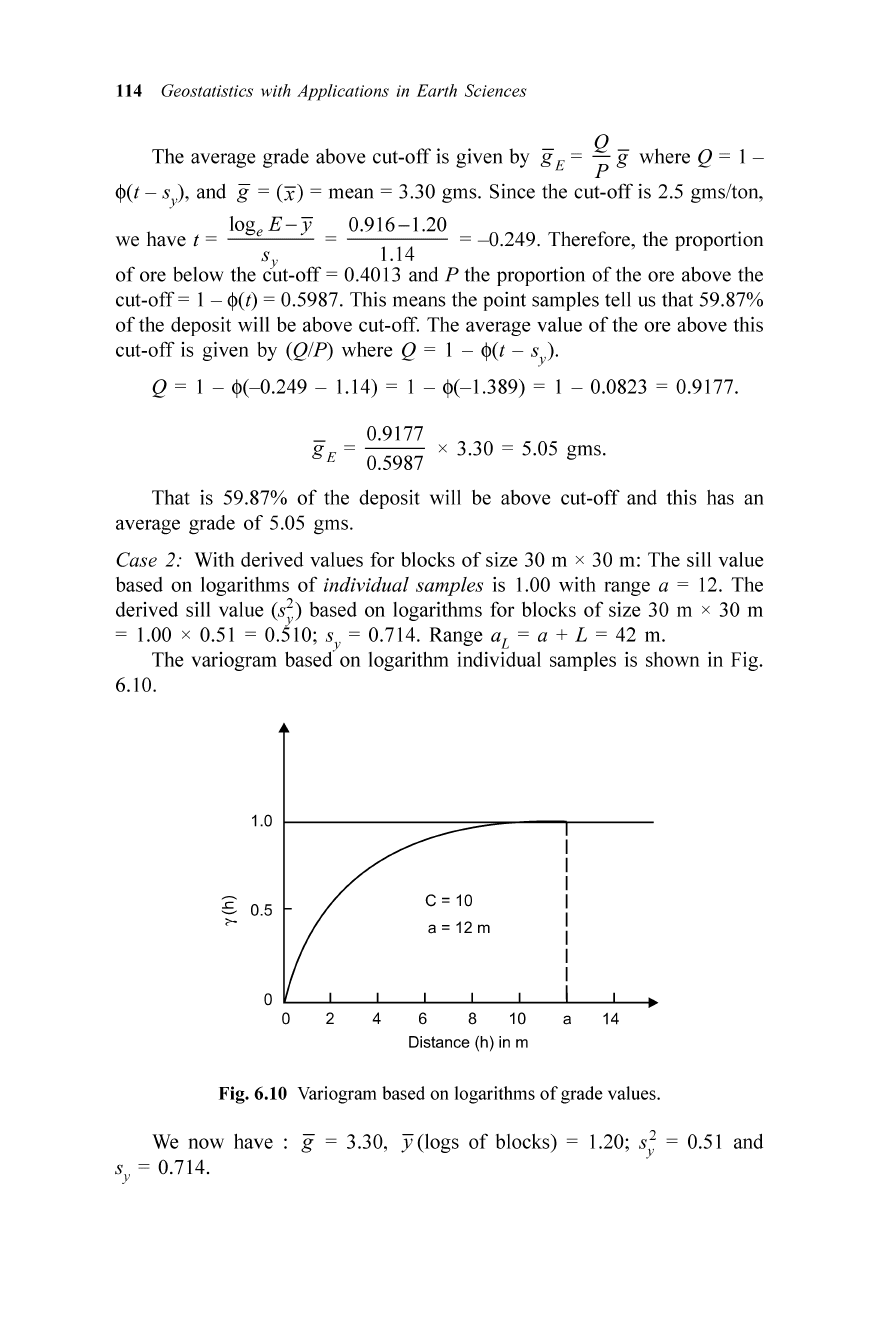
Case 2: With derived values for blocks
of
size 30 m x 30 m: The sill value
based on logarithms
of
individual samples is 1.00 with range a = 12.
The
derived sill value (s
;)
based on logarithms for blocks
of
size 30 m x 30 m
= 1.00 x 0.51 = 0.510 ; Sy = 0.714. Range a
L
= a + L = 42 m.
The variogram based on logarithm individual samples is shown in Fig.
6.10.
1.0
1------------.,='"'---,.----
;s 0.5
?-
2
C = 10
a =12 m
4 6 8 10
Distance (h) in m
a 14
Fig. 6.10 Variogram based on logarithms
of
grade values.
We
now
have : If = 3.30, Y(logs
of
blocks) = 1.20;
s2
= 0.51 and
y
Sy = 0.714.
Regularised Models,
Vo
lum
e-V
arian
ce Re
lation
ships and
Economi
cs
115
.
10g
eE-y
0.916
-1.20
Wzthcut-offE
=2
.5gms
,wehave
:t
= Sy = 0.714
=-
0.397.
<I>(t)
- proportion
of
ore below cut
off
= 0.3446 and P - proportion
of
ore
above cut
off
= 0.6554 . Q = I -
<1>(
-0
.397 - 0.714) = I -
<1>(
-1.1
II)
= I -
0.1335 = 0.8665. Therefore :
_
(Q
_)
0.8665
g E = P g = 0.6554 x 3.30 = 4.36 gms.
That is 65.54%
of
the ore will have a grade above the cut-off
of
2.5 gms
and the average
of
this percentage is 4.36 gms. Thus, we see that the selection
made on a block unit produces a larger tonnage with lower grade than
estimated from point/punctual samples where we see smaller tonnage with
higher grade.
Table 6.9 gives values
of
a function D to be used in 2D panels
of
length
L and breadth B for a standardised spherical model with range = 1.0 and sill
= 1.0.
Review Questions
Q. I. Given a point model, discuss the procedure for obtaining the regularised
model for cores
of
length L.
Q. 2. Discuss volume-variance relationship.