Simon Benninga. Financial Modelling 3-rd edition
Подождите немного. Документ загружается.


188 Chapter 5
In this spreadsheet we have used the format of the consolidated
statement of cash fl ows. The highlighted items relate to Cullen Frost’s
fi nancing that we consider to be not directly related to its lending or
other banking activities. The sum of the activities is the bank’s free cash
fl ow.
5.4 Large Bank Corporation Buys Small Bank: A Valuation Example
We implement the bank FCF valuation model by examining a possible
purchase of Small Bank, Inc., by Large Bank Corporation. Our prob-
lem will be the valuation of Small Bank. In February 2007, Daniel Rogers,
the CEO of Large Bank Corporation, was approached by an investment
banker representing Small Bank, Inc. Small Bank’s board had become
convinced that there was no future for Small without its incorporation
into a larger corporate structure. Small Bank was a very conservatively
fi nanced bank that had 350 offi ces throughout North and South Carolina.
Its loan portfolio was about 70 percent consumer loans, 20 percent real
estate lending, and 10 percent commercial loans. Small Bank was largely
deposit driven: Of the $9 billion of total assets at year-end 1997, $7.6
billion were deposits, a signifi cant percentage of which were non-inter-
est-bearing. Large Bank, by contrast, had $31 billion of deposits out of
total assets of $45 billion, but $23 billion of these deposits were interest-
bearing. Small Bank’s management was concerned that the cost of
deposits would rise over the coming years, as their customers started to
become more like the sophisticated customers of Large Bank. Further-
more, Small Bank’s management knew that there were signifi cant econo-
mies of scale in check processing and other “back offi ce” activities that
would stem from a merger with a large, effi cient organization like Large
Bank. Small Bank’s current share price was $45.
Dan Rogers was interested in the deal: Under his leadership, Large
Bank Corporation had been aggressive in purchasing numerous smaller
banks. Its stock price rise had been very impressive, and Rogers was
determined to keep purchasing banks. Large Bank had also branched
out into securities dealership, having purchased one of the major mutual
fund organizations. In the course of its expansions, Large Bank had
learned some lessons the hard way:

189 Bank Valuation
•
Engage only in share deals: Large Bank’s preferred merger was an
exchange of shares and a pooling of interest.
•
Make purchases only where markets were mutually exclusive.
•
Make purchases only where signifi cant operational gains could be
made.
5.4.1 Analysis
Rogers asked one of his fi nancial analysts to perform a “quick and dirty”
analysis of a possible merger between the two fi nancial institutions. He
wanted to come up with a range of possible values for Small Bank so
that he could then discuss the merger with his chairman. If the chairman
and some other leading members of the board’s fi nance committee
thought that the proposed merger should be brought to the full board
of Large Bank, then an investment banking adviser would be brought in
to work with the bank’s staff to do a full-blown (and expensive) analysis
of the merger.
5.4.2 The Model
Large Bank’s fi nancial analyst built a model, based only on publicly
available information and some educated guesses. The critical assump-
tions of the model were as follows:
•
Increasing cost of deposits over time: The market for “free”
deposits—deposit accounts without interest paid to the depositor—was
thought to be gradually phased out.
•
A dividend payout ratio of 60 percent.
•
Five percent of deposits held as non-interest-bearing cash.
•
No increase in Small Bank’s debt.
•
A signifi cant decrease in Small Bank’s expense ratio (calculated by the
analyst as the percentage of expenses out of net interest income). This
represented savings in staffi ng and computerization—much of Small
Bank’s back offi ce work could comfortably be accommodated by Large
Bank with a signifi cant decrease in costs.

190 Chapter 5
1
2
3
4
5
6
7
8
9
10
11
12
13
14
15
16
17
18
19
20
21
22
23
24
25
26
27
28
29
30
31
32
33
34
35
36
37
38
39
40
41
42
43
44
45
46
47
48
49
50
51
52
53
54
55
56
57
58
59
60
61
62
63
64
65
66
67
68
69
70
71
72
73
74
BACDEFHG
Cash as percent of deposits 5.0%
Interest on cash 0.0%
Interest on other investment securities 6.19%
Interest on mortgages 8.13%
Interest on other earning assets 6.71%
Interest on loans 8.77%
Interest on deposits 3.51% 3.60% 3.80% 3.90% 4.00% 4.20%
Interest on short-term borrowing 4.72%
Interest on long-term debt 6.38%
Loan loss as % of outstanding loans 0.30%
Noninterest income as % of interest income 25.30%
Noninterest expense as % of net interest income 70.00% <-- was 74.35%, but Large Bank analyst thinks this will go down to 70%
Growth rate of net loans 6%
Growth rate of deposits 5%
Depreciation rate 10%
Income tax rate 35%
Dividend payout ratio 60%
Balance sheets
2006
Financial
statements
2007 2008 2009 2010 2011
Cash 386,832 400,042 420,044 441,046 463,098 486,253
<-- =$B$2*G40
Other investment securities, including
money market instruments
[balance sheet plug]
2,190,106 942,851 949,564 952,879 952,403 947,709
<--
=IF(G26+G28+G29+G30+G35+G37>G47,
0,G47-(G26+G28+G29+G30+G35+G37))
Mortgage loans held for sale 18,953 18,953 18,953 18,953 18,953 18,953 <-- =F28
Other earning assets 21,444 21,444 21,444 21,444 21,444 21,444 <-- =F29
Loans, net 5,869,914 6,222,109 6,595,435 6,991,161 7,410,631 7,855,269 <-- =F30*(1+$B$17)
Land 38,099 38,099 38,099 38,099 38,099 38,099
Other fixed assets 282,956 356,728 396,364 440,405 489,339 543,709 <-- =G34+G35
Accumulated depreciation 156,754 192,427 232,063 276,104 325,038 379,408 <-- =F34-G69
Net fixed assets and land 164,301 164,301 164,301 164,301 164,301 164,301 <-- =F35
Other assets 360,087 360,087 360,087 360,087 360,087 360,087 <-- =F37
Total Assets 9,011,637 8,129,786 8,529,828 8,949,872 9,390,918 9,854,016 <-- =G37+G35+SUM(G26:G30)
Deposits 7,619,842 8,000,834 8,400,876 8,820,920 9,261,966 9,725,064 <-- =F40*(1+$B$18)
Short-term borrowings
[balance sheet plug]
251,687 0 0 0 0 0
<-- =IF(G38>G40+SUM(G42:G46),G38-
G40-SUM(G42:G46),0)
Long-term indebtedness 2,826 2,826 2,826 2,826 2,826 2,826 <-- =F42
Other liabilities 126,126 126,126 126,126 126,126 126,126 126,126 <-- =F43
Shareholders' Equity
Stock 489,322 489,322 489,322 489,322 489,322 489,322
Accumulated retained earnings 521,834 585,807 646,865 709,962 775,863 844,684 <-- =F46+G74
Total Liabilities and Shareholders' Equit
y
9,011,637 8,129,786 8,529,828 8,949,872 9,390,918 9,854,016 <-- =SUM(G40:G44)
Income statements
2007 2008 2009 2010 2011
Interest income
Interest on cash balances 0 0 0 0 0 <-- =$B$3*(G26+F26)/2
Interest on other investment securities 96,965 58,570 58,881 58,968 58,808 <-- =$B$4*(G27+F27)/2
Interest on mortgage loans 1,541 1,541 1,541 1,541 1,541 <-- =$B$5*(G28+F28)/2
Interest on other earning assets 1,439 1,439 1,439 1,439 1,439 <-- =$B$6*(G29+F29)/2
Interest on net loans 530,235 562,049 595,772 631,519 669,410 <-- =$B$7*(G30+F30)/2
Total interest income 630,180 623,599 657,633 693,467 731,198 <-- =SUM(G52:G56)
Interest expense
Interest on deposits -280,829 -302,432 -335,195 -361,217 -389,003 <-- =-F9*G40
Interest on short-term borrowings 0 0 0 0 0 <-- =-$B$10*G41
Interest on long-term borrowing -180 -180 -180 -180 -180 <-- =-$B$11*G42
Total interest expense -281,010 -302,612 -335,375 -361,397 -389,183 <-- =SUM(G60:G62)
Net interest income 349,170 320,987 322,257 332,070 342,015 <-- =G57+G63
Provision for loan loss -18,138 -19,226 -20,380 -21,603 -22,899 <-- =-$B$13*(G30+F30)/2
Noninterest income 159,436 157,771 166,381 175,447 184,993 <-- =$B$14*G57
Noninterest expenses -244,419 -224,691 -225,580 -232,449 -239,411 <-- =-$B$15*G65
Depreciation and amortization -35,673 -39,636 -44,040 -48,934 -54,371 <-- =-$B$20*G33
Income before income tax 246,049 234,841 242,678 253,465 264,699 <-- =SUM(G65:G68)
Provision for income tax 86,117 82,194 84,937 88,713 92,645 <-- =$B$21*G70
Net income 159,932 152,646 157,741 164,753 172,054 <-- =G70-G71
Dividends 95,959 91,588 94,645 98,852 103,233 <-- =$B$22*G72
Retained earnings 63,973 61,059 63,096 65,901 68,822 <-- =G72-G73
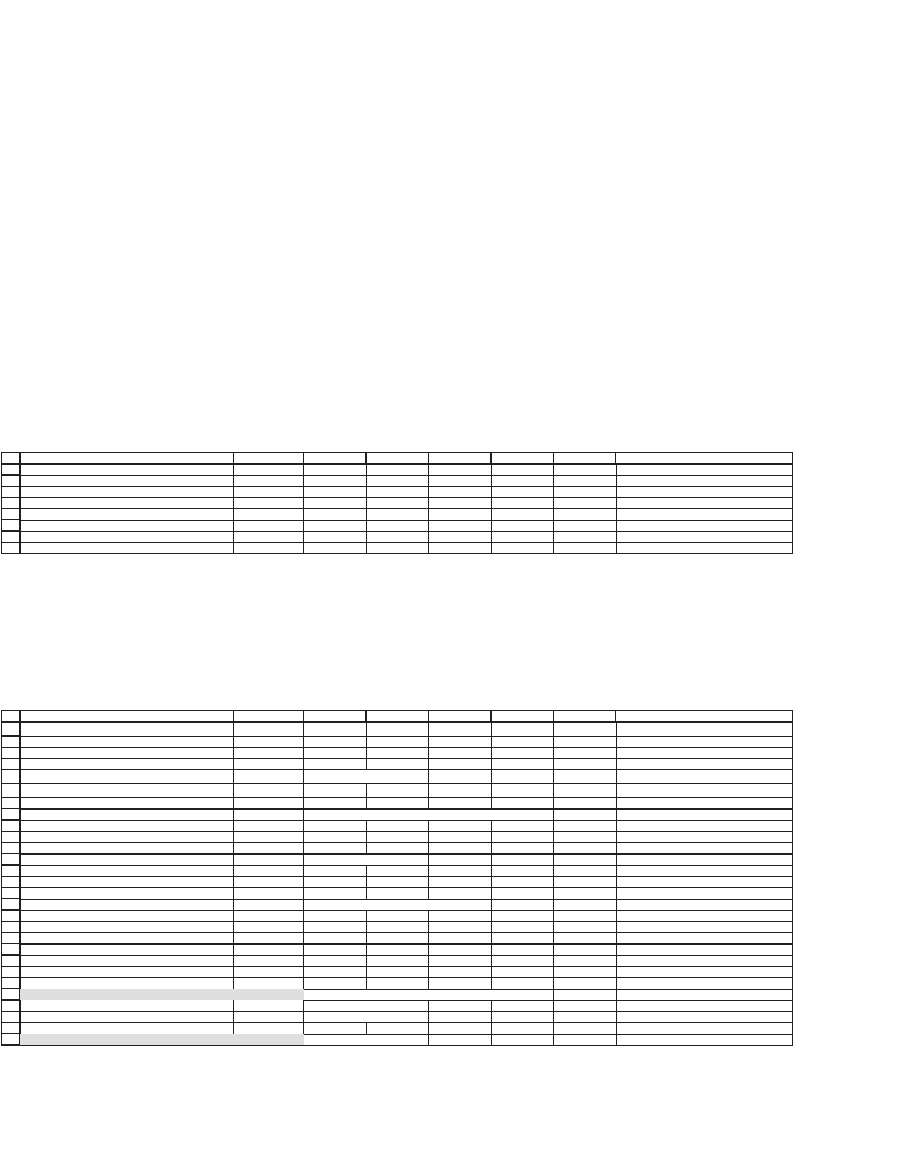
SMALL BANK
Pro forma model
191 Bank Valuation
The balance sheet model is similar to the model of section 3.7. There
are effectively two plugs:
•
Cash balances are determined by the assumption that Small Bank
requires balances of 5 percent of deposits in cash.
•
If the bank’s activities can be fi nanced by using balances of other secu-
rities (row 27), then these will be used.
•
If the bank’s activities require further fi nancing, then this will come
from short-term borrowing (row 41).
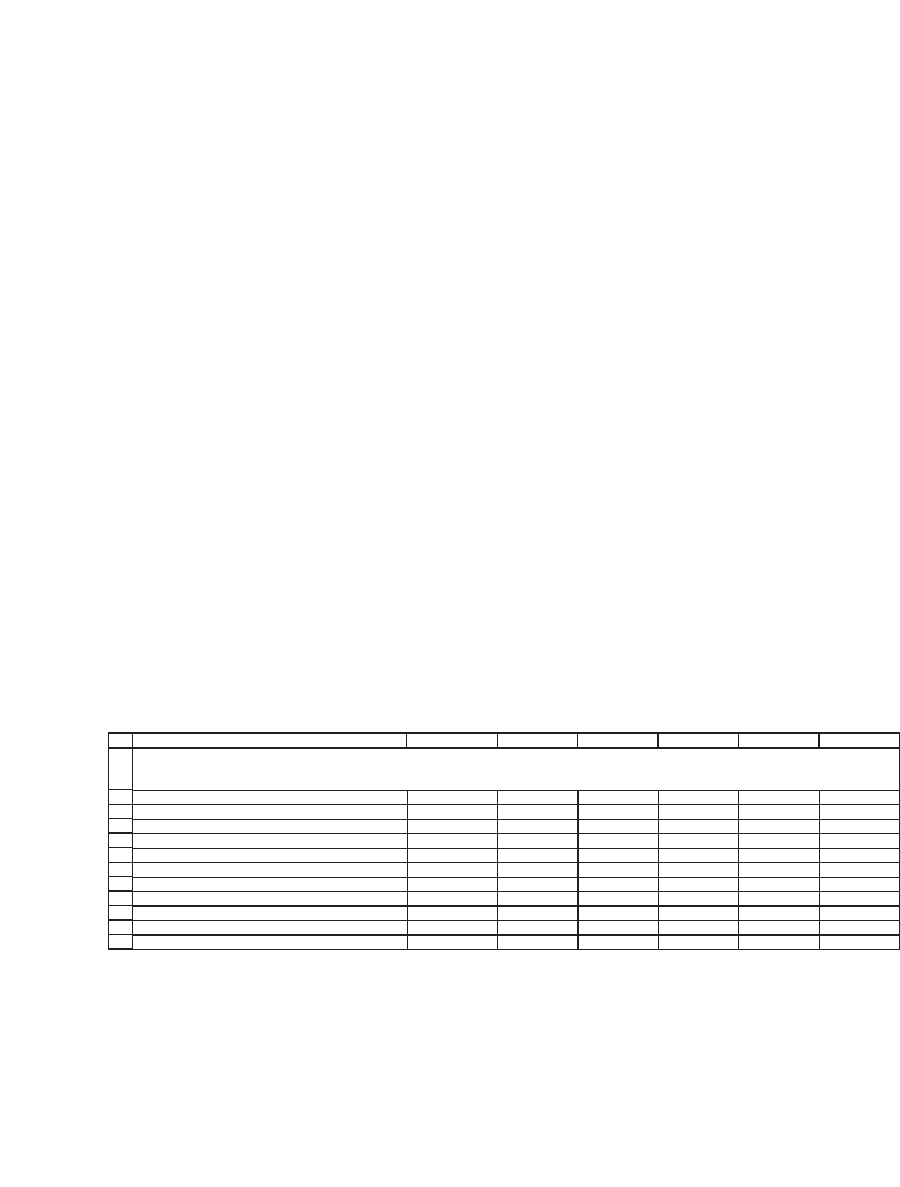
Given the pro formas, the analyst derived Small Bank’s anticipated
cash fl ows:
77
78
79
80
81
82
83
84
BACDEFHG
Free Cash Flow Calculations
2007 2008 2009 2010 2011
Profit after taxes 159,932 152,646 157,741 164,753 172,054 <-- =G72
Add back depreciation 35,673 39,636 44,040 48,934 54,371 <-- =-G69
Add back after-tax interest on permanent debt 117 117 117 117 117 <-- =-(1-$B$21)*G62
Changes in operating Net Working Capital
Subtract increases in Cash -13,210 -20,002 -21,002 -22,052 -23,155 <-- =F26-G26
Subtract increases in Fixed Assets at Cost -73,772 -39,636 -44,040 -48,934 -54,371 <-- =F33-G33
Free cash flow 108,740 132,761 136,856 142,817 149,016 <-- =SUM(G78:G83)
The β of Small Bank is estimated to be 0.9. Since Small Bank has very
little permanent debt, the analyst assumes that it is essentially an all-
equity fi rm. This assumption gives the following valuation:
85
86
87
88
89
90
91
92
93
94
95
96
97
98
99
100
101
102
103
104
105
106
107
108
109
110
111
112
BACDEFHG
Valuation of FCFs and terminal value
Equity beta 0.9
Risk-free rate 5.80%
Market risk premium 8.00%
Cost of equity, r
E
10.97% <-- =B87*(1-B21)+B86*B88
Cost of debt, r
D
6.38% <-- =B11
Current market value/share of Small Bank 51.00 <-- This is the current market value of Small Bank shares
Number of shares of Small Bank 32,406,000
Equity value 1,652,706,000 <-- =B92*B93
Debt value 128,952
Percentage of equity in capital structure 99.99% <-- =B94/(B94+B95)
Percentage of debt in capital structure 0.01% <-- =1-B96
Tax rate 35% <-- =B21
Discount rate, WACC 10.97% <-- =B89*B96+B97*(1-B98)*B90
Terminal growth rate of FCF 5.00%
2007 2008 2009 2010 2011
Free Cash Flow 112,401 136,423 140,517 146,479 152,678 <-- =G83
Terminal value 2,685,288 <-- =G104*(1+B101)/(B89-B101)
Total 112,401 136,423 140,517 146,479 2,837,966 <-- =G104+G105
Value of Small Bank 2,210,090,780 <-- =NPV(B100,C106:G106)*(1+B100)^0.5*1000
Long-term debt 128,952,000 <-- =B42*1000
Implied equity value 2,081,138,780 <-- =B108-B109
Number of Small Bank shares 32,406,000
Imputed per-share value of Small Bank 64.22 <-- =B110/B111
192 Chapter 5
Here are several comments about this valuation:
•
For generality, we have computed the WACC of Small Bank by taking
the weighted average of its market equity value (cell B94) and its debt
(B95). We could, of course, have just “eyeballed” the data and seen that
Small Bank is essentially an all-equity operation. Neither deposits nor
short-term debt are counted as debt for the purposes of computing the
WACC.
•
Because we have written Small Bank’s fi nancial statements in thou-
sands of dollars, we multiply the valuations in rows 108 and following by
1,000.
•
Although the current market value of a share of Small Bank is $51 (cell
B92), the value per share imputed by the Large Bank analyst is signifi -
cantly more (cell B112).
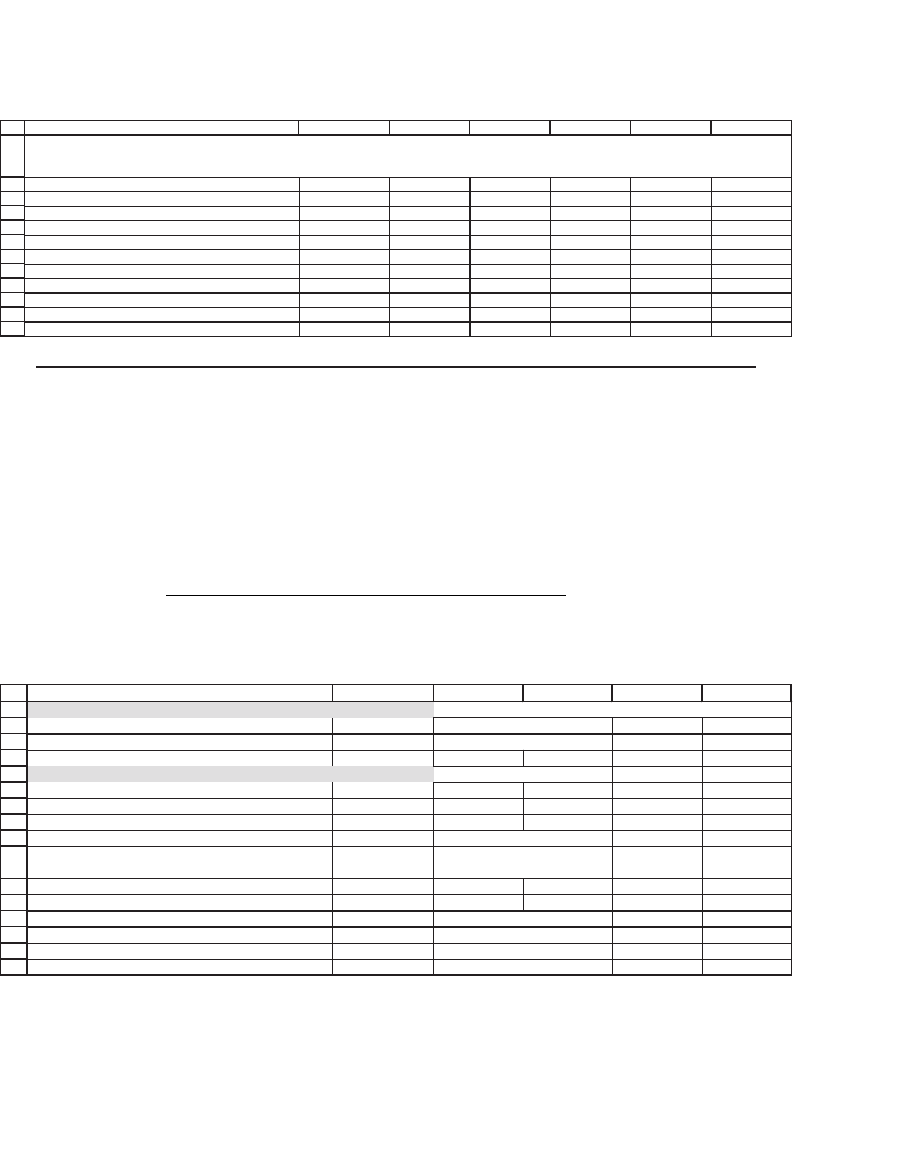
5.4.3 Sensitivity Analysis
By doing a Data|Table on the WACC and the long-term growth rate, the
Large Bank analyst can judge the sensitivity of the valuation on its two
main determinants:
126
127
128
129
130
131
132
133
134
135
136
137
BACDEF
Data table header: =B112 --> 64.22
0% 2% 3% 5% 6%
8.0% 43.85 51.36 56.54 72.08 84.54
8.5% 43.02 50.39 55.45 70.68 82.88
9.0%
42.22 49.43 54.39 69.31 81.26
9.5% 41.44 48.50 53.36 67.97 79.68
10.0% 40.67 47.59 52.35 66.66 78.14
10.5% 39.92 46.70 51.37 65.39 76.63
11.0% 39.19 45.83 50.41 64.15 75.16
11.5% 38.47 44.99 49.47 62.93 73.73
12.0% 37.78 44.16 48.55 61.75 72.33
Sensitivity analysis of Small Bank's value as function of its WACC and long-term growth
Noninterest expense as % of net interest income (cell B15): 70.00%
G
The effi ciency ratio is an important determinant of the valuation. If
Small Bank’s noninterest expense ratio can be reduced by a further 5
percent, then the valuation rises signifi cantly:
193 Bank Valuation
126
127
128
129
130
131
132
133
134
135
136
137
BACDEF
Data table header: =B112 --> 69.18
0% 2% 3% 5% 6%
8.0% 47.36 55.41 60.95 77.60 90.95
8.5% 46.48 54.36 59.79 76.10 89.17
9.0%
45.62 53.34 58.66 74.63 87.43
9.5% 44.78 52.34 57.55 73.20 85.74
10.0% 43.95 51.37 56.47 71.80 84.09
10.5% 43.15 50.41 55.41 70.43 82.47
11.0% 42.37 49.48 54.38 69.10 80.90
11.5% 41.60 48.58 53.38 67.80 79.36
12.0% 40.85 47.69 52.39 66.53 77.86
Sensitivity analysis of Small Bank's value as function of its WACC and long-term growth
Noninterest expense as % of net interest income (cell B15): 65.00%
G
5.5 Calculating the Exchange Ratio
At the time of the case, Large Bank had 294,330,960 shares worth $58
per share. Large Bank intended to do an exchange offer for Small Bank’s
shares, and the question about the proper exchange ratio was discussed.
Assuming that the pro forma valuation of Large Bank is correct, this
yields an exchange ratio of
x =
Calculated per-share valuation of Small Bank
Current market pric
ee per share of Large Bank
Doing these calculations yields the following:
108
109
110
111
112
113
114
115
116
117
118
119
120
121
122
123
BACDE
F
Value of Small Bank 2,210,090,780 <-- =NPV(B100,C106:G106)*(1+B100)^0.5*1000
Long-term debt 128,952,000 <-- =B42*1000
Implied equity value 2,081,138,780 <-- =B108-B109
Number of Small Bank shares 32,406,000
Imputed per-share value of Small Bank 64.22 <-- =B110/B111
Number of Large Bank shares 294,330,960
Value of Large Bank share 58.00
Market value of Large Bank equity, before merger 17,071,195,680 <-- =B115*B114
Exchange ratio (number of shares of Large Bank
offered per share of Small Bank
), x
1.11 <-- =B112/B115
Check
Number of shares, new entity 330,212,663 <-- =B114+B117*B111
Value of equity, new entity 19,152,334,460 <-- =B114*B115+B110
Total value of Large Bank ex-shareholders 17,071,195,680 <-- =B115*B114
Total value of Small Bank ex-shareholders 2,081,138,780 <-- =B115*B111*B117
The exchange ratio of 1.11 (cell B117) is the maximum exchange ratio
that Large Bank should offer for Small Bank. It could, of course, offer
less: There is plenty of negotiating room between the current market
value of Small Bank ($51 per share) and the imputed value from the

194 Chapter 5
FCF valuation of $64.22. For example, if Large Bank offers an exchange
ratio of 1, it is essentially valuing Small Bank at the same price as Large
Bank and thus still offering the Small Bank shareholders a premium of
$7 over their current market value.
5.6 Alternatives to Free Cash Flow Valuation of Financial Institutions
In the next two sections we show two variations on the bank valuation
model. The fi rst model assumes that the projected equity payouts of an
institution are determined by the necessity to reserve a percentage of
the retained earnings as reserves.
The second model assumes that the price/earnings (P/E) ratios are
used to value a bank acquisition. This is a common practice in the banking
industry.
5.7 Valuing a Bank by Using Capital Adequacy Ratios
An alternative way to value a bank is to back into the equity cash fl ows
by modeling the bank’s capital adequacy ratios.
3,4
Implementing this
approach determines the maximum payout to equity as a residual deter-
mined by capital adequacy requirements:
3. I am indebted to Hernán Burde for sharing this idea with me. Hernán suggested that
this particular form of bank valuation may be very appropriate to underbanked coun-
tries, where the growth rate of a fi nancial institution is essentially determined by a
bank’s ability to maintain its capital adequacy. I suspect this approach also works well
for many small banks in more sophisticated economies.
4. These valuations could be based either on BIS requirements or on a VaR approach.
Residual Approach to Bank Equity Cash Flow
Assets Liabilities
Cash and marketable securities Operating current liabilities—borrowed funds
Loan portfolio Debt
Net fi xed assets Equity
Total assets Total liabilities and equity
Next year’s equity =
Year-t equity
+% reserve against increase in loan portfolio
+% margin for business expansion, prudence, etc.
⇒ Determines maximum payout to equity
195 Bank Valuation
Here is a simple example:
1
2
3
4
5
6
7
8
9
10
11
12
13
14
15
16
17
18
19
20
21
22
23
24
25
26
27
28
29
BACDEF HG
Cash as percent of deposits 20%
Deposit growth 10%
Loan growth 12%
Interest paid on deposits 1%
Interest earned on loans 11%
Interest paid on borrowing 6%
General, selling, administrative expenses, growth 3%
Fixed assets at cost, growth 10%
Depreciation rate 8%
Equity as percentage of loans 15% <-- Capital adequacy ratio
Balance sheet
Assets
2006 2007 2008 2009 2010 2011
Cash 740,000 814,000 895,400 984,940 1,083,434 1,191,777
<-- =G24*$B$2
Loans
4,000,000 4,480,000 5,017,600 5,619,712 6,294,077 7,049,367
<-- =F16*(1+$B$4)
Fixed assets at cost 400,000 440,000 484,000 532,400 585,640 644,204 <-- =F18*(1+$B$9)
Depreciation 100,000 133,600 170,560 211,216 255,938 305,131 <-- =F19+$B$10*AVERAGE(F18:G18)
Net fixed assets 300,000 306,400 313,440 321,184 329,702 339,073 <-- =G18-G19
Total Assets 5,040,000 5,600,400 6,226,440 6,925,836 7,707,214 8,580,217 <-- =G20+G16+G15
Liabilities and equity
2006 2007 2008 2009 2010 2011
Deposits 3,700,000 4,070,000 4,477,000 4,924,700 5,417,170 5,958,887 <-- =F24*(1+$B$3)
Borrowing 700,000 858,400 996,800 1,158,179 1,345,932 1,563,925
<-- =IF(G21>G24+SUM(G26:G28),G21-G24-SUM(G26:G28),0)
Shareholders' equity
Stock 200,000 200,000 200,000 200,000 200,000 200,000
Accumulated retained earnings 440,000 472,000 552,640 642,957 744,112 857,405 <-- =$B$11*G16-G27
Total Liabilities and Shareholders' Equity 5,040,000 5,600,400 6,226,440 6,925,836 7,707,214 8,580,217 <-- =SUM(G24:G28)
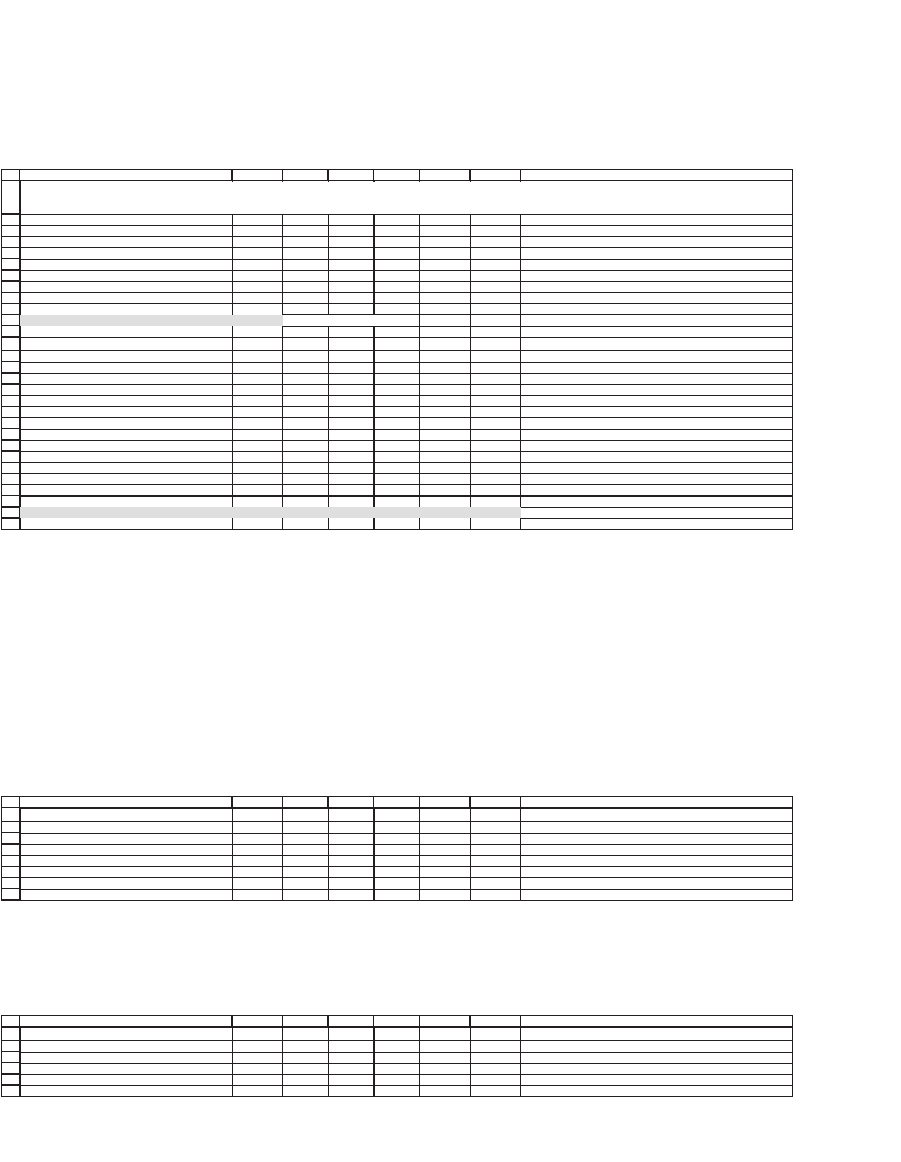
VALUING ROSARIO BANK
A model using residual equity cash flows
Rosario Bank is an all-equity bank that uses deposits and relatively
modest borrowing to fi nance substantial cash reserves and a growing
loan portfolio. The bank’s accumulated retained earnings are determined
by the necessity of maintaining a 15 percent ratio of equity to its loan
portfolio (highlighted row 28). Therefore, the bank’s borrowing is the
plug in the balance sheet model.
Rosario Bank pays little on its deposits and earns well on its loans. Its
income statement is as follows:
31
32
33
34
35
36
37
38
BACDEF HG
Income statement
2006
2007 2008 2009 2010 2011
Interest income 440,000 466,400 522,368 585,052 655,258 733,889 <-- =$B$6*AVERAGE(F16:G16)
Interest expense <--
Paid on deposits -37,000 -38,850 -42,735 -47,009 -51,709 -56,880 <-- =-$B$5*AVERAGE(F24:G24)
Paid on loans -42,000 -46,752 -55,656 -64,649 -75,123 -87,296 <-- =-$B$7*AVERAGE(F25:G25)
GSA expense -200,000 -200,000 -200,000 -200,000 -200,000 -200,000
Depreciation -30,000 -33,600 -36,960 -40,656 -44,722 -49,194
Net income 131,000 147,198 187,017 232,738 283,704 340,520 <-- =SUM(G32:G37)
Rosario Bank’s payouts to equity holders are determined by the
capital adequacy ratio:
40
41
42
43
44
45
BACDEF HG
Cash flow to equity
2007 2008 2009 2010 2011
Net income 147,198 187,017 232,738 283,704 340,520 <-- =G38
Add back depreciation 33,600 36,960 40,656 44,722 49,194 <-- =-G37
Free cash flow 180,798 223,977 273,394 328,426 389,713 <-- =SUM(G41:G42)
Subtract increase in accumulated retained earnings -32,000 -80,640 -90,317 -101,155 -113,293 <-- =F28-G28
Equity cash flow 329,596 367,314 456,472 555,697 666,133 <-- =SUM(G41:G44)
196 Chapter 5
We now use the model of Chapter 3: We value Rosario Bank by dis-
counting its equity cash fl ows at the cost of equity, modeling the terminal
value by using an estimated long-term equity cash fl ow growth rate:
47
48
49
50
51
52
53
54
55
56
BACDEF HG
Valuing Rosario Bank
Cost of equity, r
E
16.00%
Long-term equity cash flow growth 8.00%
2007 2008 2009 2010 2011
Equity cash flow 329,596 367,314 456,472 555,697 666,133 <-- =G45
Bank terminal value 8,992,802 <-- =G52*(1+B49)/(B48-B49)
Total equity cash flow + terminal value 329,596 367,314 456,472 555,697 9,658,935 <-- =SUM(G52:G53)
Valuation, using midyear discounting 6,198,542 <-- =NPV(B48,C54:G54)*(1+B48)^0.5
5.8 Using P/Es to Value a Bank Acquisition: First Federal Savings Bank
We fi nish this chapter with a minicase that illustrates yet another approach
to bank valuation. This time we use P/E ratios to value a bank.
5
Here’s the story: Your client, Fairmont National Bank, a $750 million
community bank in Fairmont, West Virginia, has received an invitation
to bid competitively to acquire First Federal Savings Bank, 20 miles away
in Clarksburg, West Virginia. The invitation was sent out by First Feder-
al’s investment banker. Fairmont National has asked your fi rm to assist
them in bidding for First Federal. Your assistance would include
•
Evaluating First Federal as an acquisition considering Fairmont Nation-
al’s objectives.
•
Predicting the actions of other potential bidders including Clarksburg
National Bank, about the same size as Fairmont National, but headquar-
tered 20 miles away, and a likely bidder.
•
Preparing the client’s bid including the price (i.e., the fi nancial consid-
eration) and a list of social undertakings (the nonfi nancial consideration)
including the probable number of First Federal’s employees who would
be terminated after the acquisition and the amount of termination com-
pensation they would receive.
5. I want to thank David Martin and Jon Holtaway of Danielson Associates for helping
me with this case.

197 Bank Valuation
5.8.1 Fairmont National Bank
Your client is a better-than-average performer, but it wasn’t always. Ten
years ago it was a poor performer: expenses were too high, fee income
was too low, and it was relatively underlent—all measured in terms of
its peers. After a change in management, Fairmont National began to
improve steadily by controlling expenses more effectively, adjusting its
fee schedules, and focusing more management attention on lending. But
for the past two years, earnings have been fl at, and loan growth has
slowed. Meanwhile, equity has been growing in relation to assets, causing
Fairmont’s return on equity to fall slightly.
Fairmont’s management concluded that it could no longer grow the
bank’s earnings by fi xing its problems—it had to expand either by
opening branches or by acquiring another bank. De novo branch open-
ings offer a very slow payback, and in an industry that is already over-
banked and overbranched, it usually makes more sense to acquire a bank
and eliminate a competitor than to open a branch and add a competitor.
Consequently, when Fairmont management heard about the opportunity
to acquire First Federal, they were enthusiastic and determined to bid
aggressively but sensibly. “Aggressively but sensibly” means they wanted
to win and would be willing to suffer a short-term fi nancial setback if it
promised to pay off in the longer term. They hired you, their investment
banker, to advise them on bidding for First Federal.
5.8.2 First Federal Savings Bank
First Federal is a traditional thrift. That is, it was organized under laws
that effectively limited it to residential mortgage lending. Traditionally,
thrifts funded their residential lending with passbook savings and certifi -
cates of deposit, and as passbook savings became a smaller and smaller
part of thrifts’ funding, their net interest margins grew very thin. In
recent years, thrifts have been permitted to engage in virtually every
business permitted to commercial banks, but most have found it diffi cult
to develop the more profi table business enjoyed by commercial banks.
The fi nancial comparison of First Federal, Fairmont, and Clarksburg
National Bank shows the typical differences between banks and thrifts.
First Federal’s board and executives had felt they could “commercial-
ize” the thrift, but they found the process was slow and began to doubt
that they had the management to succeed. They felt, after talking with