Tan S.T. Finite Mathematics for the Managerial, Life, and Social Sciences
Подождите немного. Документ загружается.

1. a. We use Formula (14) with n 4, p .2, and q
1 .2 .8, obtaining
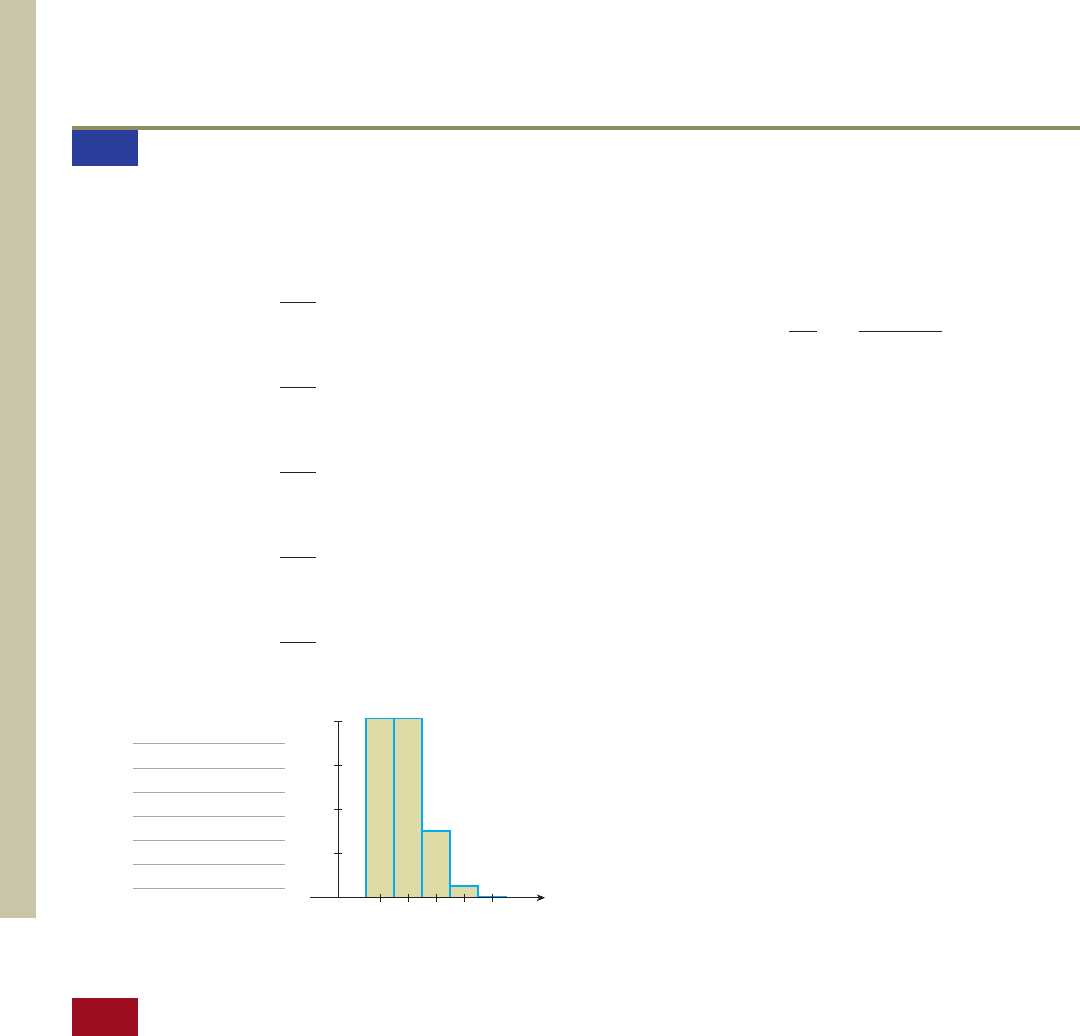
b. The required binomial distribution and histogram are as
follows:
xP(X x)
0 .410
1 .410
2 .154
3 .026
4 .002
4!
4! 0!
1.22
4
#
1 ⬇ .002
P
1X 42 C 14, 42 1.22
4
1.82
0
4!
3! 1!
1.22
3
1.82⬇ .026
P
1X 32 C 14, 32 1.22
3
1.82
1
4!
2! 2!
1.22
2
1.82
2
⬇ .154
P
1X 22 C 14, 22 1.22
2
1.82
2
4!
1! 3!
1.22 1.82
3
⬇ .410
P
1X 12 C 14, 12 1.22
1
1.82
3
4!
0! 4!
#
1
#
1.82
4
⬇ .410
P
1X 02 C 14, 02 1.22
0
1.82
4
c. The mean is
E(X ) np (4)(.2)
0.8
and the standard deviation is
2. This is a binomial experiment with n 10, p .6, and
q .4. Let X denote the number of households that have
microwave ovens. Then, the probability that five or fewer
households have microwave ovens is given by
P(X 0) P(X 1) P(X 2) P(X 3)
P(X 4) P(X 5)
C(10, 0)(.6)
0
(.4)
10
C(10, 1)(.6)
1
(.4)
9
C(10, 2)(.6)
2
(.4)
8
C(10, 3)(.6)
3
(.4)
7
C(10, 4)(.6)
4
(.4)
6
C(10, 5)(.6)
5
(.4)
5
⬇ 0 .002 .011 .042 .111 .201
⬇ .367
0.8
s 1npq
1142 1.22 1.82
462 8 PROBABILITY DISTRIBUTIONS AND STATISTICS
8.4 Solutions to Self-Check Exercises
01234
.4
.3
.2
.1
x
8.5 The Normal Distribution
Probability Density Functions
The probability distributions discussed in the preceding sections were all associated
with finite random variables—that is, random variables that take on finitely many val-
ues. Such probability distributions are referred to as finite probability distributions. In
this section, we consider probability distributions associated with a continuous ran-
dom variable—that is, a random variable that may take on any value lying in an inter-
val of real numbers. Such probability distributions are called continuous probability
distributions.
Unlike a finite probability distribution, which may be exhibited in the form of a
table, a continuous probability distribution is defined by a function f whose domain
coincides with the interval of values taken on by the random variable associated with
the experiment. Such a function f is called the probability density function associ-
ated with the probability distribution, and it has the following properties:
1. f(x) is nonnegative for all values of x in its domain.
2. The area of the region between the graph of f and the x-axis is equal to 1 (Figure 13).
87533_08_ch8_p417-482 1/30/08 10:09 AM Page 462
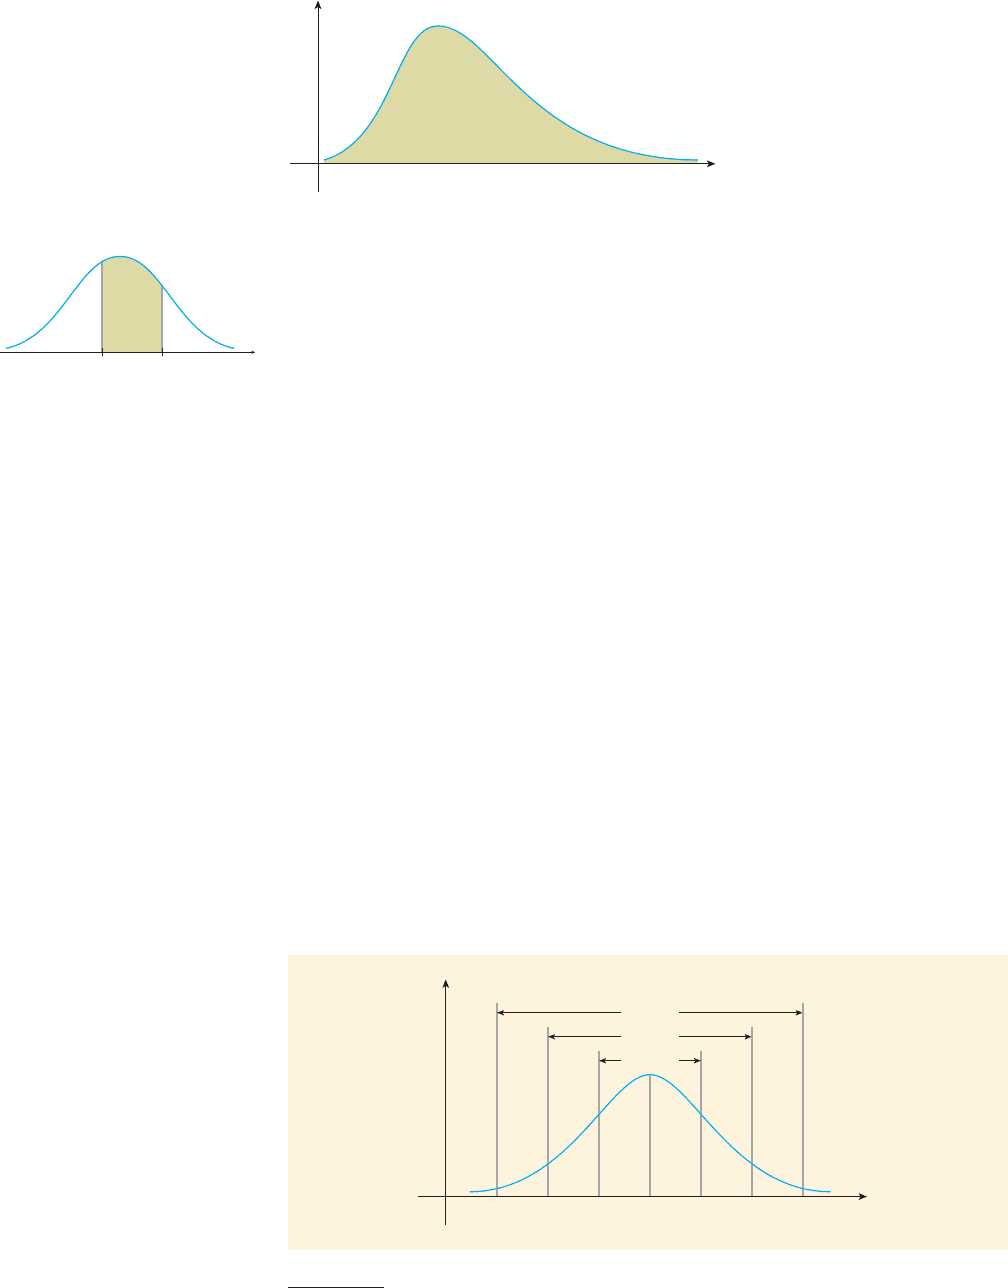
Now suppose we are given a continuous probability distribution defined by a
probability density function f. Then, the probability that the random variable X
assumes a value in an interval a x b is given by the area of the region between
the graph of f and the x-axis from x a to x b (Figure 14). We denote the value of
this probability by P(a X b).* Observe that property 2 of the probability density
function states that the probability that a continuous random variable takes on a value
lying in its range is 1, a certainty, which is expected. Note the analogy between the
areas under the probability density curves and the areas of the histograms associated
with finite probability distributions (see Section 8.1).
Normal Distributions
The mean and the standard deviation of a continuous probability distribution have
roughly the same meanings as the mean and standard deviation of a finite probability
distribution. Thus, the mean of a continuous probability distribution is a measure of
the central tendency of the probability distribution, and the standard deviation of the
probability distribution measures its spread about its mean. Both of these numbers will
play an important role in the following discussion.
For the remainder of this section, we will discuss a special class of continuous prob-
ability distributions known as normal distributions. Normal distributions are without a
doubt the most important of all the probability distributions. Many phenomena—such as
the heights of people in a given population, the weights of newborn infants, the IQs of
college students, the actual weights of 16-ounce packages of cereals, and so on—have
probability distributions that are normal. The normal distribution also provides us with
an accurate approximation to the distributions of many random variables associated with
random-sampling problems. In fact, in the next section we will see how a normal distri-
bution may be used to approximate a binomial distribution under certain conditions.
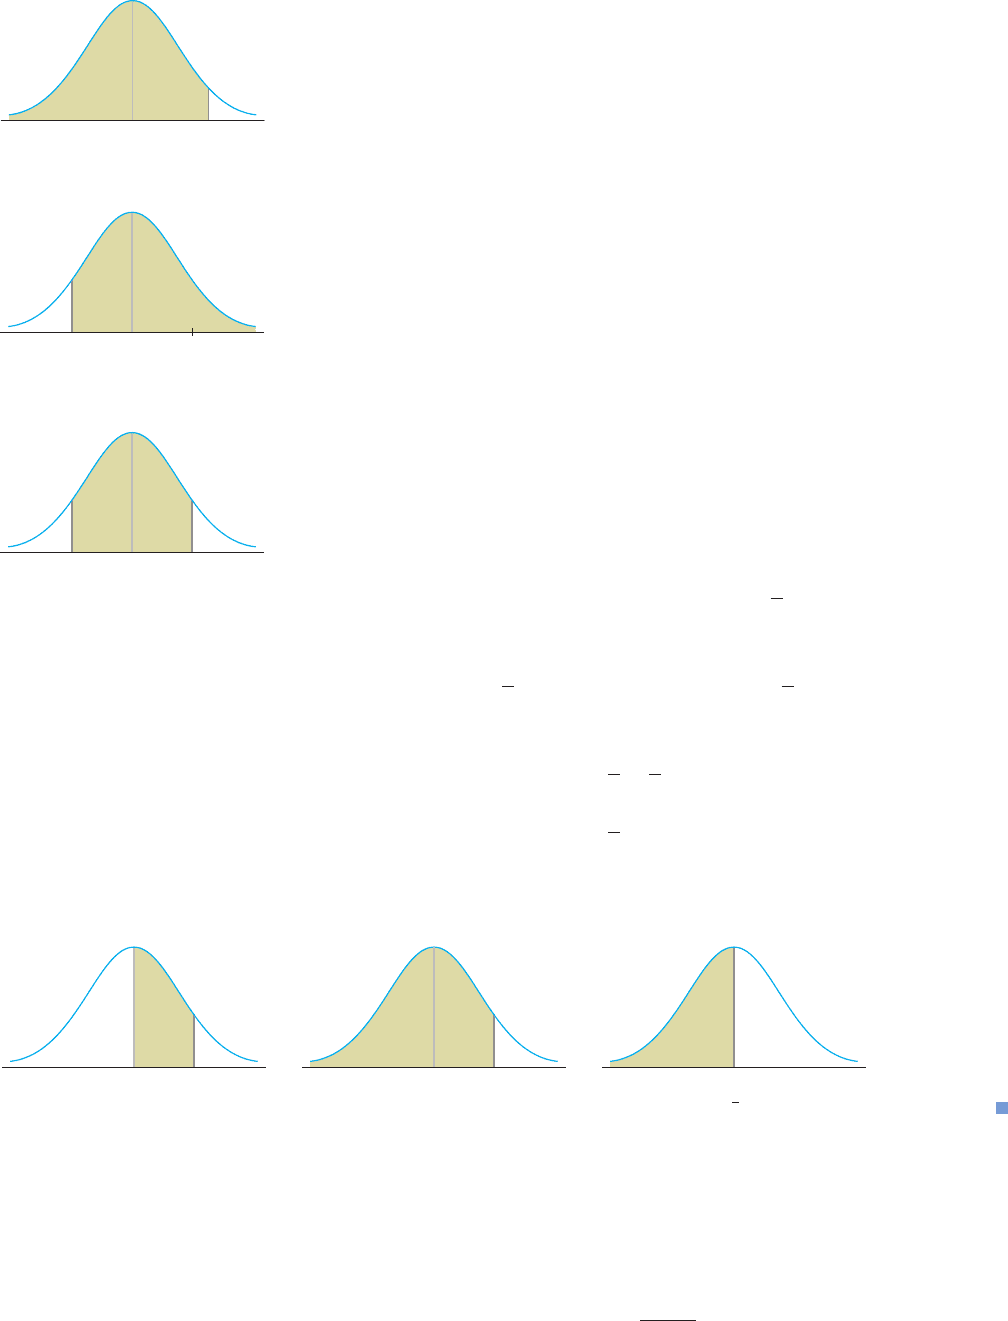
The graph of a normal distribution, which is bell shaped, is called a normal curve
(Figure 15).
x
y
68.27%
95.45%
99.73%
+
− 3
−
− 2
+ 2
+ 3
x
y
y = f (x
)
Area equals 1
8.5 THE NORMAL DISTRIBUTION 463
FIGURE 13
A probability density function
x
f (x
)
a b
FIGURE 14
P(a X b) is given by the area of the
shaded region.
*Because the area under one point of the graph of f is equal to zero, we see that P(a X b) P(a X b)
P(a X b) P(a X b).
FIGURE 15
A normal curve
87533_08_ch8_p417-482 1/30/08 10:09 AM Page 463
The normal curve (and therefore the corresponding normal distribution) is
completely determined by its mean and standard deviation . In fact, the normal
curve has the following characteristics, which are described in terms of these two
parameters.*
1. The curve has a peak at x .
2. The curve is symmetric with respect to the vertical line x .
3. The curve always lies above the x-axis but approaches the x-axis as x extends indef-
initely in either direction.
4. The area under the curve is 1.
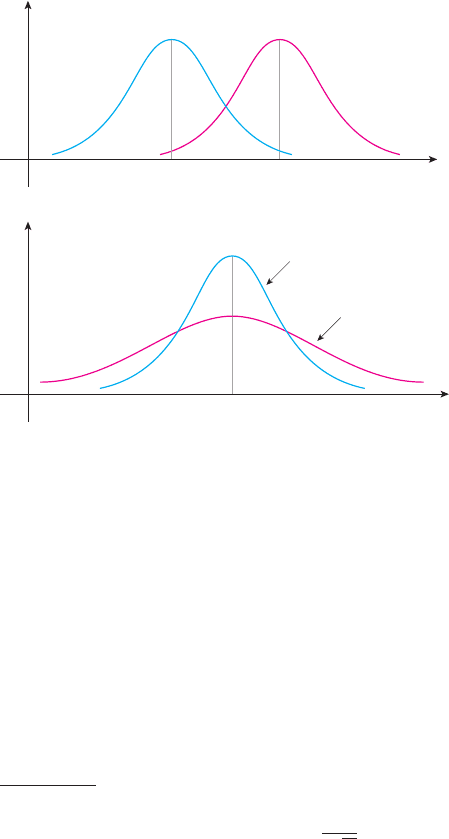
5. For any normal curve, 68.27% of the area under the curve lies within 1 standard
deviation of the mean (that is, between and ), 95.45% of the area lies
within 2 standard deviations of the mean, and 99.73% of the area lies within 3 stan-
dard deviations of the mean.
Figure 16 shows two normal curves with different means
1
and
2
but the same
standard deviation. Next, Figure 17 shows two normal curves with the same mean but
different standard deviations
1
and
2
. (Which number is smaller?)
The mean of a normal distribution determines where the center of the curve is
located, whereas the standard deviation of a normal distribution determines the
peakedness (or flatness) of the curve.
As this discussion reveals, there are infinitely many normal curves corresponding
to different choices of the parameters and that characterize such curves. Fortu-
nately, any normal curve may be transformed into any other normal curve (as we will
see later), so in the study of normal curves it suffices to single out one such particular
curve for special attention. The normal curve with mean 0 and standard deviation
1 is called the standard normal curve. The corresponding distribution is called
the standard normal distribution. The random variable itself is called the standard
normal random variable and is commonly denoted by Z.
x
y
2
1
x
y
12
464 8 PROBABILITY DISTRIBUTIONS AND STATISTICS
*The probability density function associated with this normal curve is given by
but the direct use of this formula will not be required in our discussion of the normal distribution.
y
1
s 12p
e
11/2231xm2/s4
2
FIGURE 16
Two normal curves that have the same
standard deviation but different means
FIGURE 17
Two normal curves that have the same
mean but different standard deviations
87533_08_ch8_p417-482 1/30/08 10:09 AM Page 464
8.5 THE NORMAL DISTRIBUTION 465
Computations of Probabilities Associated
with Normal Distributions
Areas under the standard normal curve have been extensively computed and tabulated.
Table 2, Appendix D, gives the areas of the regions under the standard normal curve to
the left of the number z; these areas correspond, of course, to probabilities of the form
P(Z z) or P(Z z). The next several examples illustrate the use of this table in com-
putations involving the probabilities associated with the standard normal variable.
EXAMPLE 1
Let Z be the standard normal variable. Make a sketch of the appro-
priate region under the standard normal curve, and then find the values of
a. P(Z 1.24) b. P(Z 0.5)
c. P(0.24 Z 1.48) d. P(1.65 Z 2.02)
Solution
a. The region under the standard normal curve associated with the probability
P(Z 1.24) is shown in Figure 18. To find the area of the required region using
Table 2, Appendix D, we first locate the number 1.2 in the column and the num-
ber 0.04 in the row, both headed by z, and read off the number 0.8925 appearing
in the body of the table. Thus,
P(Z 1.24) .8925
b. The region under the standard normal curve associated with the probability
P(Z 0.5) is shown in Figure 19a. Observe, however, that the required area is,
by virtue of the symmetry of the standard normal curve, equal to the shaded area
shown in Figure 19b. Thus,
P(Z 0.5) P(Z 0.5)
.3085
(a) P(Z 0.5) (b) P(Z 0.5)
0.50
–
0.5
0
0
1.24
FIGURE 18
P(Z 1.24)
Exploring with
TECHNOLOGY
Consider the probability density function
which is the formula given in the footnote on page 464 with 0 and 1.
1. Use a graphing utility to plot the graph of f, using the viewing window
[4, 4] [0, 0.5].
2. Use the numerical integration function of a graphing utility to find the area
of the region under the graph of f on the intervals [1, 1], [2, 2], and
[3, 3], thereby verifying property 5 of normal distributions for the special
case where 0 and 1.
f
1x2
1
12p
e
x
2
/2
FIGURE 19
87533_08_ch8_p417-482 1/30/08 10:09 AM Page 465

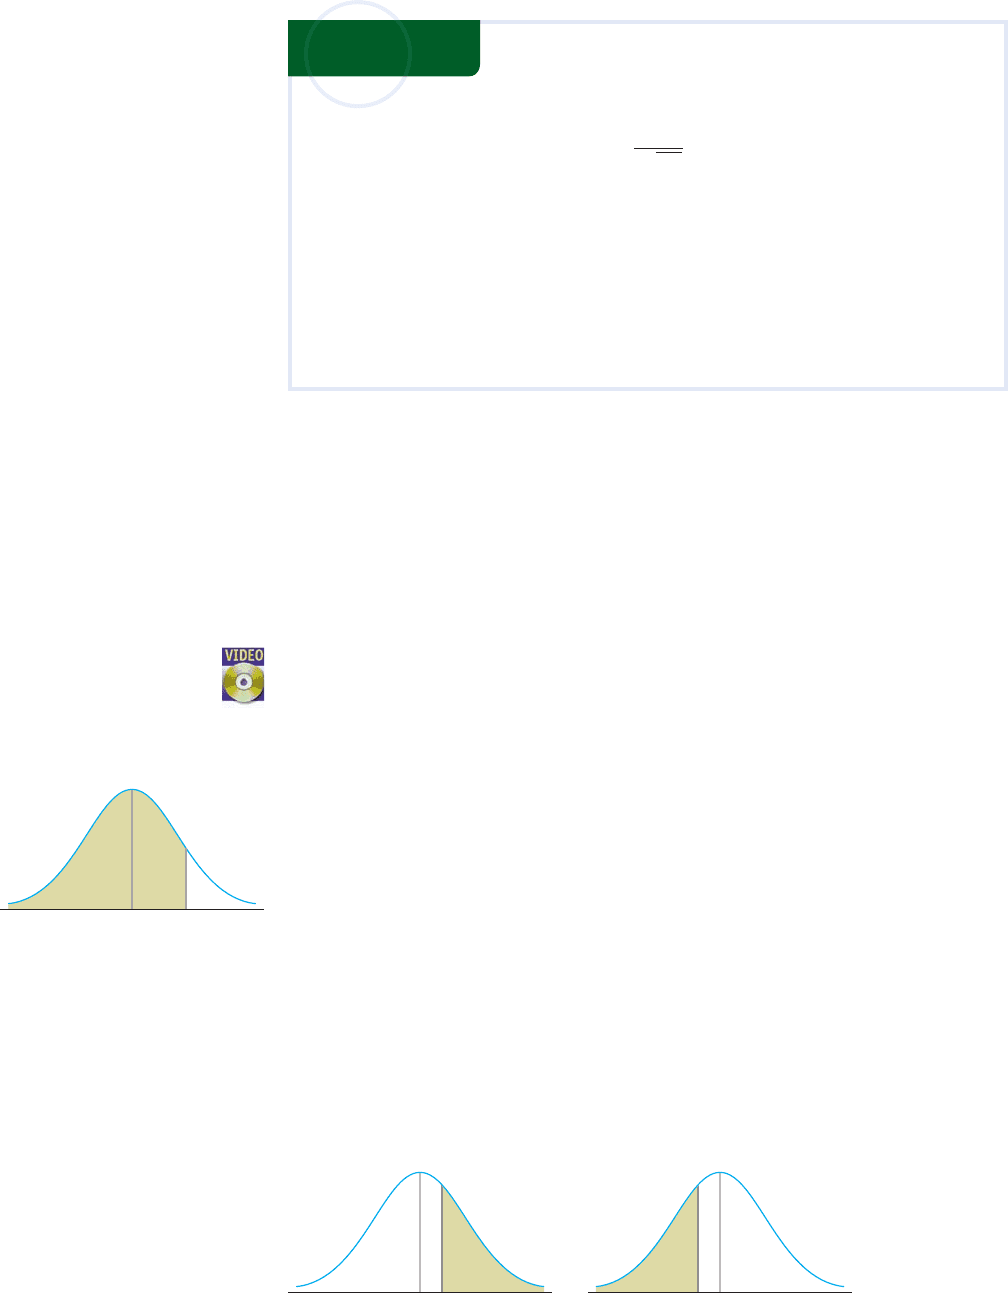
c. The probability P(0.24 Z 1.48) is equal to the shaded area shown in
Figure 20. This area is obtained by subtracting the area under the curve to the
left of z 0.24 from the area under the curve to the left of z 1.48; that is
P(0.24 Z 1.48) P(Z 1.48) P(Z 0.24)
.9306 .5948
.3358
d. The probability P(1.65 Z 2.02) is given by the shaded area shown in
Figure 21. We have
P(1.65 Z 2.02) P(Z 2.02) P(Z 1.65)
.9783 .0495
.9288
466 8 PROBABILITY DISTRIBUTIONS AND STATISTICS
1.480
0.24
FIGURE 20
P(0.24 Z 1.48)
2.020
–1.65
FIGURE 21
P(1.65 Z 2.02)
Exploring with
TECHNOLOGY
We can calculate the areas under the standard normal curve using the function
normalcdf(. This will give a more accurate value than one obtained from the
table. To call the function, press , then select 2:normal cdf(.
For example, to compute P(0.24 Z 1.48) enter
normalcdf(.24,1.48).
The TI-83/84 screen is shown in Figure 22. The answer (to three decimal places)
agrees with the result obtained in Example 1c.
FIGURE 22
To find P(Z 1.24), we write P(Z 1.24) .5 P(0 Z 1.24) and enter
.5+normalcdf(0,1.24)
The TI-83/84 screen is shown in Figure 23. The answer agrees with the result
obtained in Example 1a.
FIGURE 23
VARS
2nd
normalcdf(.24,1.
48)
.3357285187
.5+normalcdf(0,1
.24)
.8925122375
87533_08_ch8_p417-482 1/30/08 10:09 AM Page 466
EXAMPLE 2
Let Z be the standard normal random variable. Find the value of z if z
satisfies
a. P(Z z) .9474 b. P(Z z) .9115 c. P(z Z z) .7888
Solution
a. Refer to Figure 24. We want the value of Z such that the area of the region under
the standard normal curve and to the left of Z z is .9474. Locating the number
.9474 in Table 2, Appendix D, and reading back, we find that z 1.62.
b. Since P(Z z), or equivalently, the area of the region to the right of z is greater
than 0.5, it follows that z must be negative (Figure 25); hence z is positive. Fur-
thermore, the area of the region to the right of z is the same as the area of the
region to the left of z. Therefore,
P(Z z) P(Z z)
.9115
Looking up the table, we find z 1.35 and so z 1.35.
c. The region associated with P(z Z z) is shown in Figure 26. Observe that,
by symmetry, the area of this region is just double that of the area of the region
between Z 0 and Z z; that is,
Furthermore,
(Figure 27). Therefore,
or, solving for P(Z z),
Consulting the table, we find z 1.25.
We now turn our attention to the computation of probabilities associated with normal
distributions whose means and standard deviations are not necessarily equal to 0 and
1, respectively. As mentioned earlier, any normal curve may be transformed into the
standard normal curve. In particular, it may be shown that if X is a normal random
variable with mean and standard deviation , then it can be transformed into the
standard normal random variable Z by means of the substitution
Z
X m
s
.8944
1
2
11 .78882
P 1Z z 2
1
2
1
2
P 1z Z z2
1
2
P 1z Z z2 P 1Z z2
1
2
P 10 Z z2 P 1Z z2
1
2
P 1z Z z2 2P 10 Z z2
8.5 THE NORMAL DISTRIBUTION 467
z
0
.9474
FIGURE 24
P(Z z) .9474
z
0
.9115
– z
FIGURE 25
P(Z z) .9115
z
0
.7888
– z
FIGURE 26
P(z Z z) .7888
z0– z z0– z z0– z
P(0 < Z < z) P(Z < z)
1
2
=
–
FIGURE 27
87533_08_ch8_p417-482 1/30/08 10:09 AM Page 467
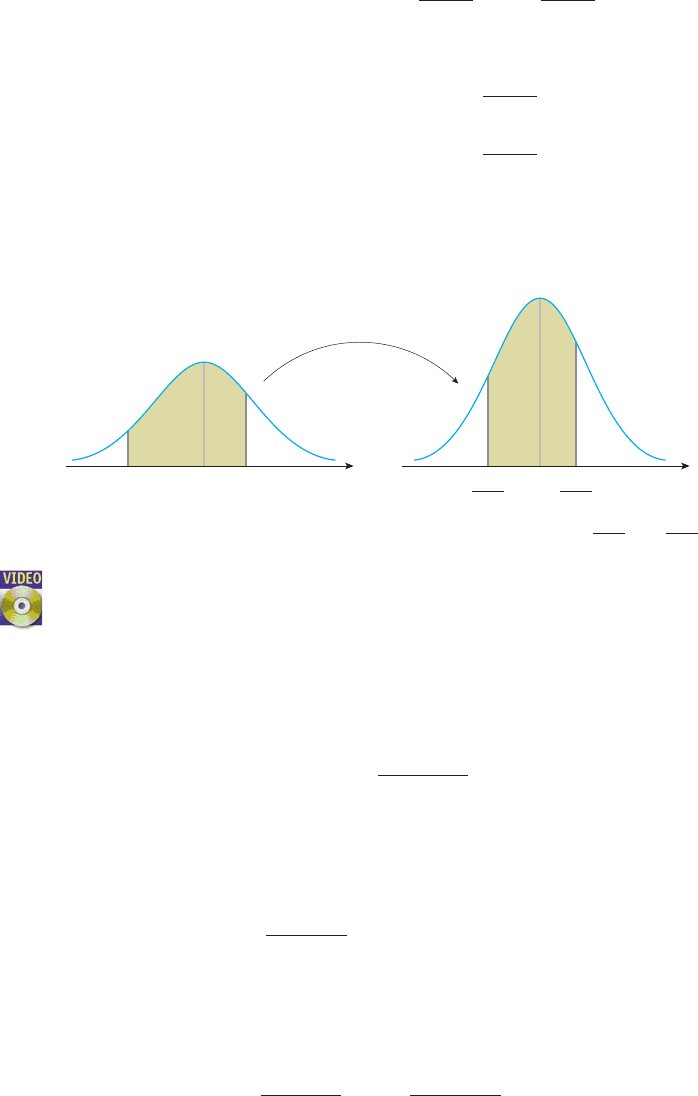
The area of the region under the normal curve (with random variable X) between
x a and x b is equal to the area of the region under the standard normal curve
between z (a )/ and z (b )/. In terms of probabilities associated with
these distributions, we have
(16)
(Figure 28). Similarly, we have
(17)
(18)
Thus, with the help of Equations (16)–(18), computations of probabilities associated
with any normal distribution may be reduced to the computations of areas of regions
under the standard normal curve.
EXAMPLE 3
Suppose X is a normal random variable with 100 and 20.
Find the values of
a. P(X 120) b. P(X 70) c. P(75 X 110)
Solution
a. Using Formula (17) with 100, 20, and b 120, we have
b. Using Formula (18) with 100, 20, and a 70, we have
Use the table of values of
Z
.
c. Using Formula (16) with 100, 20, a 75, and b 110, we have
.6915 .1056 .5859
P 1Z 0.52 P 1Z 1.252
P 11.25 Z 0.52
P a
75 100
20
Z
110 100
20
b
P 175 X 1102
P 1Z 1.52 P 1Z 1.52 .9332
P aZ
70 100
20
b
P 1X 702
P 1Z 12 .8413
P 1X 120 2 P aZ
120 100
20
b
ba
x
0
z
Nonstandard normal curve
Standard normal curve
Area under the curve between a and b Area under the curve between
and
=
a −
b −
a − b −
P 1X a2 P aZ
a m
s
b
P 1X b2 P aZ
b m
s
b
P 1a X b2 P a
a m
s
Z
b m
s
b
468 8 PROBABILITY DISTRIBUTIONS AND STATISTICS
FIGURE 28
Use the table of values of
Z
.
See Figure 29.
Use the table of values of
Z
.
87533_08_ch8_p417-482 1/30/08 10:09 AM Page 468
8.5 THE NORMAL DISTRIBUTION 469
FIGURE 29
1. Let Z be a standard normal variable.
a. Find the value of P(1.2 Z 2.1) by first making a
sketch of the appropriate region under the standard nor-
mal curve.
b. Find the value of z if z satisfies P(z Z z) .8764.
2. Let X be a normal random variable with 80 and
10. Find the values of
a. P(X 100) b. P(X 60) c. P(70 X 90)
Solutions to Self-Check Exercises 8.5 can be found on
page 470.
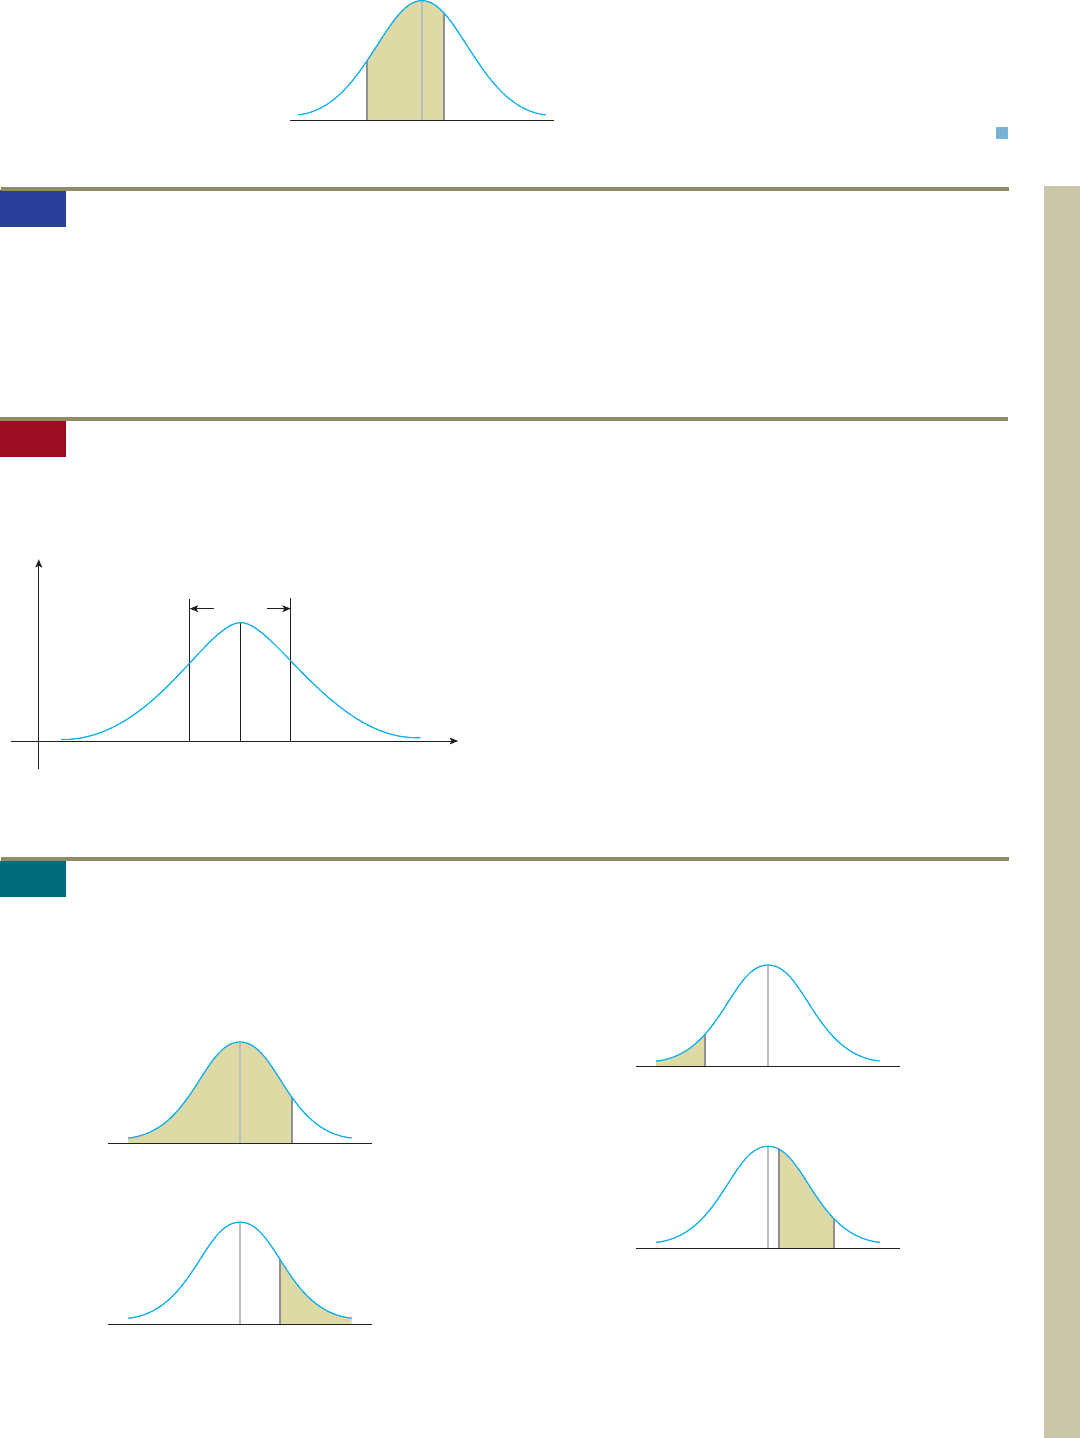
1. Consider the following normal curve with mean and
standard deviation :
x
68.27%
y
a. What is the x-coordinate of the peak of the curve?
b. What can you say about the symmetry of the curve?
c. Does the curve always lie above the x-axis? What hap-
pens to the curve as x extends indefinitely to the left or
right?
d. What is the value of the area under the curve?
e. Between what values does 68.27% of the area under the
curve lie?
2. a. What is the difference between a normal curve and a
standard normal curve?
b. If X is a normal random variable with mean and stan-
dard deviation , write P(a X b) in terms of the prob-
abilities associated with the standard normal random
variable Z.
–1.25 0.5
0
8.5 Exercises
8.5 Self-Check Exercises
8.5 Concept Questions
In Exercises 1–6, find the value of the probability of the
standard normal variable Z corresponding to the shaded
area under the standard normal curve.
1. P(Z 1.45)
2. P(Z 1.11)
.11
1
1.45
3. P(Z 1.75)
4. P(0.3 Z 1.83)
0.3
1.83
–1.75
87533_08_ch8_p417-482 1/30/08 10:09 AM Page 469
5. P(1.32 Z 1.74)
6. P(2.35 Z 0.51)
In Exercises 7–14, (a) make a sketch of the area under the
standard normal curve corresponding to the probability
and (b) find the value of the probability of the standard
normal random variable Z corresponding to this area.
7. P(Z 1.37) 8. P(Z 2.24)
9. P(Z 0.65) 10. P(0.45 Z 1.75)
– 2.35
–
0.51
–1.32
1.74
11. P(Z 1.25) 12. P(1.48 Z 1.54)
13. P(0.68 Z 2.02) 14. P(1.41 Z 0.24)
15. Let Z be the standard normal variable. Find the values of z
if z satisfies
a. P(Z z) .8907 b. P(Z z) .2090
16. Let Z be the standard normal variable. Find the values of z
if z satisfies
a. P(Z z) .9678 b. P(z Z z) .8354
17. Let Z be the standard normal variable. Find the values of z
if z satisfies
a. P(Z z)
.9713 b. P(Z z) .9713
18. Suppose X is a normal random variable with 380 and
20. Find the value of
a. P(X 405) b. P(400 X 430) c. P(X 400)
19. Suppose X is a normal random variable with 50 and
5. Find the value of
a. P(X 60) b. P(X 43) c. P(46 X 58)
20. Suppose X is a normal random variable with 500 and
75. Find the value of
a. P(X 750) b. P(X 350) c. P(400 X 600)
470
8 PROBABILITY DISTRIBUTIONS AND STATISTICS
8.5 Solutions to Self-Check Exercises
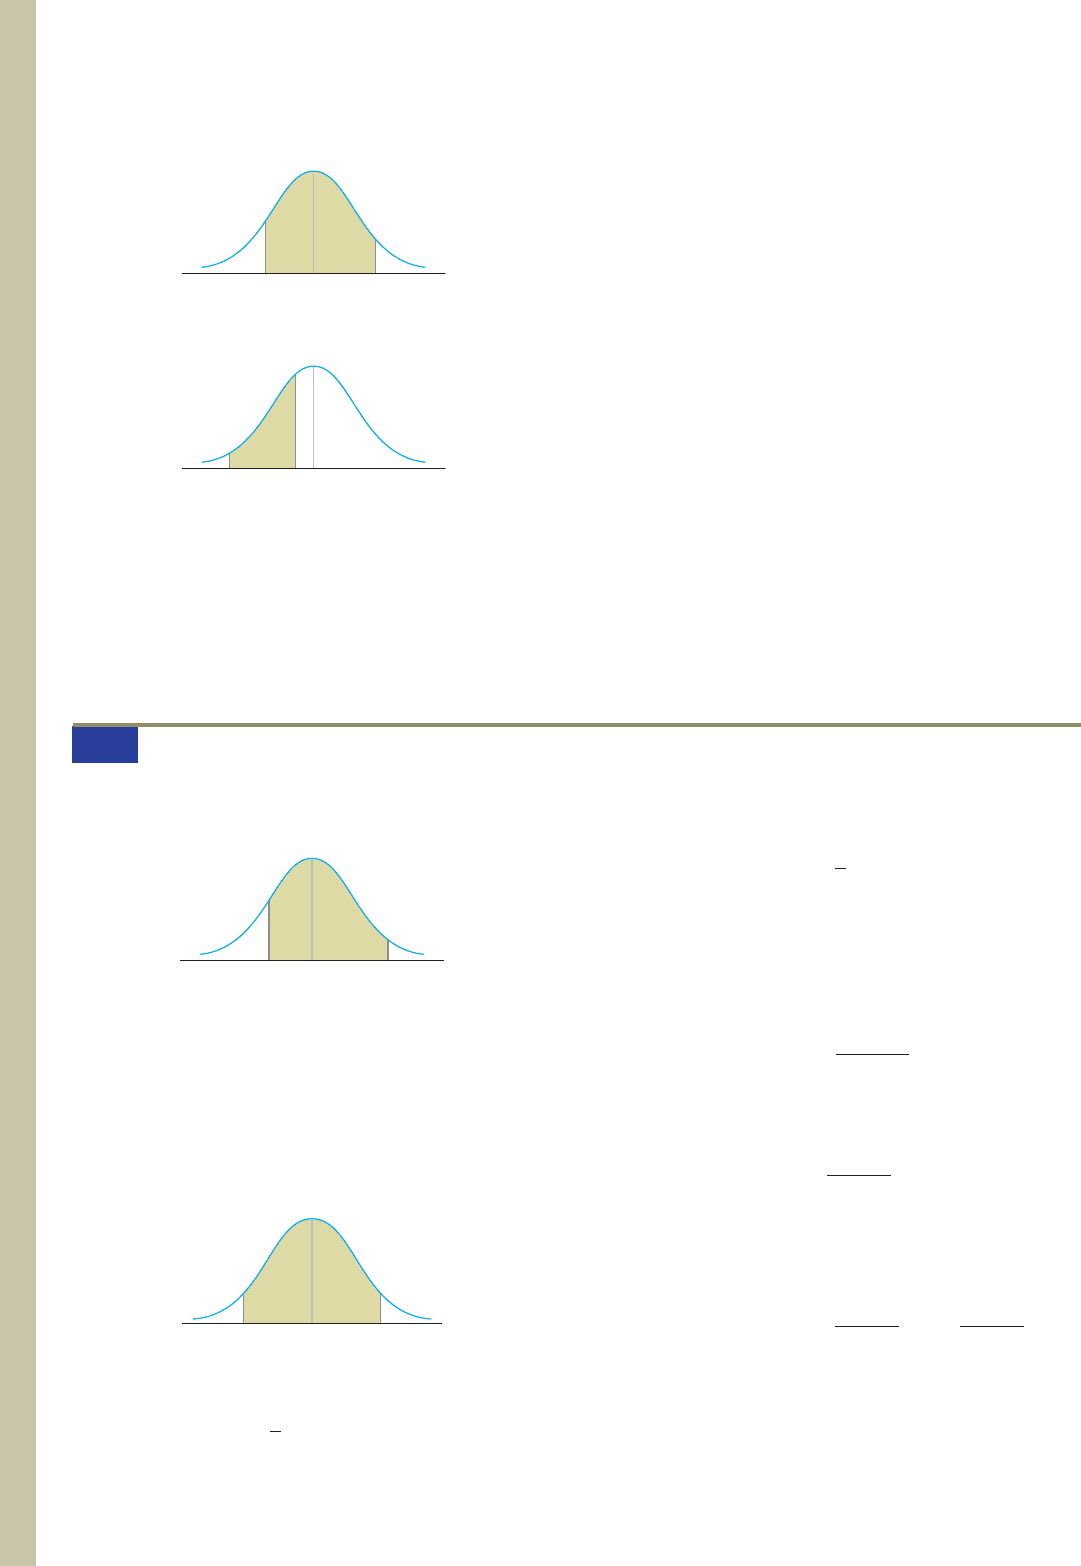
1. a. The probability P(1.2 Z 2.1) is given by the
shaded area in the accompanying figure:
We have
P(1.2 Z 2.1) P(Z 2.1) P(Z 1.2)
.9821 .1151
.867
b. The region associated with P(z Z z) is shown in
the accompanying figure:
Observe that we have the following relationship:
P 1Z z 2
1
2
31 P 1z Z z24
–zz
0
.8764
2.1
–1.2
(see Example 2c). With P(z Z z) .8764, we
find that
Consulting the table, we find z 1.54.
2. Using the transformation (16) and the table of values of Z,
we have
a.
b.
c.
.6826
.8413 .1587
P
1Z 12 P 1Z 12
P
11 Z 12
P
170 X 902 P a
70 80
10
Z
90 80
10
b
.9772
P
1Z 22
P
1Z 22
P
1X 602 P aZ
60 80
10
b
.9772
P
1Z 22
P
1X 1002 P aZ
100 80
10
b
.9382
P
1Z z 2
1
2
11 .87642
87533_08_ch8_p417-482 1/30/08 10:09 AM Page 470
Applications Involving Normal Random Variables
In this section we look at some applications involving the normal distribution.
APPLIED EXAMPLE 1
Birth Weights of Infants The medical records
of infants delivered at the Kaiser Memorial Hospital show that the infants’
birth weights in pounds are normally distributed with a mean of 7.4 and a stan-
dard deviation of 1.2. Find the probability that an infant selected at random from
among those delivered at the hospital weighed more than 9.2 pounds at birth.
Solution
Let X be the normal random variable denoting the birth weights of
infants delivered at the hospital. Then, the probability that an infant selected at
random has a birth weight of more than 9.2 pounds is given by P(X 9.2). To
compute P(X 9.2), we use Formula (18), Section 8.5, with 7.4, 1.2,
and a 9.2. We find that
Thus, the probability that an infant delivered at the hospital weighs more than
9.2 pounds is .0668.
APPLIED EXAMPLE 2
Packaging Idaho Natural Produce Corporation
ships potatoes to its distributors in bags whose weights are normally dis-
tributed with a mean weight of 50 pounds and standard deviation of 0.5 pound. If
a bag of potatoes is selected at random from a shipment, what is the probability
that it weighs
a. More than 51 pounds?
b. Less than 49 pounds?
c. Between 49 and 51 pounds?
Solution
Let X denote the weight of potatoes packed by the company. Then the
mean and standard deviation of X are 50 and 0.5, respectively.
a. The probability that a bag selected at random weighs more than 51 pounds is
given by
b. The probability that a bag selected at random weighs less than 49 pounds is
given by
.0228
P 1Z 22
P 1X b 2 P aZ
b m
s
b P 1X 49 2 P aZ
49 50
0.5
b
.0228
P 1Z 22
P 1Z 22
P 1X a 2 P aZ
a m
s
b P 1X 51 2 P aZ
51 50
0.5
b
.0668
P 1Z 1.52
P 1Z 1.52
P 1X a 2 P aZ
a m
s
b P 1X 9.2 2 P aZ
9.2 7.4
1.2
b
8.6 APPLICATIONS OF THE NORMAL DISTRIBUTION 471
8.6 Applications of the Normal Distribution
87533_08_ch8_p417-482 1/30/08 10:09 AM Page 471