Tennick A. Practical PowerPivot & DAX Formulas for Excel 2010
Подождите немного. Документ загружается.

44 Practical PowerPivot & DAX Formulas for Excel 2010
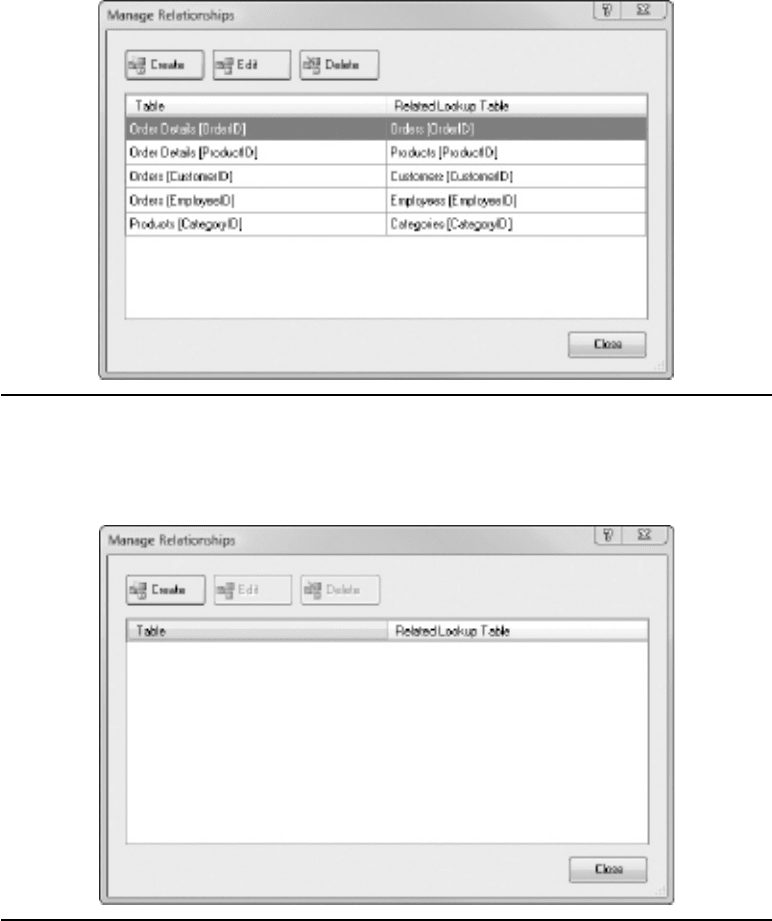
Figure 2-24 Manage Relationships dialog showing relationships
Figure 2-25 Manage Relationships dialog without relationships

Chapter 2: PowerPivot: Overview 45
If you are already conversant with relational databases, notice that each relationship
must go from the many side (the child table) to the one side (the parent or lookup
table). In a one-to-one relationship (not shown here), the order is not important. Each
pair of tables in a relationship is linked by a column. That column has to appear in both
tables. On the left or many side, it’s known as the foreign key. On the right or one side,
it’s known as a primary key or the lookup key.
If you followed along with the Excel/data feed import, there are no relationships—
Excel/data feeds don’t support relationships, so there’s nothing for PowerPivot to inherit
as you import the data. This situation will also arise if you mix even relational imports.
For example, if you import a SQL Server table and an Access one, or two Access tables
from separate databases, the source databases do not include cross-database or cross-
software relationships. You can create relationships in two places from the Relationships
group on the Design ribbon. One, you can click Manage Relationships, and then click
the Create button in the Manage Relationships dialog. Two, you can click the Create
Relationship button directly. Both methods open the Create Relationship dialog
(Figure 2-26), where you have to create relationships one at a time. You can also create
relationships by right-clicking on a column header—this has the advantage of entering
the table and column name for you on the many side of the relationship.
If you want to follow along with your Excel/data feed example (if you have one), you
have to choose a Table and a Column at the top of the dialog. This should be a table
at the many side of a relationship (or any side, in a one-to-one relationship), and the
column must be the foreign key. Underneath, you choose the Related Lookup Table
Figure 2-26 Create Relationship dialog

46 Practical PowerPivot & DAX Formulas for Excel 2010
and the Related Lookup Column. The table is on the one side of a relationship and the
column is its primary (lookup) key. If you get the tables in the wrong order, PowerPivot
will automatically reverse them for you. For the Excel/data feed import only:
1. Click the Design tab and choose Create Relationship.
2. Implement all of the five necessary relationships from the preceding list.
Adding Columns
It’s quite possible that your source data does not include everything you want in
a subsequent pivot report (table or chart). For example, you may wish to analyze
and compare sales amounts by year. Neither the sales amount nor the year exists
in our source data. It’s also likely that it does not include the necessary degree of
denormalization. Denormalization is a process of reassembling data from a segmented
and normalized transactional database to help in your BI analysis. Here, you might
want to analyze by both category name (that is, product categories) and product name
at the same time. Currently, the product name and the category name are in two
separate tables (Products and Categories). If you were to have them both in one table,
your pivot reports will display the correct data—for example, the product Chai will
appear under the Beverages category and not under the Seafood category. If you are
able to implement these and similar changes, you are creating business intelligence
from often-unfriendly source data that may originate from many different sources.
PowerPivot makes this (and more) easy. Not only does it centralize and assemble data,
it helps you to transform that data into intelligence.
One powerful, yet straightforward, way to change your data into intelligence is to
create new columns in your PowerPivot tables. You are helped in this by the versatility
of DAX formulas. In the upcoming example, we are going to use DAX three times. In
this chapter, the DAX examples are to give you a taste and get you started (and possibly
excited!). There are many more examples in Chapter 3, and a whole part of this book
(Part II) is devoted to DAX. Let’s turn our data into real business intelligence by adding
the sales amount, and the year an order was made, and by having product names and
category names together. If you are working along, you can use the PowerPivot tables
imported from either Excel, Access, SQL Server, or a data feed (or a combination of
two or more of these sources, if you’ve been experimenting). PowerPivot makes the
source data transparent.
To add business intelligence to PowerPivot using DAX:
1. Click on the tab for the Order Details table to make it current.
2. You’ll see an empty column at the right of the table with the heading Add
Column. Click anywhere in this column and type the following DAX formula
Chapter 2: PowerPivot: Overview 47
(instead of typing the table and column names, it’s much easier to type the letter
“o” after the equal sign (=), and use the arrow keys to highlight, then press tab):
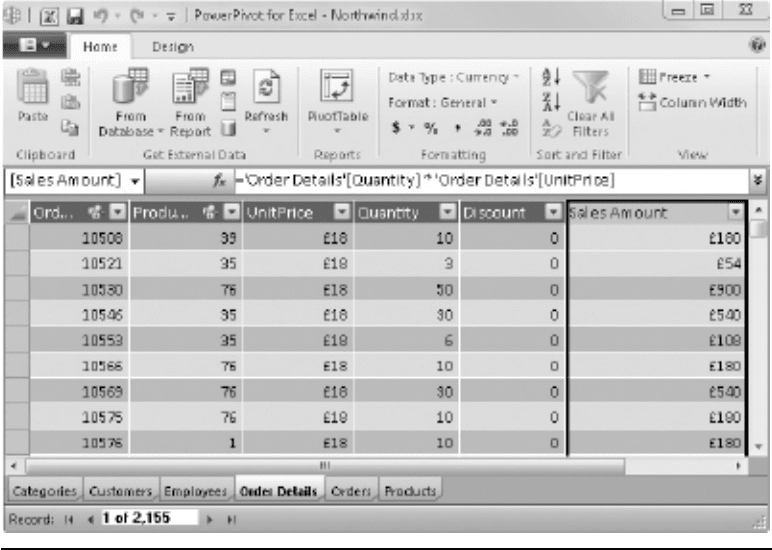
='Order Details'[Quantity] * 'Order Details'[UnitPrice]
e formula appears in the formula bar as you start to type. When you are finished,
press enter and you have a new column of data—the column is probably now
entitled CalculatedColumn1. e table name is not absolutely necessary, provided
you are using columns from the same table. e following syntax is a shorter
alternative—in this case, type the letter “q” after the equal sign (=):
=[Quantity] * [UnitPrice]
3. Rename the column to Sales Amount by double-clicking the column header,
typing the new name, and finally pressing enter. Your result should look like
Figure 2-27.
Figure 2-27 DAX calculated column for Sales Amount
48 Practical PowerPivot & DAX Formulas for Excel 2010
That’s the Sales Amount done. Now, to work out the year for each order:
1. Click the Orders tab to make the Orders table current. If you can’t click the tab,
you might still be in the formula bar—pressing enter will exit from the formula
bar. Scroll, if necessary, to find the first empty column with a heading of Add
Column (or click the Add button on the Design menu). Click in the column and
type the following DAX (the single quotes are optional if there is no space in the
table name), and then press enter:
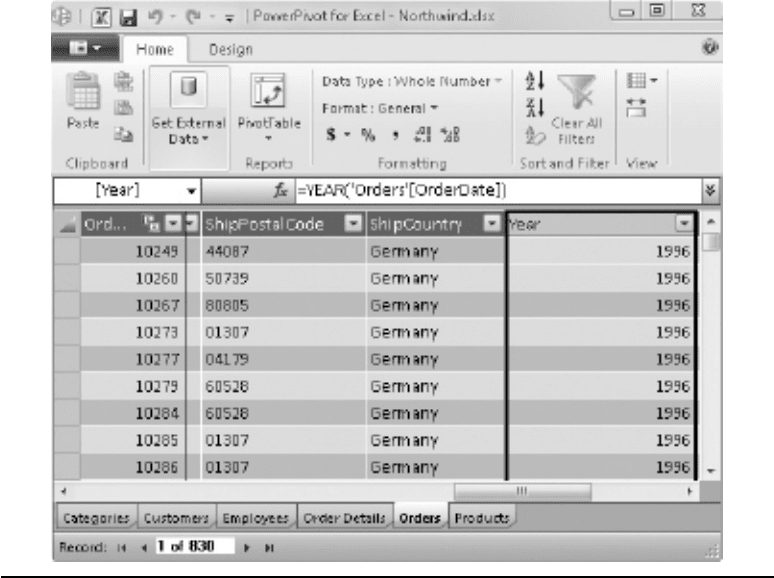
=YEAR('Orders'[OrderDate])
2. Again, rather than type the table and column name, type the letter “o” and
then select 'Orders'[OrderDate] and press tab. This is known as
AutoComplete—it’s pretty useful. Rename the column to Year and press enter.
The result is shown in Figure 2-28. The following shorter syntax also works:
=YEAR([OrderDate])
Figure 2-28 DAX calculated column for Year
Chapter 2: PowerPivot: Overview 49
Finally, to put the category name and product name together:
1. Click the Products tab to view the Products table. Click in the Add Column
column, and type the following DAX (you can type the letter “c” and use
AutoComplete to save typing the table name and the column name). If you type
the letter “r” after the equal sign (=), you can save typing the function name in full:
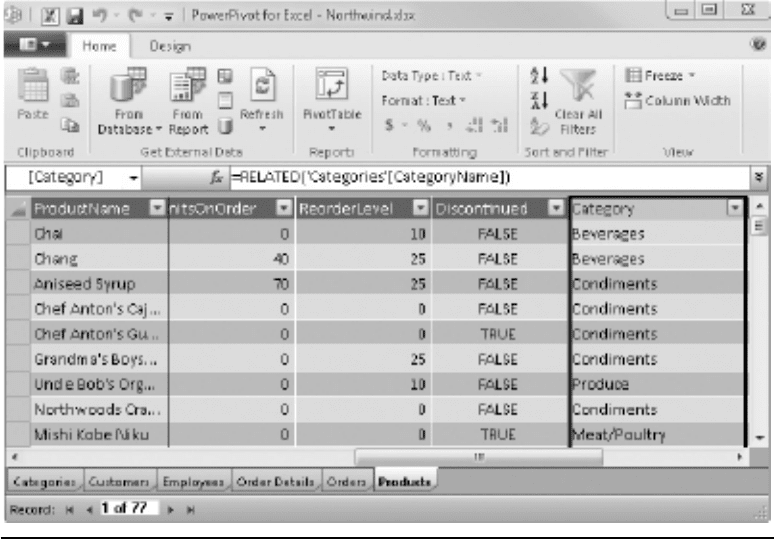
=RELATED('Categories'[CategoryName])
2. Press enter to accept the DAX formula (to back out at any time as you enter
DAX, press esc). The single quotes are optional. Rename the column to Category
by double-clicking, typing the new name, and pressing enter. Hopefully, you are
looking at something like Figure 2-29. All of the three DAX formulas here are
known as calculated columns.
Figure 2-29 DAX calculated column for Category

50 Practical PowerPivot & DAX Formulas for Excel 2010
If you are from a business intelligence background and are familiar with SSAS, be
aware that you have created a star schema and a cube in a few minutes! In fact, this
is an SSAS cube—although SSAS is nowhere to be seen. There is a hidden copy of
SSAS running behind PowerPivot—even without you having to install SSAS (the
hidden copy is installed automatically when you install PowerPivot for Excel). If you
are completely new to business intelligence, you have just accomplished something that
normally (before PowerPivot) might take days. Cool.
A Quick Pivot Table
It would be nice to see your new “cube” as a cube—we are still looking at our data
as separate tables; PowerPivot enables us to do much better. One of the best ways
to visualize business intelligence is through a pivot report, which can be a pivot table
or a pivot chart (or multiple pivot tables and pivot charts). The pivot table uses
MultiDimensional eXpressions (MDX) and the Excel CUBE() functions to extract the
data from the “hidden,” in-memory PowerPivot SSAS cube. Pivot reports incorporate
a vast range of functionality. There is a separate chapter later (Chapter 5) just on pivot
tables and charts. In this overview chapter we are going to create a simple (yet quite
powerful) pivot table just as a starter.
To create a pivot table from PowerPivot tables:
1. Click the Home tab to display the Home ribbon in PowerPivot. In the Reports
group of the Home ribbon, click PivotTable followed by PivotTable in the drop-
down menu—the menu is shown in Figure 2-30.
2. In the Create PivotTable dialog (Figure 2-31), either accept New Worksheet (the
default) or choose Existing Worksheet. You are switched out of the PowerPivot
window back into the original Excel workbook, and an empty pivot table is
displayed in an Excel worksheet. You can view the underlying connection by
Figure 2-30 PivotTable menu

Chapter 2: PowerPivot: Overview 51
going to the Data ribbon and clicking the Connections button in the Connections
group. This opens the Workbook Connections dialog. If you click the Properties
button, the Connection Properties dialog opens. In this dialog, the Definition tab
shows a data source of $Embedded$ in the Connection string text box. Under
no circumstances should you attempt to make any changes—you may lose the
connection altogether.
At the right of the worksheet, there is the PowerPivot Field List (this is often simply
called the Field list). This lists tables and columns from PowerPivot, as well as drop-
zones labeled Slicers Vertical, Slicers Horizontal, Report Filter, Column Labels, Row
Labels, and Values. If you can’t see the PowerPivot Field List, click inside the pivot table
itself. If you still can’t see it, with the focus inside the pivot table, click Field List in the
Show/Hide group of the Excel PowerPivot ribbon.
Before we begin to add table columns to the pivot table, try just one more DAX
formula. The reason for doing so is to give you a quick glimpse of the second main use
for DAX. This is to create measures—the previous three DAX formulas were used for
calculated columns. Chapter 3 examines the difference between calculated columns
and measures in some depth. For now, it’s sufficient to know that a measure is often a
numeric value that appears in the main body of the pivot table (Values drop-zone in
the PowerPivot Field List) and allows you to create totals, subtotals, and other context-
sensitive calculations. Measures are often called facts or metrics—we are going to create
one that shows sales of individual product and category as percentages of total sales.
Calculated columns allow you to expand upon your source data and are often attributes
that describe the measures. Calculated columns are often added to the slicers, columns,
or rows of a pivot table; they give your measures context.
You have just created a calculated column called Year, if you are following the
practicals. As a result, you can analyze sales by year. The Sales Amount calculated
column created earlier can be used as a measure. When you explicitly create a measure
(using the following steps), it’s done from the Excel workbook. These explicit measures
Figure 2-31 Create PivotTable dialog
52 Practical PowerPivot & DAX Formulas for Excel 2010
generally appear as numeric values in the center of the pivot table. When you create a
calculated column, you do so in the PowerPivot window. Calculated columns can be
used as attributes that describe, and are used to slice and dice, the values in a pivot table
(Year is an example—for SSAS and MDX veterans, such attributes are the equivalent
of non-measure dimension attributes in SSAS cubes) or they can be used as measures
(Sales Amount is an example). To add a calculated DAX measure:
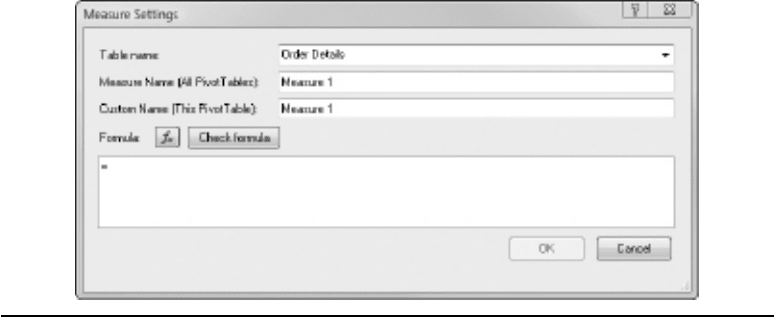
1. In Excel, click New Measure in the Measures group of the PowerPivot ribbon to
open the Measure Settings dialog (Figure 2-32).
e Measure Settings dialog is where you specify the name and the DAX
formula for the new measure. In addition, you also select a PowerPivot table to
act as a host for the measure. It’s a good idea to assign new measures to a table
that already contains measures (or facts or metrics). In this case, Order Details
is perfect. It already has a source column called Quantity—this came directly
from the source data and is a good candidate for a measure. In addition, there is a
calculated column, called Sales Amount, which can be used as a measure. Choose
Order Details as the Table name. When you explicitly create a measure, as here,
you won’t see it if you flip to the PowerPivot window. However, of course, you
could see Sales Amount, which is a calculated column used as a measure, and Year
and Category. In addition, in the PowerPivot Field List, an explicit, calculated
measure has a small calculator icon—a calculated column has no special symbol
and looks just like any other column in a table.
Figure 2-32 Measure Settings dialog
Chapter 2: PowerPivot: Overview 53
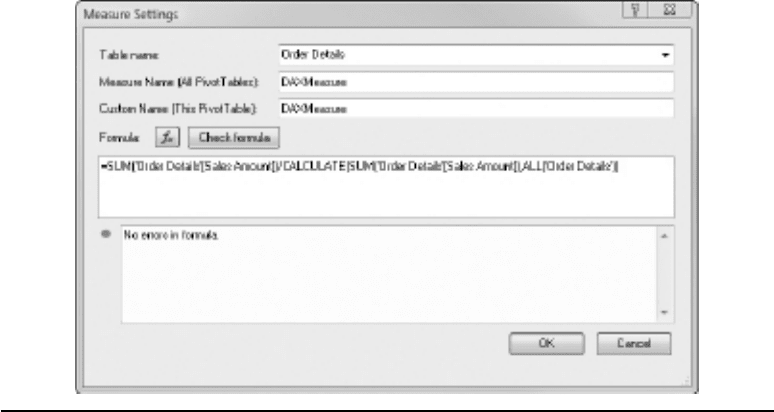
2. Enter DAXMeasure as the Measure Name. This is reflected in the Custom
Name. The first name is the generic name for the measure. By default, this is the
name of the measure in all pivot tables and charts. You can override this name
on an individual pivot table basis by changing the Custom Name property. To do
so, while viewing any pivot table or chart, click the measure in the field list of the
PowerPivot Field List and then click Measure Settings on the PowerPivot ribbon.
Any custom name you enter is then valid for that pivot table or chart.
3. In the Formula text box, enter either of the two following DAX formulas (as
shown in Figure 2-33):
=SUM([Sales Amount])/CALCULATE(SUM([Sales Amount]),ALL('Order
Details'))
=SUM('Order Details'[Sales Amount])/
CALCULATE(SUM('Order Details'[Sales Amount]),ALL('Order Details'))
This formula (whichever version you used) is calculates the Sales Amount, of
whatever is being viewed in the pivot table, divided by the total Sales Amount of all
records in the Order Details table. The DAX syntax involved is covered thoroughly
later in the book—so don’t be too concerned if it’s not exactly intuitive. For now, it’s
more important to concentrate upon the results. Remember to use letters first and then
Figure 2-33 DAX measure