Tong W. Wind Power Generation and Wind Turbine Design
Подождите немного. Документ загружается.

Design of Support Structures for Offshore Wind Turbines 575
4.3 Wind
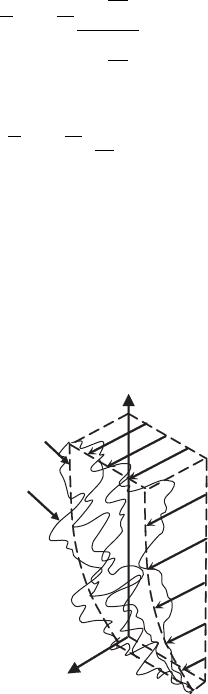
Figure 22 shows a wind speed profi le for a certain point in time. From this fi gure
a number of characteristics can be deduced. First, that the mean wind is stronger
at higher altitudes than near the surface of the earth. This is caused by friction of
the moving air with the terrain. The effect becomes less pronounced as the altitude
increases. The resulting difference in wind speed over altitude is called wind shear.
Secondly, it is evident that the actual wind profi le is very irregular. The actual wind
speed deviates from the mean wind speed and direction as a result of turbulence.
These two phenomena will be discussed briefl y.
There are two commonly used models to describe wind shear: the logarithmic
profi le and the power law. The logarithmic profi le is given by eqn (10), while eqn
(11) describes the power law [ 4 ]:
0
0
ln
()
ln
r
r
z
z
Vz V
z
z
⎛⎞
⎜⎟
⎝⎠
=
⎛⎞
⎜⎟
⎝⎠
( 10)
()
a
r
r
z
Vz V
z
⎛⎞
=
⎜⎟
⎝⎠
( 11)
In Fig. 23 both the logarithmic profi le and the power law are shown. It clearly
shows the difference between both models.
While the above gives a description for the mean wind speed, in reality the wind
is never a steady fl ow of air that can be described with only one parameter. Local
disturbances in the airfl ow called eddies cause the instantaneous wind speed to
fl uctuate around a mean value. This phenomenon is called turbulence. A measure
Mean profile
Actual wind
speed profile
x
z
Figure 22: 3D turbulent wind velocity profi le.
576 Wind Power Generation and Wind Turbine Design
for the turbulence is given by the turbulence intensity I , which is defi ned as a func-
tion of the standard deviation and the mean wind speed as shown in the following
equation:
[]
100 %I
V
s
=⋅ ( 12)
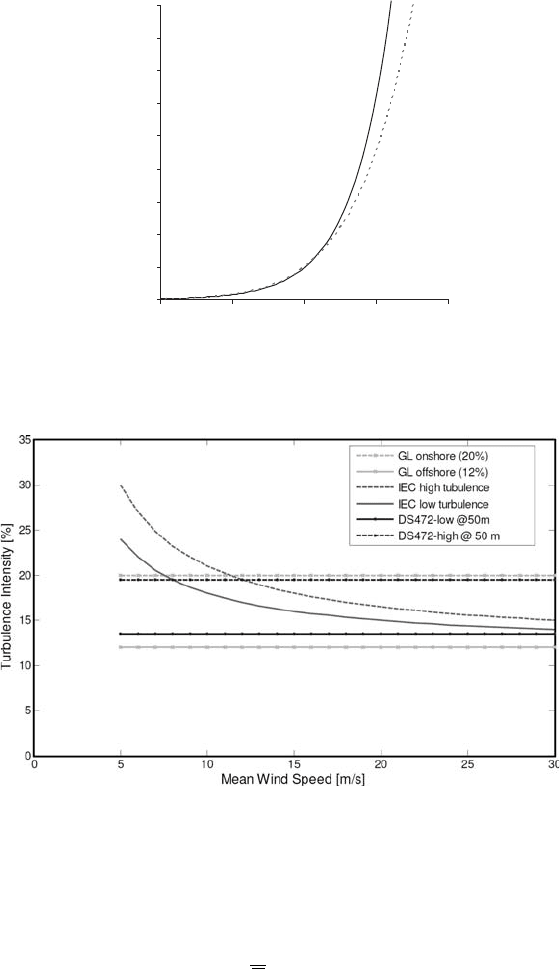
Recommended values for the turbulence intensity are given by various design
standards. Figure 24 shows some turbulence intensity descriptions. It shows that
the turbulence intensity is much higher onshore than offshore.
0
10
20
30
40
50
60
70
80
90
6 8 10 12 14
Wind Speed [m/s]
Height [m]
Figure 23: Wind shear profi le according to logarithmic profi le and power law.
Figure 24 : Various turbulence intensity models [ 4 ].

Design of Support Structures for Offshore Wind Turbines 577
The wind loads on an offshore wind turbine can be split into operational loads
on the turbine and loads on the structure. A description of the operational loads on
the turbine and the load cases that should be considered can be found elsewhere in
this work. The operational loads result in bending moments, normal forces and
shear forces on the tower top.
The wind load on the tower structure itself results from drag forces only. To
determine the total load on the tower structure the instantaneous wind speed should
be evaluated at several elevations to account for wind shear. Subsequently, eqn
(13) can be used to determine the drag force on each segment:
2
1
2
() ()
tower air w av wind
Ft CDutr=⋅⋅⋅
(13 )
4.4 Soil
The soil contributes to the loading of the structure by providing the support reac-
tions. In the case of piled foundations, these reactions are dependent on the lateral
and axial pile–soil interaction. For GBSs the support reactions are generated by
the vertical bearing capacity and the resistance against sliding.
Soil is generally a granular material, either cohesive such as clay, or non-cohesive
such as sand. Other soil types that may be encountered are gravel, silt and peat. Soil
originates either through erosion of rocks or through accumulation of organic mate-
rial. Due to its geological history soil is highly inhomogeneous. The inter-particle
voids are fi lled with water which may prevent or slow deformations [ 5 ].
The characterisation of loose to dense sand and soft to hard clay only gives a fi rst
indication of the ability of the soil to carry load. For design, more detailed knowledge
is required. This is usually gathered through in-situ sampling and analysis of drilled
samples in the laboratory. The fi rst property measured for all types is the density r
soil
(kg/m
3
), usually for submerged soil, which is the dry density minus the density of
water. A typical value is between 400 and 1000 kg/m
3
. For clay, the undrained shear
strength s
u
and the strain at 50% of the maximum stress e
50
are measured. Table 1
gives an overview of typical values when no reliable soil data is available [ 4 ].
For sand the friction angle φ ′ and the relative density of sand D
r
are derived
directly from in-situ measurements. The initial modulus of horizontal subgrade
reaction, k
s
, can then be found with the graph in Fig. 25 [ 6 ].
Table 1: Characteristic parameters for clay.
Clay type
s
u
(kPa)
e
50
(%)
Soft 0–25 1.5
Firm 25–50 1.5
Stiff 50–100 1.0
Very stiff 100–200 0.5
Hard >200 0.5
578 Wind Power Generation and Wind Turbine Design
Due to its discontinuous nature soil particles can move with respect to the sur-
rounding particles, thereby altering the structure of the soil. This creates a sig-
nifi cantly non-linear behaviour which is usually described in terms of load
displacement diagrams.
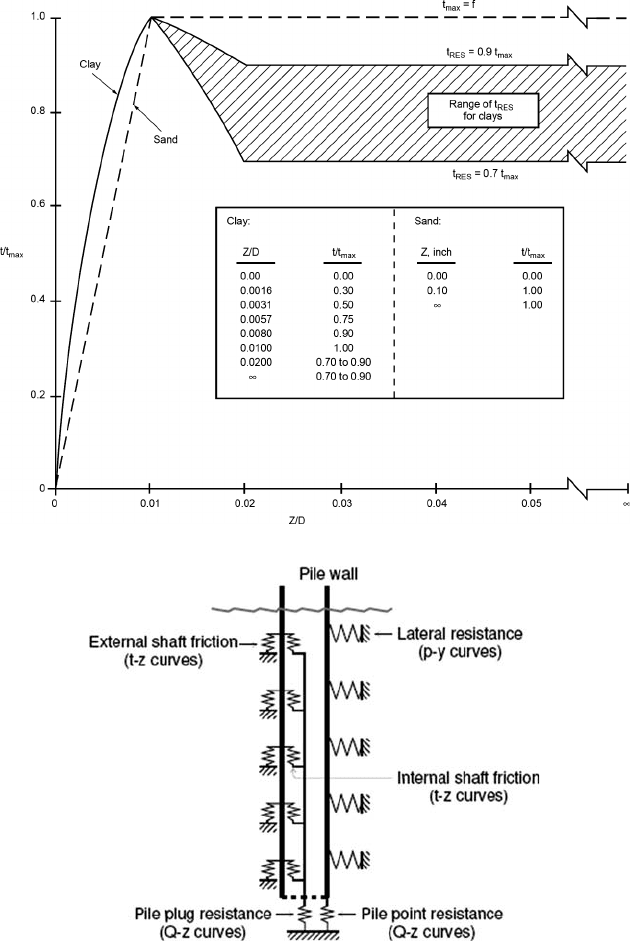
For a single pile in soil the pile–soil interaction can be described in terms of
lateral resistance, shaft friction and end bearing. This behaviour is commonly
modelled as non-linear load displacement curves: P – y curves for the lateral resis-
tance and t – z and Q – z curves for the shaft friction and the end bearing respectively.
Figure 26 shows t – z curves for sand and clay [ 6 ].
To model the soil reaction loads a set of soil springs is used. Figure 27 shows
the springs for the horizontal and vertical direction as well as for the pile
plug [ 4 ].
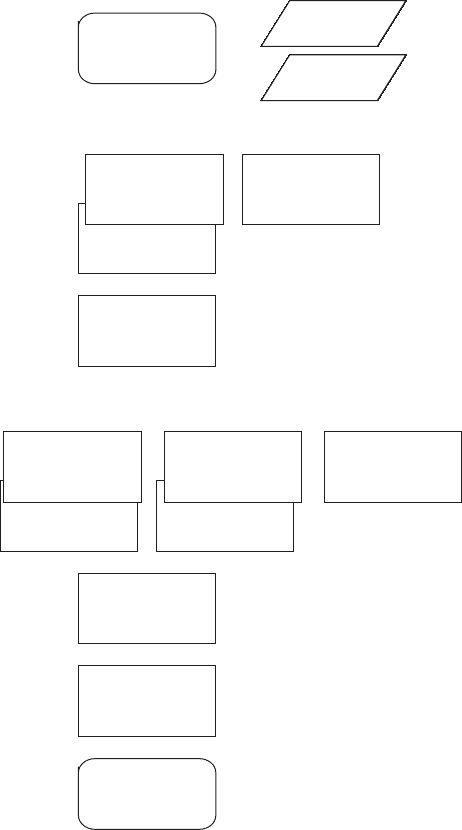
5 Support structure design
5.1 Design steps
The design of the support structure is an iteration between tuning the dynamic
properties, optimising the amount of steel needed to resist all load cases and re-
calculating the loads on the optimised structure. Figure 28 shows the design steps
that are typically required to come to a complete design of a support structure.
The different design steps have a strong interdependence and several iteration
steps are normally required to come to an optimal design. For an entire offshore
wind farm, some design details can be fi xed. For instance, the hammer for installing
Medium
Dense
Loose Dense
Very
Dense
Very
Loose
020 40 60 80 100
28
o
29
o
30
o
36
o
40
o
45
o
80
60
40
20
0
Relative densit
y
[%]
φ
' Angle of internal friction [deg]
k
s
[MPa/m]
Sand above the
water table
Sand below the
water table
Figure 25 : Initial modulus of subgrade reaction k
s
as a function of friction angle
φ ′ [ 6 ].
Design of Support Structures for Offshore Wind Turbines 579
Figure 26 : Load-displacement curves [ 6 ].
Figure 27: Modelling of pile–soil interaction [ 4 ].
the foundation piles can be of a single diameter, giving the designer less parameters
to optimize.
In the previous chapter, the determination of design loads was treated. This
chapter describes the steps to process this data and the turbine characteristics to
come to a design of the structure.
580 Wind Power Generation and Wind Turbine Design
5.2 Turbine characteristics
The support structure has one main purpose: to keep the turbine up in the wind,
where it produces energy. Wind turbines are fatigue machines by principle:
with a rotation every 3 s on a desired availability above 98% per year for
20 years, a total of 200 million cycles. It is therefore key to design the support
structure in such a way that the turbine dynamics and the support structure
dynamics to not coincide.
General approach
Standards
Terminology
Selection best &
worst location
(depth & soil)
Define load cases
Transition piece
design
Drivability
considerations
Design summary
Buckling check
Preliminary fatigue
check
Natural frequency
check
Required pile
penetration depth
Required wall
thickness
Assess
environmental
data
Gather
characteristic
turbine data
Figure 28 : Design steps to come to a support structure design.

Design of Support Structures for Offshore Wind Turbines 581
From the publically available turbine data, the required properties for support
structure design can usually be gathered:
turbine rotation speed range •
number of blades •
tower height •
turbine mass •
Table 2 shows details for two commonly used turbine types.
5.3 Natural frequency check
From the turbine characteristics, the frequency ranges for the design of the sup-
port structure can be determined. The natural frequency of the structure should not
coincide with the rotor speed range (1P) and blade passing speed range (3P for
three-bladed turbines).
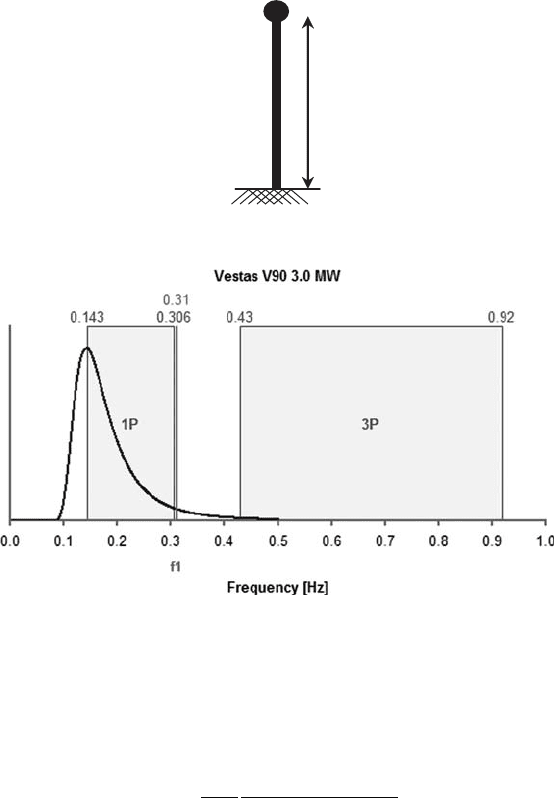
A fi rst-order calculation of the natural frequency of a structure can be performed
with the following simplifi ed model. When the support structure is modelled as a
mass on pole with the mass being the turbine mass and the pole a single diameter
and wall thickness steel pile as depicted in Fig. 29 .
Table 2: Turbine data.
SWT 3.6 MW V90 3.0 MW
Rotor
Type Three-bladed Three-bladed
Diameter (m) 107 90
Swept area (m
2
) 9000 6362
Turbine
Minimum rotor speed (rpm) 5 8.6
Maximum rotor speed (rpm) 13 18.4
Blades
Blade length (m) 52.0 44.0
Generator
Nominal power (kW) 3,600 3,000
Tower
Tower diameter (m) 3.051–5.000 2.300–4.200
Tower wall thickness (mm) 21–30 14–26
Operational data
Cut-in wind speed (m/s) 4.0 4.0
Nominal power at approximate
wind speed (m/s)
13.0 15.0
Cut-out wind speed (m/s) 25.0 25.0
Masses
Nacelle + rotor mass (ton) 225 111
582 Wind Power Generation and Wind Turbine Design
For this model consisting of a uniform beam with a top mass and a fi xed base,
the following approximation for the calculation of the fi rst natural frequency
is valid:
2
nat
23
top
3.04
4 ( 0.227 )
EI
f
mLLpm
≅
+
( 14 )
with f
nat
is the fi rst natural frequency (Hz), m
top
the top mass (kg), m the tower
mass per meter (kg/m), L the tower height (m) and EI is the tower bending
stiffness (N m
2
).
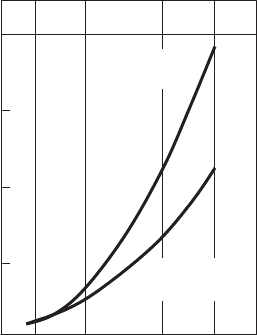
The 1P and 3P areas can be plotted in a fi gure to visualize the zones in which
the support structure natural frequency should not lie. In Fig. 30 this is shown for
the V90 from Table 2 in the previous section.
The natural frequency will change through the next steps of design. It will need
to be checked against this diagram to make sure it falls within the area between 1P
and 3P.
For more detailed determination, the natural frequency will of course be calculated
using a fi nite element model of the structure.
m
EI
m
top
L
Figure 29: Structural model of a fl exible wind turbine system.
Figure 30: Frequency areas of 1P and 3P for the V90, with the designed natural
frequency at 0.31 Hz between 1P and 3P to prevent dynamic interaction.
Design of Support Structures for Offshore Wind Turbines 583
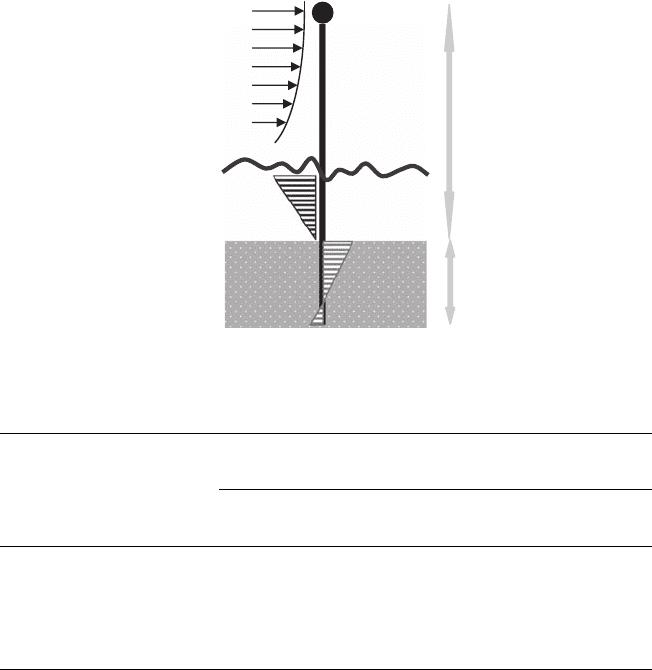
5.4 Extreme load cases
The main parameter resulting from the natural frequency check is the pile diameter.
For the part of the support structure that is submerged, the diameter determines the
hydrodynamic loads: waves and currents. The extreme load cases on an offshore
wind turbine and the soil reaction to support those loads are shown in Fig. 31 .
The rest of the loads are aerodynamic loads on the turbine and the tower. The
combinations of these loads under different conditions are prescribed in the design
standards. To take the probability of occurrence into account, several load combi-
nations are prescribed: maximum 50-year wave load combined with a reduced
50-year gust event and the reduced maximum 50-year wave load combined with
the full 50-year gust. An overview of load combinations is shown in Table 3 .
5.5 Foundation design
Now that the global structural dimension and the design load cases are known, the
foundation design can be detailed.
Wind
Waves + Current
Soil
∑
=
∑ F
soil
Figure 31 : Extreme load cases on the offshore wind turbine and the soil reaction
to support those loads.
Table 3: Load combinations [ 3 ].
Limit
state
Load
combination
Environmental load type and return period to defi ne
characteristic value of corresponding load effect
Wind Waves Current Ice
Water
level
ULS 1 50 years 5 years 5 years 50 years
2 5 years 50 years 5 years 50 years
3 5 years 5 years 50 years 50 years
4 5 years 5 years 50 years
5 50 years 5 years 50 years
584 Wind Power Generation and Wind Turbine Design
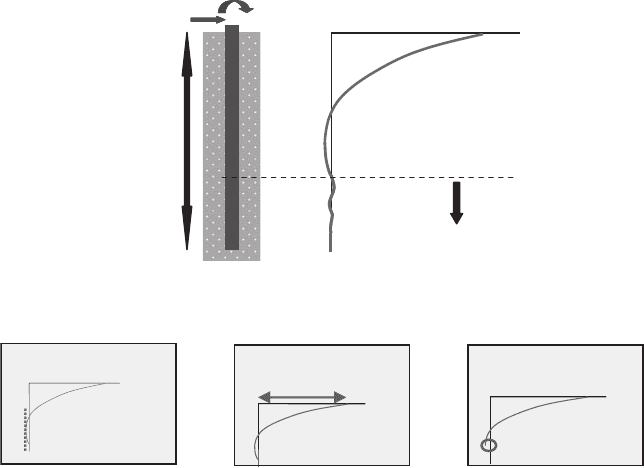
The foundation pile can be modelled separately in a program incorporating
detail soil models following the p – y method described in the previous chapter.
The defl ection of the pile is shown in Fig. 32 . To start the pile penetration depth
design, a pile length of seven times the pile diameter is chose to be sure the pile
tip defl ection is negligible.
With the foundation pile modelled in the fi nite element program, the pile length can
be reduced while the following three checks are monitored after each step ( Fig. 33 ):
the pile tip should reach a vertical tangent 1.
the defl ection of the pile at mudline is less than 120 mm 2.
the defl ection at the toe is less than 20 mm 3.
5.6 Buckling & shear check
Now that the foundation pile has been modelled, also the pile–soil interaction is
known and the defl ection of the structure under different loads. The structural steel
can now be checked for integrity under extreme load cases.
5.7 Fatigue check
The biggest step in optimising the design of the support structure is checking
the fatigue. Fatigue is the phenomenon of slow deterioration of the steel due to
F
M
F
M
Deflections
Deflection [m]
Depth
Penetration depth
Figure 32 : Pile defl ection.
Vertical Tangent:
Depth [m]
Deflection [m]
(1)
Max. Mudline
deflection (120 mm):
(2)
Max. Pile toe
deflection (20 mm):
(3)
Figure 33: The three checks for foundation pile length design: vertical tangent
at the pile toe, maximum defl ection at the mudline, and maximum
toe defl ection.