Wallace J.M., Hobbs P.V. Atmospheric Science. An Introductory Survey
Подождите немного. Документ загружается.

184 Atmospheric Chemistry
days to a week. An important exception is COS,
which is very stable in the troposphere and, as a
result, has a relatively long residence time (2 years)
and a large and relatively uniform concentration
(0.5 ppbv, compared to 0.1 ppbv for DMS, 0.2
ppbv for H
2
S and SO
2
, and 0.05 ppbv for CS
2
).
Consequently, COS is the most abundant sulfur com-
pound in the troposphere. However, because it is
relatively unreactive, it is generally ignored in tropos-
pheric chemistry. The relatively long residence time
of COS enables it to be mixed into the stratosphere
gradually, where, converted by UV radiation, it is
the dominant source of the sulfate aerosol during
volcanically quiescent periods (see Section 5.7.3).
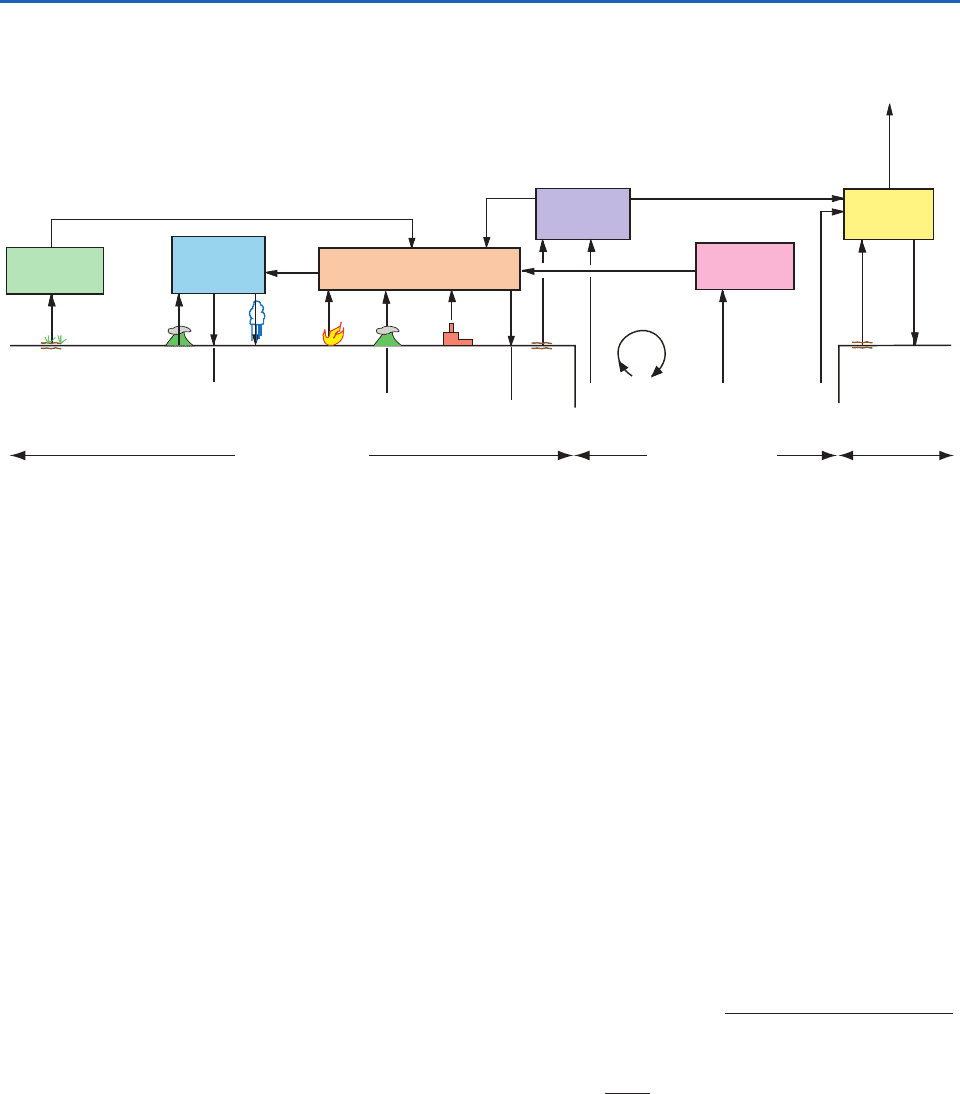
The flux of anthropogenic emissions of sulfur to
the atmosphere is known quite well; it is 78 Tg(S)
per year, which is greater than estimates of the
natural emissions of reduced sulfur gases to the
atmosphere (Fig. 5.15). Therefore, the global sulfur
budget is significantly affected by human activities.
Anthropogenic emissions of sulfur are almost entirely
in the form of SO
2
and 90% are from the northern
hemisphere. The main sources are the burning of coal
and the smelting of sulfide ores.
The main mechanisms for removing sulfur from the
atmosphere are wet and dry deposition. For example,
of the 80 Tg(S) per year of SO
2
that is oxidized to
about 70 Tg(S) per year occurs in clouds,
which is subsequently wet deposited; the remainder
SO
2
4
,
is oxidized by gas-phase reactions and dry deposited
(Fig. 5.15).
Exercise 5.9 Using the information given in Fig. 5.15,
estimate the residence time of SO
2
in the troposphere
with respect to influxes.
Solution: From Fig. 5.15 we see that the magnitude
of the tropospheric reservoir of SO
2
is 0.3 Tg(S).
By adding the influxes of SO
2
shown in Fig. 5.15,
the total influx is found to be 120.5 Tg(S) per year.
Therefore,
residence time of SO
2
in the troposphere
■
5.7 Stratospheric Chemistry
In passing across the tropopause, from the tropo-
sphere to the stratosphere, there is generally an
abrupt change in concentrations of several important
trace constituents of the atmosphere. For example,
within the first few kilometers above the tropopause,
water vapor decreases and O
3
concentrations often
0.3
120.5
2 10
3
years 1 day
magnitude of
tropospheric reservoir
total influx to troposphere
0.2
To the
stratosphere
0.3
0.3
0.9
0.5
25
25
0.3
SO
4
0.5
0.7
4075103
CONTINENTS
Soils and
marshlands
7
10 73
(
(
(
(
(
(
(
(
(
(
(
(
(
(
(
(
(
(
(
(
(
(
(
(
(
(
(
(
(
(
(
(
(
(
(
(
(
(
(
(
(
(
(
(
(
(
(
(
(
(
(
(
(
(
(
(
(
(
(
(
(
(
(
(
(
(
2–
80
3
7
Volcanoes
Dry
deposition
Wet
deposition
Biomass
burning
Volcanoes
Anthropogenic
(fossil fuel
combustion)
Dry
deposition
Soils,
plants
and
industry
Biogenic Biogenic Biogenic
Soils Dry
deposition
H
2
S
[0.03 Tg(S)]
SO
4
[1.2 Tg(S)]
SO
2
[0.3 Tg(S)]
Sea-
salt
40–320
CS
2
[0.1 Tg(S)]
DMS
[0.05 Tg(S)]
COS
[2.5 Tg(S)]
2–
CONTINENTS
[2 x 10
10
Tg(S)]
OCEANS
[1.6 x 10
9
Tg(S)]
Fig. 5.15 As for Fig. 5.14 but for sulfur-containing species in the troposphere. Fluxes are in Tg(S) per year. For clarity, wet and dry
removal are shown only over the continents, although they also occur over the oceans. [Adapted from P. V. Hobbs, Introduction to
Atmospheric Chemistry, Camb. Univ. Press, 2000, p. 150. Reprinted with the permission of Cambridge University Press.]
P732951-Ch05.qxd 12/09/2005 09:05 PM Page 184
5.7 Stratospheric Chemistry 185
increase by an order of magnitude. The strong verti-
cal gradients across the tropopause reflect the fact
that there is very little vertical mixing between the
relatively moist, ozone-poor troposphere and the dry,
ozone-rich stratosphere. Within the stratosphere the
air is generally neutral or stable with respect to verti-
cal motions. Also, the removal of aerosols and trace
gases by precipitation, which is a powerful cleansing
mechanism in the troposphere, is generally absent in
the stratosphere. Consequently, materials that enter
the stratosphere (e.g., volcanic effluents, anthro-
pogenic chemicals that diffuse across the tropopause
or are carried across the tropopause by strong
updrafts in deep thunderstorms, and effluents from
aircraft) can remain there for long periods of time,
often as stratified layers.
This section discusses three topics of particular
interest in stratospheric chemistry: unperturbed
(i.e., natural) stratospheric O
3
, anthropogenic pertur-
bations to stratospheric O
3
, and sulfur in the strato-
sphere. The emphasis in this chapter is on chemical
processes. However, it should be kept in mind that
chemical, physical, and dynamical processes in the
atmosphere are often intimately entwined.
5.7.1 Unperturbed Stratospheric Ozone
a. Distribution
Ozone in the stratosphere is of great importance for
the following reasons:
• It forms a protective shield that reduces the
intensity of UV radiation (with wavelengths
between 0.23 and 0.32
m)
27,28
from the sun
that reaches the Earth’s surface.
• Because of the absorption of UV radiation
by O
3
, it determines the vertical profile of
temperature in the stratosphere.
• It is involved in many stratospheric chemical
reactions.
In 1881 Hartley
29
measured the UV radiation
reaching the Earth’s surface and found a sharp cutoff
at
0.30
m; he correctly attributed this to absorp-
tion by O
3
in the stratosphere. Subsequent ground-
based UV measurements as a function of the sun’s
elevation and the first measurements of the concen-
trations of stratospheric O
3
by balloons in the 1930s
placed the maximum O
3
concentration in the lower
part of the stratosphere.
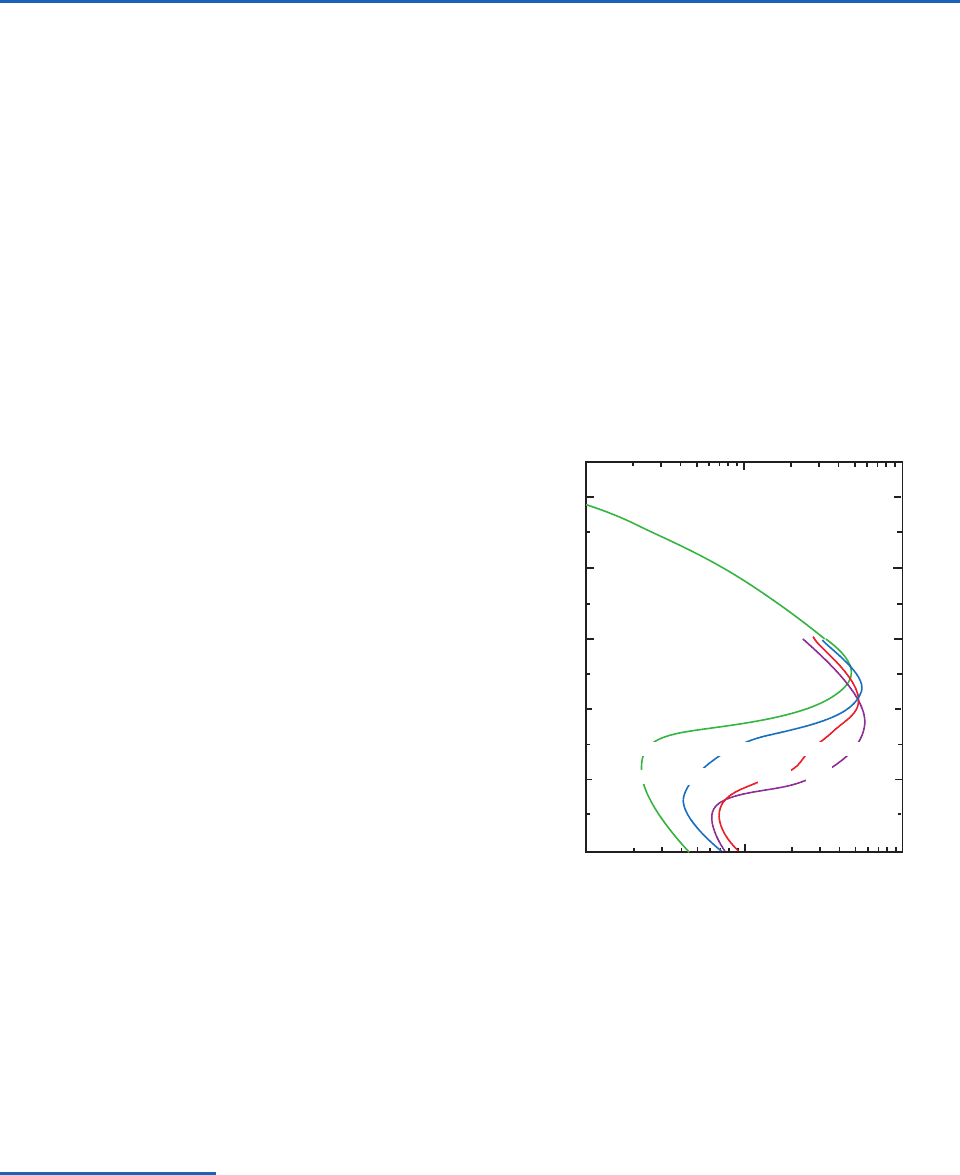
Figure 5.16 shows results of more recent measure-
ments of O
3
.The presence of an ozone layer between
heights of 15–30 km is clear. However, the O
3
layer
is highly variable: its height and intensity change
with latitude, season, and meteorological conditions.
27
Electromagnetic radiation in this wavelength range is dangerous to living cells. Radiation with a wavelength (
) 0.29
m is lethal
to lower organisms and to the cells of higher organisms. Radiation with
0.290–0.320
m (UV-B radiation), which causes sunburn,
has adverse effects on human health and on animals and plants. Were it not for O
3
in the stratosphere, radiation from the sun with
0.23–0.32
m, would reach the Earth’s surface unhindered. Ozone strongly absorbs UV radiation in just this wavelength band. For this
reason, less than 1 part in 10
30
of the flux of solar radiation at the top of the atmosphere with
0.25
m reaches the Earth’s surface.
As shown in Chapter 2, the absorption of UV radiation by O
3
was essential for the emergence of life (as we know it) on Earth.
28
It is common to use nanometers (nm; 1
m 10
3
nm) as the unit of wavelength in the ultraviolet and visible regions. However, for
consistency with earlier chapters, we use micrometers (
m).
29
W. N. Hartley (1846–1913) Irish spectroscopist. Professor of chemistry at Royal College of Science, Dublin.
50
40
30
20
10
0
Altitude (km)
10
11
10
12
10
13
Ozone concentration (molecules cm
–3
)
250 325
400
450
30°
43°
59°
DU DU DU
9°
Fig. 5.16 Mean vertical distributions of ozone concentra-
tions based on measurements at different latitudes (given
in degrees). Note the increase in the total ozone column
abundance (given in DU) with increasing latitude. [Adapted
from G. Brasseur and S. Solomon, Aeronomy of the Middle
Atmosphere, D. Reidel Pub. Co., 1984, Fig. 5.7, p. 215.
Copyright 1984 D. Reidel Pub. Co., with kind permission of
Springer Science and Business Media.]
P732951-Ch05.qxd 12/09/2005 09:05 PM Page 185

186 Atmospheric Chemistry
Figure 5.16 includes the total ozone column abun-
dance in Dobson units (DU)—see Footnote 13 in this
chapter for the definition of DU.
The greatest column densities of O
3
in the northern
hemisphere occur in polar latitudes in spring; in the
southern hemisphere the spring maximum is at mid-
latitudes. Because O
3
is produced by photochemical
reactions, the production is a maximum in the strato-
sphere over the tropics. The peaks in concentrations
at polar and midlatitudes are attributed to meridional
and downward transport of O
3
away from the equa-
tor, although at any given point in the atmosphere
the balance between the production and loss of O
3
,
and its flux divergence, determines the O
3
concentra-
tion at that point. It is clear from Fig. 5.16 that much
of the meridional contrast in the total column abun-
dance of O
3
is due to differences in the profiles below
20 km, which are largely determined by transport.
Since 1960 remote sensing measurements from satel-
lites (see Box 5.5) have provided a wealth of informa-
tion on the global distribution of O
3
and the variations
in its vertical profiles and column abundance.
In situ measurements of vertical profiles of O
3
may
be obtained from ozonesondes, which can be car-
ried on radiosonde balloons. The O
3
sensor consists
of two electrolytic cells, each containing a solution
of potassium iodide (KI). The cells are initially in
chemical and electrical equilibrium. However,
when an air sample containing O
3
is drawn through
one of the cells, the equilibrium is perturbed and an
electric current flows between the cells. The amount
of electric charge, which is proportional to the par-
tial pressure of the O
3
in the ambient air, is contin-
uously transmitted to a ground station along with
the ambient pressure and temperature. In this way,
a vertical profile of O
3
is obtained, the integration
of which provides the O
3
column from ground level
up to the height of the balloon.
The O
3
column from the ground to the top of
the atmosphere can be measured by passive remote
sensing using a Dobson spectrophotometer.This
is done by measuring the amount of UV sunlight
that reaches the ground and deducing from
this how much UV absorption occurred due to
O
3
. Absorption by O
3
occurs in the UV-B region
(
0.290–0.320
m). However, clouds and some
aerosol particles also absorb in this wavelength
band. Therefore, a region of the electromagnetic
spectrum where O
3
absorbs only weakly, but
clouds and aerosol absorb similarly to the UV-B
region, is also monitored. By ratioing the two
measured values, absorption by O
3
in the total
vertical column can be obtained.
Ozone can be derived from satellite observations
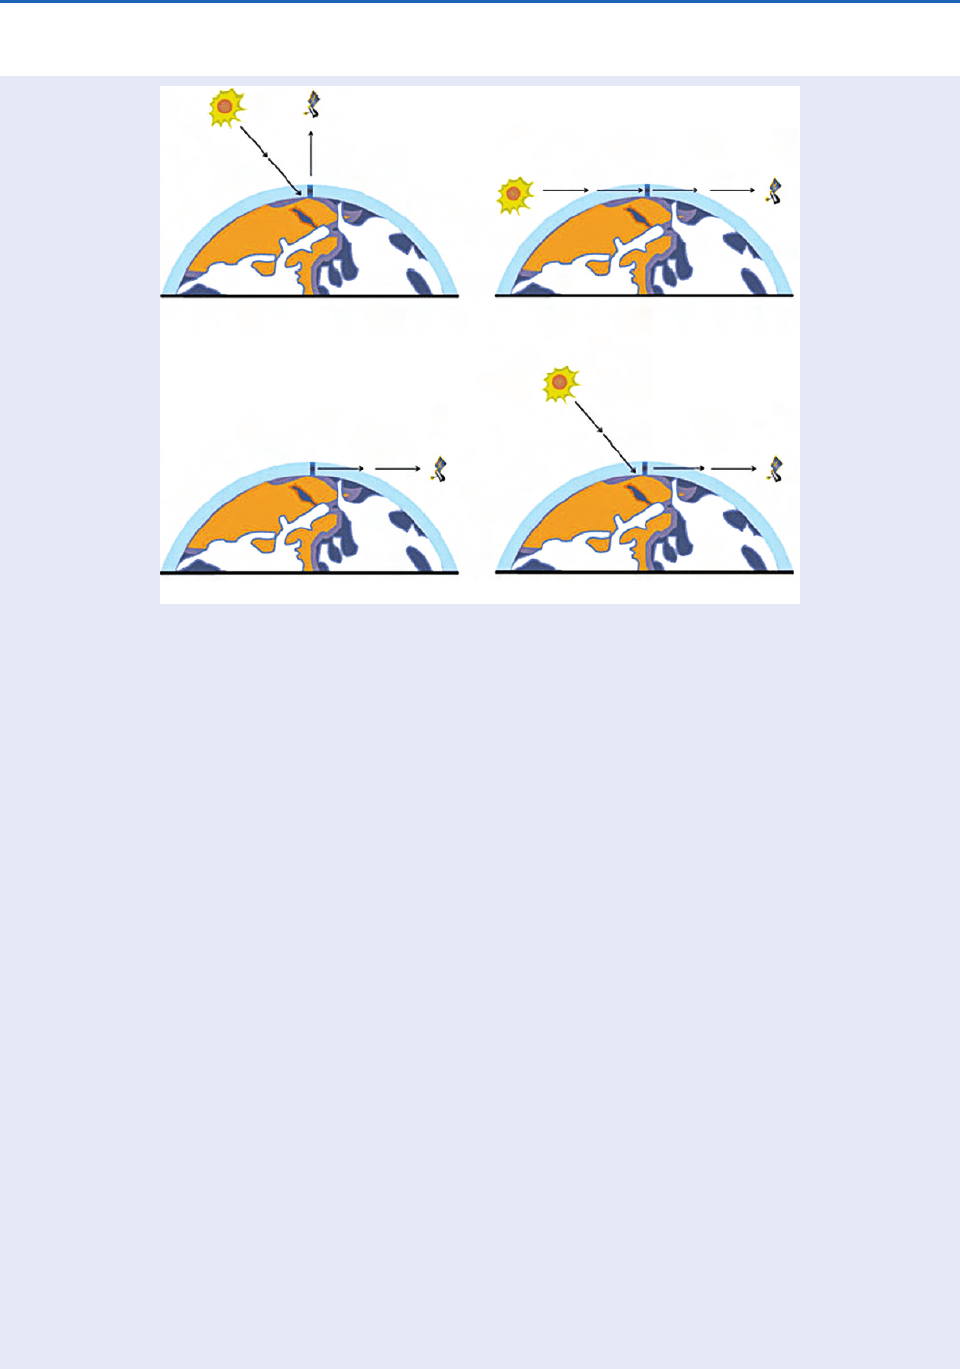
using any of the four passive techniques depicted
in Fig. 5.17, namely by backscatter UV(BUV),
occultation, limb emission, and limb scattering.
For determination of the total O
3
column by the
BUV technique (Fig. 5.17a), two pairs of measure-
ments are needed: the incoming UV irradiance and
the backscattered UV radiance at a wavelength that
is strongly absorbed by O
3
and a similar pair of
measurements at a wavelength that is absorbed only
weakly by O
3
.The difference between these two
pairs of measurements can be used to infer the total
O
3
column. Vertical profiles of O
3
can be obtained
using the BUV technique. Because O
3
absorbs more
strongly at shorter wavelengths, solar radiation with
progressively shorter wavelengths is absorbed at
progressively higher altitudes. Therefore, the radia-
tion at a particular wavelength in the UV can be
scattered only above a certain height. By measuring
backscattered radiation at a number of wavelengths,
the vertical profile of O
3
can be deduced.
Occultation instruments measure radiation
through the limb of the atmosphere (see Fig. 5.17b)
when the sun, moon, or a star is rising or setting.
From measurements of the amounts of radiation at
various wavelengths absorbed by the atmosphere,
vertical profiles of various trace constituents
can be derived. This technique has been used to
monitor O
3
since 1984.
In the limb emission technique, the concentration
of O
3
is derived from measurements of infrared or
microwave radiation emitted by the atmosphere
along the line of sight of the instrument (Fig. 5.17c).
Limb infrared emissions can be used to derive tem-
perature, O
3
,H
2
O(g), CH
4
,N
2
O, NO
2
, CFCs, and
the location of polar stratospheric clouds in the
upper atmosphere. The advantage of utilizing
microwave emission is that it passes through clouds
and therefore can provide measurements lower in
5.5 Techniques for Measuring Atmospheric Ozone
Continued on next page
P732951-Ch05.qxd 12/09/2005 09:05 PM Page 186
5.7 Stratospheric Chemistry 187
Fig. 5.17 Four passive techniques for measuring ozone from satellites. [Courtesy of P. Newman, NASA Goddard Space
Flight Center.]
the atmosphere than infrared emissions. However,
microwave detectors are large, heavy, and require
more power than infrared detectors.
Limb scattering (Fig. 5.17d) employs aspects
of the three passive remote sensing techniques
discussed briefly earlier. However, it measures
scattered light rather than light directly from the
sun or moon. Consequently, if the sun is visible,
this technique can provide essentially continuous
measurements. Limb scattering works best with
O
3
, but H
2
O(g), NO
2
,SO
2
, and aerosols can also
be measured.
Ozone profiles (as well as those of other trace
constituents) can be obtained using differential
absorption lidar (DIAL), which is an active remote
sensing technique. The radiation source is a power-
ful lidar. A telescope, generally located near the
laser, is used to collect the radiation backscattered
by the atmosphere along the line of sight of the lidar
beam. The time interval between transmission of a
pulse and its return can be used to determine the
range of the scatterers. The attenuation of the beam
provides information on atmospheric trace con-
stituents. Differences between transmitted and
returned wavelengths produced by the Doppler
5.5 Continued
effect can be used to infer atmospheric motions. As
in the BUV technique, the ratio of two returned sig-
nals can be used to deduce the concentration of the
species. This technique can provide measurements
with high spatial resolution in the vertical. Because
DIAL instruments are large and heavy, they have
generally been used only from the ground.
The advantage of satellite-born instruments
is their extensive spatial coverage over relatively
long time periods. Disadvantages are that the
measurements of trace constituents are not direct
(they have to be derived from radiation measure-
ments) and typically they do not have very high
spatial resolution. Remote sensing measurements
from the ground can be continuous, but each
instrument is generally located at one site.
Remote sensing measurements from aircraft pro-
vide mobility and better spatial resolution in the
vertical. In situ measurements (from aircraft and
balloons) are generally more direct, they can be
related to chemical standards, and they can pro-
vide high spatial resolution. However, they are
inherently very intermittent. Airborne in situ
measurements have been used extensively to vali-
date satellite measurements.
(a) Backscatter ultraviolet (b) Occultation
(c) Limb emission (d) Limb scattering
satellite
satellite
satellite
satellite
P732951-Ch05.qxd 12/09/2005 09:05 PM Page 187

188 Atmospheric Chemistry
b. Chapman’s theory
In 1930 Chapman
30
proposed a simple chemical
scheme for maintaining steady-state concentrations
of O
3
in an “oxygen-only” (i.e., O, O
2
, and O
3
) strato-
sphere. The reactions were the dissociation of O
2
by
solar UV radiation (at
0.242
m)
(5.43)
the reaction of atomic oxygen and molecular oxygen
to form O
3
(5.44)
(where M represents N
2
and O
2
), the photodissociation
of O
3
(which occurs for
0.366
m)
(5.45)
and the combination of atomic oxygen and O
3
to
form O
2
(5.46)
Reactions (5.43)–(5.46) are called the Chapman
reactions.The rate coefficients (j’s and k’s) are tem-
perature dependent.
The O atoms produced by (5.43) undergo numerous
collisions with N
2
and O
2
molecules, most of which do
not result in any permanent products. Occasionally,
however, a three-body collision occurs [as represented
by the left side of (5.44)] in which M absorbs the excess
energy of the collision and a stable O
3
molecule is pro-
duced. Note that the excess energy acquired by M,
which is in the form of thermal energy that warms the
stratosphere, derives primarily from the energy of
the photon in (5.43), i.e., from solar energy. Because
the concentration of M decreases with increasing
altitude, the time constant for converting O atoms and
O
2
molecules to O
3
by (5.44) increases with altitude
(e.g., from a few seconds at 40 km to 100 s at 50 km).
After it is formed, the O
3
molecule remains intact
until it is split apart by the photolytic reaction (5.45).
Reactions (5.44) and (5.45) are fast and they continu-
ally cycle oxygen atoms back and forth between O and
O
3
. Ozone molecules are removed from the system by
(5.46). The time constant for this reaction is 1 day
at 40 km and a fraction of a day at 50 km (where the
O O
3
:
k
d
2O
2
O
3
h
:
j
c
O
2
O
O O
2
M :
k
b
O
3
M
O
2
h
:
j
a
2O
concentration of O atoms is greater). This reaction
can take place as given by (5.46) or it can be catalyt-
ically accelerated (e.g., by chlorine or bromine), as
discussed in Section 5.7.1c. A simplified schematic of
the Chapman reactions is shown in Fig. 5.18.
Stratospheric O
3
concentrations exhibit minor diur-
nal variations with time of day. After sunset, both the
source and the sink of O
3
(5.43) and (5.45), respect-
ively, are switched off, and the remaining O atoms
are then converted to O
3
within a minute or so by
(5.44). When the sun rises, some of the O
3
molecules
are destroyed by (5.45) but they are reformed by
(5.43) followed by (5.44).
Exercise 5.10 During the daytime in the strato-
sphere a steady-state concentration of atomic oxygen
may be assumed. Use this fact to derive an expression
for dn
3
dt in terms of n
1
, n
2
, n
3
, k
d
, and j
a
, where n
1
,
n
2
,and n
3
are the concentrations of atomic oxygen,
molecular oxygen, and ozone, respectively. Assuming
that the removal of atomic oxygen by (5.46) is small,
and (at 30 km) j
c
n
3
j
a
n
2
, derive an expression
for the steady-state concentration of atomic oxygen
in the stratosphere at 30 km during the daytime in
terms of n
2
, n
3
, n
M
, k
b
,and j
c
,where n
M
is the concen-
tration of M in (5.44). Hence, derive an expression
for dn
3
dt in terms of n
2
, n
3
, n
M
, j
a
, j
c
, k
b
, and k
d
.
Solution: From (5.43)–(5.46)
(5.47)
If atomic oxygen is in steady-state dn
1
dt 0, and
(5.48)2j
a
n
2
j
c
n
3
k
b
n
1
n
2
n
M
k
d
n
1
n
3
dn
1
dt
2j
a
n
2
k
b
n
1
n
2
n
M
j
c
n
3
k
d
n
1
n
3
O
2
O + O
3
hν
O
2
+ M
O
3
O
ODD
OXYGEN
fast
fast
slow
slow
hν
Fig. 5.18 Schematic of the Chapman reactions. [Adapted
from The Chemistry and Physics of Stratospheric Ozone, A. Dessler,
Academic Press, p. 44, copyright (2000), with permission
from Elsevier.]
30
Sydney Chapman (1888–1970) English geophysicist. Chapman made important contributions to a wide range of geophysical
problems, including geomagnetism, space physics, photochemistry, and diffusion and convection in the atmosphere.
P732951-Ch05.qxd 12/09/2005 09:05 PM Page 188

5.7 Stratospheric Chemistry 189
From (5.44)–(5.46)
(5.49)
From (5.48) and (5.49)
(5.50)
If the removal of atomic oxygen by (5.46) is small, we
have from (5.47)
(5.51)
Therefore, since dn
1
dt 0 and j
c
n
3
2j
a
n
2
,
(5.52)
Substituting (5.52) into (5.50) yields
(5.53)
■
The Chapman reactions reproduce some of the
broad features of the vertical distribution of O
3
in the stratosphere. For example, they predict that
O
3
concentrations should reach maximum values at
an altitude of 25 km. Indeed, prior to 1964 it was
generally believed that the Chapman theory pro-
vided an adequate description of stratospheric ozone
chemistry. This is now known not to be the case.
For example, although the Chapman reactions pre-
dict the correct shape for the vertical profile of O
3
,
they overpredict the concentrations of stratospheric
O
3
by about a factor of two in the tropics and
they underpredict O
3
concentration in middle to
high latitudes. Also, model calculations based on the
Chapman reactions predict that the global rate of pro-
duction of O
3
in spring is 4.86 10
31
molecules s
1
(of which 0.06 10
31
molecules s
1
are transported
to the troposphere). However, the loss of “odd oxy-
gen” is only 0.89 10
31
molecules s
1
.This leaves a
net 3.91 10
31
molecules s
1
, which would double
atmospheric O
3
concentrations in just 2 weeks.
31
Because O
3
concentrations are not increasing, there
must be important sinks of odd oxygen in the strato-
dn
3
dt
2j
a
n
2
2k
d
j
c
n
3
2
k
b
n
2
n
M
n
1
j
c
n
3
k
b
n
2
n
M
dn
1
dt
2j
a
n
2
k
b
n
1
n
2
n
M
j
c
n
3
dn
3
dt
2j
a
n
2
2k
d
n
1
n
3
dn
3
dt
k
b
n
1
n
2
n
M
j
c
n
3
k
d
n
1
n
3
sphere in addition to reaction (5.46). As shown later,
there are catalytic cycles involving nitrogen com-
pounds, H, OH, Cl, and Br that deplete O
3
in the
stratosphere. Also, there is an equator-to-pole circu-
lation in the stratosphere, sometimes referred to as
the Brewer–Dobson circulation, which transports O
3
from its primary source in the tropical stratosphere
poleward and downward into the extratropical lower
stratosphere.
c. Catalytic chemical cycles
Most of the catalytic reactions that have been pro-
posed for the removal of stratospheric odd oxygen
are of the form
(5.54a)
(5.54b)
Net: (5.55)
where X represents the catalyst and XO the inter-
mediate product. Provided that reactions (5.54) are
fast, reaction (5.55) can proceed much faster than
reaction (5.46). Also, because X is consumed in
(5.54a) but regenerated in reaction (5.54b) and pro-
vided there is no appreciable sink for X, just a few
molecules of X have the potential to eliminate large
numbers of O
3
molecules and atomic oxygen.
The first candidate that was suggested for species
X in (5.54) in the upper atmosphere (actually in the
mesosphere where excited atomic oxygen is common)
was OH, which has at least three sources
(5.56)
(5.57)
and
(5.58)
The H
2
O and CH
4
in (5.56) and (5.57) ascend into
the stratosphere in the tropics. During the passage
through the cold tropical tropopause, most of the
water vapor condenses out, which accounts for the
H
2
O* : H OH
CH
4
O* : CH
3
OH
H
2
O O* : 2OH
O O
3
: 2O
2
XO O : X O
2
X O
3
: XO O
2
31
In the Chapman reactions, odd oxygen is produced only by reaction (5.43) and is lost only in reaction (5.46). Reactions (5.44) and
(5.45) intraconvert atomic oxygen and O
3
and determine the ratio [O][O
3
]; both reactions are fast during the day. Therefore, atomic oxygen
and O
3
are interconverted rapidly, as shown in Fig. 5.18. Below about 45 km in the stratosphere, O
3
accounts for 99% of the odd oxygen.
P732951-Ch05.qxd 12/09/2005 09:05 PM Page 189

190 Atmospheric Chemistry
dryness of the stratosphere. However, CH
4
is not
affected by the low temperatures and is therefore
lofted into the lower stratosphere in concentrations
similar to those in the upper troposphere.
Below 40 km the OH from (5.56)–(5.58) acts as
catalyst X in (5.54) to destroy odd oxygen
(5.59a)
(5.59b)
Net: (5.60)
Below 30 km, where atomic oxygen is very scarce,
the following catalytic cycle, which destroys O
3
,is
increasingly important
(5.61a)
(5.61b)
Net: (5.62)
A catalytic cycle that is important for the destruc-
tion of O
3
in the middle stratosphere is
(5.63a)
(5.63b)
Net: (5.64)
where NO has replaced X in (5.54). Nitric oxide
(NO) is produced in the stratosphere by
(5.65)
At a temperature of 53 °C (which is typical of
the stratosphere), the rate coefficients for reactions
(5.63a) and (5.63b) are 3.5 10
21
and 9.3
10
18
m
3
molecules
1
s
1
, respectively, compared
to 6.8 10
22
m
3
molecules
1
s
1
for k
d
in (5.46).
Whether reactions (5.63a) and (5.63b) destroy odd
oxygen faster than reaction (5.46) depends on the
concentrations of NO
2
and O
3
.
In the 1970s it was suggested that catalytic cycles
involving reactive chlorine (Cl) and bromine (Br)
could be important in the destruction of O
3
.The
natural sources of Cl and Br in the stratosphere
are the destruction of methyl chloride (CH
3
Cl) and
methyl bromide (CH
3
Br), respectively. Chlorine and
Br can then serve as X in (5.54), with intermediates
N
2
O O* : 2NO
O O
3
: 2O
2
NO
2
O : NO O
2
NO O
3
: NO
2
O
2
2O
3
: 3O
2
HO
2
O
3
: OH 2O
2
OH O
3
: HO
2
O
2
O O
3
: 2O
2
HO
2
O : OH O
2
OH O
3
: HO
2
O
2
ClO and BrO, respectively. The following cycle of
reactions, which couple these two intermediates,
(5.66a)
(5.66b)
(5.66c)
Net: (5.67)
is a more powerful mechanism for destroying O
3
in
the lower stratosphere than those discussed previ-
ously because O
3
is much more abundant than atomic
oxygen. Because the stable reservoirs for Br and BrO
(i.e., BrONO
2
and HOBr) are not as stable as the
reservoirs for Cl and ClO (i.e., HCl and ClONO
2
) on
a per molecule basis, Br is more efficient in destroy-
ing O
3
than Cl.
The destruction of stratospheric O
3
by the various
chemical mechanisms discussed earlier, and many
other possible mechanisms not discussed here are
not simply additive because, as illustrated by (5.66),
the species in one cycle can react with those in
another cycle. Therefore, advanced numerical models
that consider all of the known suspects and that
utilize measurements of species concentrations and
temperature-dependent rate coefficients must be used
to unravel the relative importance of the various
mechanisms for destroying O
3
in the stratosphere.
This task is complicated further by the fact that
concentrations of many of the prime suspects are
changing with time due to anthropogenic emissions
(see Section 5.7.2).
5.7.2 Anthropogenic Perturbations to
Stratospheric Ozone: The Ozone Hole
If the concentration of catalyst X in (5.54) is
increased significantly by human activities, the bal-
ance between the sources and sinks of atmospheric
O
3
will be disturbed and stratospheric O
3
concen-
trations can be expected to decrease. One of the
first concerns in this respect was raised in response
to a proposal in the 1970s to build a fleet of super-
sonic aircraft flying in the stratosphere. It was noted
that aircraft engines emit nitric oxide (NO), which
can decrease odd oxygen by the cycle (5.63). The
proposal was eventually rejected on both envi-
ronmental and economic grounds. At the time of
writing (2005), there are not sufficient aircraft flying
2O
3
: 2O
2
Cl O
3
: ClO O
2
Br O
3
: BrO O
2
BrO ClO : Br Cl O
2
P732951-Ch05.qxd 12/09/2005 09:05 PM Page 190

5.7 Stratospheric Chemistry 191
in the stratosphere to significantly perturb stratos-
pheric O
3
.
Of much greater concern, with documented
impacts, is the catalytic action of chlorine, from indus-
trially manufactured chlorofluorocarbons (CFCs),
in depleting stratospheric ozone.
32
CFCs are com-
pounds containing Cl, F, and C; CFC-11 (CFCl
3
)
and CFC-12 (CF
2
Cl
2
) are the most common.
33
CFCs
were first synthesized in 1928 as the result of a search
for a nontoxic, nonflammable refrigerant. Over the
next half-century they were marketed under the trade
name Freon and became widely used, not only as
refrigerants, but as propellants in aerosol cans, inflat-
ing agents in foam materials, solvents, and cleansing
agents. Concern about their effects on the atmos-
phere began in 1973 when it was found that CFCs
were spreading globally and, because of their inert-
ness, were expected to have residence times ranging
up to several hundred years in the troposphere.
Such long-lived compounds eventually find their way
into the stratosphere
34
where, at altitudes 20 km,
they absorb UV radiation in the wavelength interval
0.19–0.22
m and photodissociate
(5.68)
and
(5.69)
The chlorine atom released by these reactions can
serve as the catalyst X in cycle (5.54), thereby
destroying odd oxygen in the cycle
(5.70a)
(5.70b)
Net: (5.71) O
3
O : 2O
2
ClO O : Cl O
2
Cl O
3
: ClO O
2
CF
2
Cl
2
h
: CF
2
Cl Cl
CFCl
3
h
: CFCl
2
Cl
In 1990, 85% of the chlorine in the stratosphere
originated from anthropogenic sources. Because
CFCs absorb strongly in the infrared, they are also
significant greenhouse gases.
The first evidence of a significant depletion in
stratospheric O
3
produced by anthropogenic chemicals
in the stratosphere came, surprisingly, from measure-
ments in the Antarctic. In 1985, British scientists, who
had been making ground-based, remote sensing meas-
urements of O
3
at Halley Bay (76 °S) in the Antarctic
for many years, reported a 30% decrease in springtime
(october) total column O
3
since 1977. These observa-
tions were subsequently confirmed by remote sensing
measurements from satellite and by airborne in situ
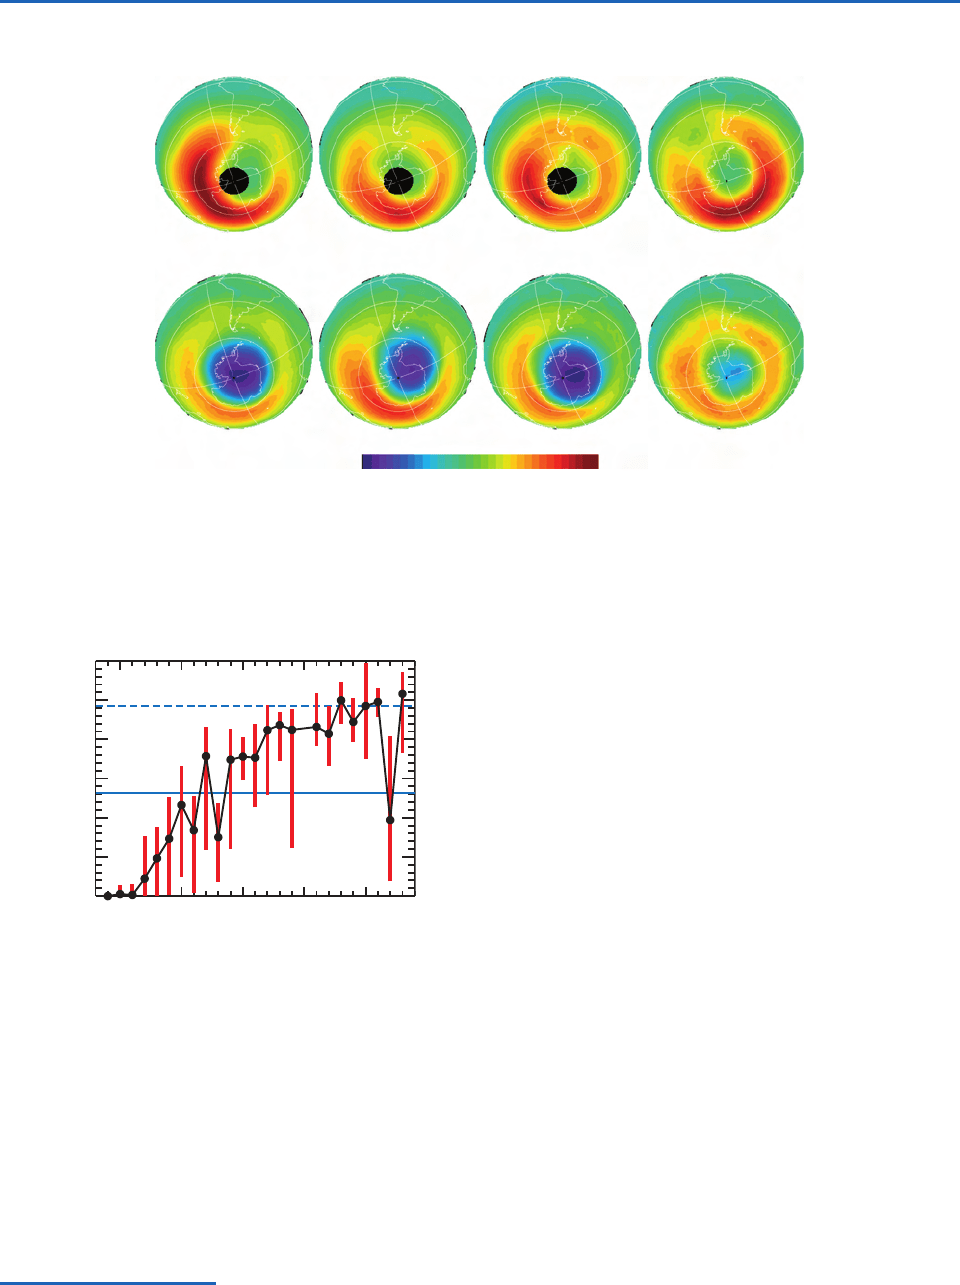
measurements. Shown in Fig. 5.19 are a series of satel-
lite measurements of the total O
3
column in the south-
ern hemisphere. The high O
3
values (red and orange
colors) that encircle the Antarctic continent and the
lower O
3
values (green) over the continent itself in the
1970s (upper four images) are considered to be close
to natural. The Antarctic ozone hole, as it came to be
called, is apparent in the lower four images in Fig. 5.19
as the anomalously low O
3
values (purple) over the
continent in October from 1999 to 2002.
The areal extent of the Antarctic ozone hole,
derived from satellite measurements for the period
September 7 to October 13 1979–2003, are shown in
Fig. 5.20. From 1979 to 2001 the ozone hole grew pro-
gressively until it occupied an area (25 million km
2
)
similar to that of North America. However, in 2002
the area occupied by the ozone hole decreased dra-
matically, but returned to its former size in 2003; the
reasons for these dramatic changes are discussed
later in this chapter.
The presence of an ozone hole over the Antarctic
raised several intriguing questions. Why over the
Antarctic? Why during spring? Why was the magnitude
of the measured decreases in O
3
much greater than
predictions based solely on gas-phase chemistry of the
32
In 1995, Paul Crutzen, Mario Molina, and Sherwood Rowland were awarded the Nobel Prize in chemistry for predicting stratos-
pheric O
3
loss by CFCs and nitrogen-containing gases.
33
Compounds containing H, F, and C are called hydrofluorocarbons (HFCs), and compounds containing H, Cl, F, and C are called
hydrochlorofluorocarbons (HCFCs). HFCs and HCFCs are considered to be more “environmentally friendly” than CFCs because they are
partially destroyed by OH in the troposphere.
34
Long-lived compounds enter the stratosphere primarily in air that ascends through the tropical tropopause. After entering
the lower stratosphere the compounds are carried by the Brewer–Dobson circulation to higher altitudes (where they are broken
down photolytically) or to higher latitudes. On average, it takes a year or two for a CFC molecule to move from the tropical tropo-
sphere to the upper stratosphere. However, it takes several decades for all of the air in the troposphere to be cycled through the upper
stratosphere.
P732951-Ch05.qxd 12/09/2005 09:05 PM Page 191
192 Atmospheric Chemistry
type outlined earlier? Why was the size of the ozone
hole so much less in 2002 than in other recent years?
The research that led to the answers to these questions,
which is outlined later, was one of the triumphs of
20th century science.
During the austral winter (June–September),
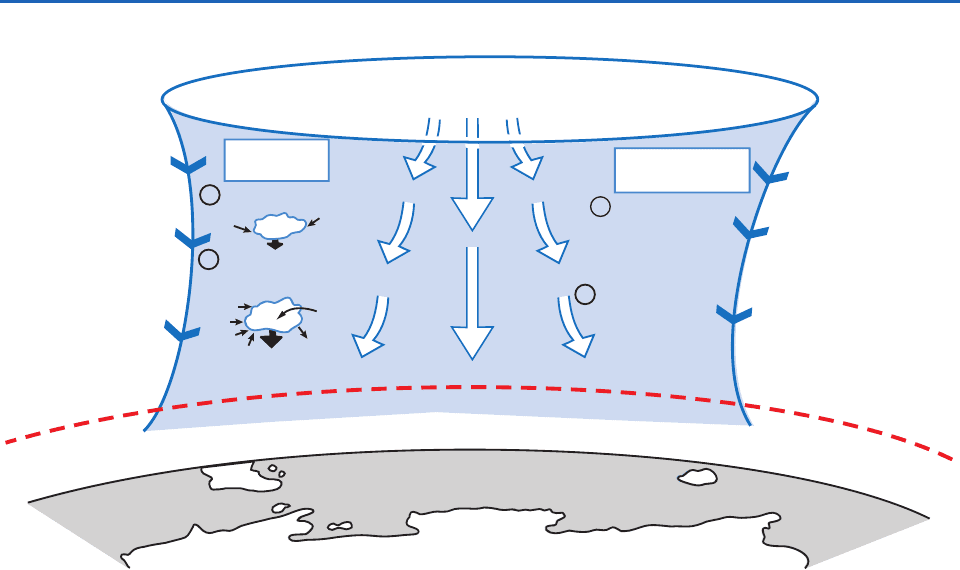
stratospheric air over the Antarctic continent is
restricted from interacting with air from lower lati-
tudes by a large-scale vortex circulation, which is
bounded at its perimeter (called the vortex collar) by
strong westerly winds encircling the pole. Because of
the lack of solar heating in the austral winter, the air
within the vortex is extremely cold and it lies within
the sinking branch of the Brewer–Dobson circulation
(Fig. 5.21). High-level clouds, called polar stratospheric
clouds (PSCs), form in the cold core of the vortex,
where temperatures can fall below 80 °C.
35
In the
austral spring, as temperatures rise, the winds around
the vortex weaken, and by late December the vortex
disappears. However, during winter, the vortex serves
as a giant and relatively isolated chemical reactor
in which unique chemistry can occur. For example,
Oct. 00 Oct. 01 Oct. 02Oct. 99
Oct. 71 Oct. 72 Oct. 79Oct. 70
Total Ozone (DU)
500.
120.
Fig. 5.19 Satellite observations of the total ozone column in the southern hemisphere during October for 8 years from 1970 to
2002. The color scale is in Dobson units (DU). The small black circles over the pole in 1970, 1971, and 1972 are a reflection of
missing data. [Courtesy P. Newman, NASA Goddard Space Flight Center.]
1980 1985 1990 1995 2000
0
5
10
15
20
25
30
Size (Million km
2
)
Antarctica area
North America area
Fig. 5.20 Average areal extent of the ozone hole (defined
as less than 220 Dobson units) averaged from September
7–October 13 of each year from 1979 to 2003. Vertical red
bars are the range of values for each period. Year-to-year
variations are caused by temperature fluctuations near the
polar vortex edge. Warmer years have smaller holes (e.g.,
2002), whereas colder years have larger ozone holes
(e.g., 2003). The blue horizontal line highlights the total area
of the Antarctic continent; for comparison, the area of North
America (dashed blue line) is about twice the area of
Antarctica. (Courtesy of P. Newman, NASA Goddard Space
Flight Center.)
35
During the drift of the Deutschland in the Weddell Sea in 1912, PSCs were observed in the late winter and early spring. Also, the
Norwegian–British–Swedish 1949–1952 expedition to the Antarctic frequently observed a thin “cloud-veil” in the lower stratosphere in
winter months. However, the widespread nature and periodicity of PSC formation in the Antarctic were not fully appreciated until they
were observed by satellites starting in 1979.
P732951-Ch05.qxd 12/09/2005 09:05 PM Page 192
5.7 Stratospheric Chemistry 193
although the concentrations of O
3
in the vortex
are normal in August, the concentrations of ClO in the
vortex are 10 times greater than just outside the vor-
tex collar. In September, when sunlight returns to the
polar cap region, O
3
concentrations within the vortex
decrease dramatically. There are also sharp decreases
in the concentrations of oxides of nitrogen and water
vapor when passing from the outside to the inside of
the vortex collar. These decreases are due, respectively,
to the formation of nitric acid (HNO
3
) and to the con-
densation of water at the very low temperatures inside
the vortex. These two condensates form three types of
PSCs. Type I PSCs, which condense near 78 °C, prob-
ably consist of a mixture of liquid and solid particles of
nitric acid trihydrate (HNO
3
(H
2
O)
3
—NAT for short),
water and sulfuric acid. These particles are 1
m
in diameter, so they settle out very slowly (10 m
per day). Type II PSCs, which form near 85 °C, con-
sist of a mixture of ice and water together with some
dissolved HNO
3
. Because these particles are 10
m
in diameter, they settle out with appreciable speeds
(1.5 km per day). Type III PSCs (“mother-of-pearl”
clouds) are produced by the rapid freezing of con-
densed water in air flow over topography. However,
they are of limited extent and duration and do not
form over the South Pole.
As the particles in PSCs slowly sink, they remove
both water and nitrogen compounds from the strato-
sphere, processes referred to as dehydration and
denitrification, respectively. As we will see, the chemi-
cal reactions involved in the removal of these two
species play an important role in depleting O
3
in the
Antarctic vortex.
Although (5.70) is important in destroying O
3
in
the middle and upper stratosphere, it is less important
in the lower stratosphere (accounting for 5–25%
of the total loss of halogens there) because the con-
centration of atomic oxygen decreases with decreas-
ing altitude in the stratosphere and because most of
the Cl and ClO released into the stratosphere by
(5.68)–(5.70) are quickly tied up in reservoirs as HCl
and chlorine nitrate ClONO
2
by
(5.72)
and
(5.73)
Liberation of the active Cl atoms from the reservoir
species HCl and ClONO
2
is generally slow. However,
on the surface of the ice particles that form PSCs, the
ClO NO
2
M : ClONO
2
M
Cl CH
4
: HCl CH
3
H
2
O
HNO
3
H
2
O
HNO
3
ClONO
2
HOCl
N
2
O
5
Cl
2
, HOCl
HCl
During
polar night
Following
sunrise in spring
~
9
k
m
Antarctica
South
America
Tasmania
P
O
L
A
R
V
O
R
T
E
X
(
c
o
l
d
(
–
8
0
°
C
)
a
n
d
i
s
o
l
a
t
e
d
)
Formation of PSCs
Release of Cl
2
and HOCl
Formation
of ClO and Cl
(eqns. (5.84)–(5.87))
Catalytic depletion
of O
3
(eqns. (5.88)–(5.89))
~25 km ~30 hPa
T
r
o
p
o
s
p
h
e
r
e
S
t
r
a
t
o
s
p
h
e
r
e
(eqns. (5.79)–(5.83))
4
1
3
2
Denitrification and
dehydration
~
2
0
0
h
P
a
and (ClO)
2
(eqn. (5.88))
Fig. 5.21 Schematic of the polar vortex (blue) over Antarctica. Large arrows indicate cold descending air. The sequence of events
(1 through 4) leading to the Antarctic ozone hole is summarized. For clarity, bromine reactions are not shown. See text for details.
P732951-Ch05.qxd 12/09/2005 09:05 PM Page 193