Wunderlich W. (ed.). Ceramic Materials
Подождите немного. Документ загружается.


Surface quality controls mechanical strength and
fatigue lifetime of dental ceramics and resin composites 183
where
0
is the scale parameter (P
F
= 63.2%) and m is the Weibull modulus, respectively
(Weibull, 1951; Drummond & Mieschke, 1991). The strength data were evaluated according
to the two parameter cumulative Weibull distribution by plotting the fracture probability P
F
versus fracture strength
c
.
0
1
ln ln ln ln
1
c
F
m m
P
(4)
The parameters m und
0
were determined by a maximum likelihood approach. The slope
of the regression line within the Weibull plot ln (ln (1/(1 - P
F
))) versus ln
c
indicates the
Weibull modulus m and is an indicator for the material homogeneity. The scale parameter
0
represents the strength at a failure probability of P
F
= 63.2%. However, for reliable use in
dentistry the limits for fracture strength are recommended to be set at a failure probability
of P
F
= 5% (Annusavice & Brennan, 1996). Fracture strength for IEM, EMP, and TEC and
dynamic fatigue measurements for IEM were carried out using the 4-point bending
technique in a universal testing machine (Z 2.5, Zwick, Germany) according to the European
standard EN 843. To ensure inert conditions, the specimens (n=25 per group) were dry
stored for 24 h prior to measurements. A constant loading rate d/dt of 130 MPas
-1
was
applied. The groups among each other were analyzed using the non-parametric Mann-
Whitney U-Test ( = 0.05; SPSS 14.0 for Windows). However, to generate significant
differences between the tested groups a Bonferroni correction was applied.
The subcritical crack growth parameters n and A were determined by means of dynamic
fatigue, in which the strength of bend specimens is measured as a function of distinct
loading rates d/dt:
1 2
( 1)
n n
c
t
d
B n
d
(5)
where is the fracture strength at a given loading rate d/dt: [
f
= f (d/dt:)] and
c
the
inert strength at very high loading rates ( =
c
). The parameters n and A were determined
by linear regression analysis from the plot log
f
versus log d/dt (Peterlik, 1994). The
parameter n and A represent the slope and site of the regression line. The extrapolated crack
velocity A is calculated as a function of the constant B (Munz & Fett, 1999):
2 2
2
2
n
Ic
B
A Y n K
(6)
To calculate A, literature values for fracture toughness (IEM: K
Ic
= 1.29 MPam
0.5
) and for the
function of crack shape (Y =
0.5
) were taken reference (Seghi et al., 1995).
Four dynamic fatigue tests at decreasing loading rates d/dt from 1.3 to 0.0013 MPas
-1
were
carried out in distilled water at 37°C.
With the knowledge of the slow crack growth parameters n and A, it is possible to calculate
lifetime for certain loading conditions (Munz & Fett, 1999; Sudreau et al., 1994). For a crack
growth mechanism based on static loading ( = const.) the lifetime t
f
is given as (Ritchie &
Dauskardt, 1991)
2n n
c
f const
t B
(7)
Merging a material’s lifetime with its parameters m and
0
of the Weibull distribution it
becomes possible to define critical conditions for lifetime or loading strength at a given
failure probability P
F
. Those distributions may help to select a suitable dental ceramic for a
reliable design of specific indications. Chadwick, for example, derived comparable relations
for resin composite materials (Chadwick, 1994). On the other hand, by knowledge of clinical
failure rates or lifetimes it is possible to establish a threshold value representing a maximum
load to failure.
Fracture toughness
In order to calculate the fracture toughness K
Ic
for the materials EMP and TEC, the
measurement of surface hardness, elastic modulus and material density was necessary.
Material density was
measured according to Archimedes’ principles of buoyancy and
surface hardness H by Vickers indentation technique according to
2
P
H
b
(8)
where P is the applied load and b is the average indentation half-diagonal of the Vickers
indentation (Anstis et al., 1981). The elastic modulus E was
measured by ultrasound velocity
method (Halmshaw, 1991). Here, the characteristic time delay of sound velocity µ through a
material was measured and related to the elastic modulus
2
1 1 2
1
E
(9)
with the material inherent Poisson ratio .
The indentation fracture technique (IF) was used to calculate the fracture toughness (Anstis
et al., 1981). Flaws of controlled size, shape and location were
introduced into the sample
surface by Vickers indentations at supercritical indentation loads P
c
. Direct measurement of
radial crack lengths w led to characterization of the fracture process and thus to calculation
of fracture toughness K
Ic
through (Scherrer et al., 1998; Albakry et al., 2003):
0.5
1.5
0.016 / /
Ic c
K E H P w
(10)
Material property data for the resin composite and for the glass ceramic material are
summarized in Table 2. Inserting the fracture toughness values in eq. 1, critical flaw sizes a
c
can be calculated depending on the test group specific fracture strength
c
.

Ceramic Materials 184
*: (Anstis et al., 1981) **: (Fujishima & Ferracane, 1996) ***: (Chung et al., 2004)
Table 2. Mechanical properties of the test materials, required for calculation of fracture
toughness.
Fractographic examinations were performed under a light microscope (SV11, Zeiss,
Germany) on all specimens and under a SEM (Leitz ISI SR 50, Akashi, Japan) on
representative samples.
Results
Fracture strength, slow crack growth and lifetime
The characteristic fracture strengths
0
for IEM, EMP, and TEC at a failure probability P
F
= 63,2
%, their Weibull moduli m and the calculated fracture releasing critical flaw sizes are given in
Table 1. The crack lengths a
c
were calculated according to eq. 1 inserting the related strength
c
and fracture toughness K
Ic
values. Fracture strength for the glass ceramic material EMP
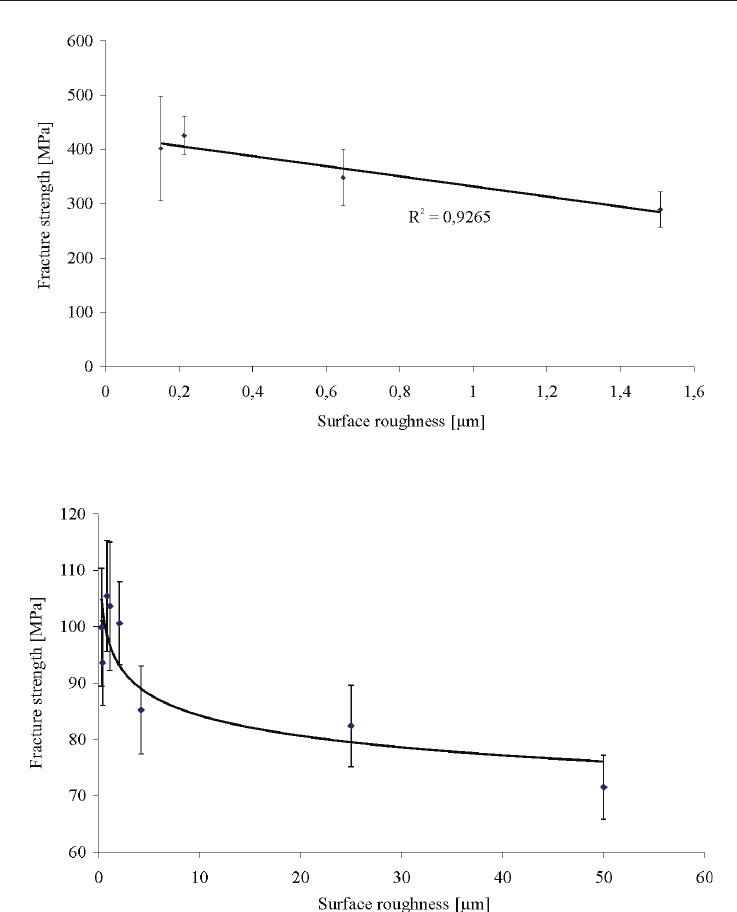
decreased from 441.4 to 303.3 MPa and for the resin composite TEC from 109.8 to 74.0 MPa, in
both cases with increasing surface roughness. In Table 1, the mean roughness values R
a
,
determined under the CLSM, are related to the applied surface grinding technique and cover a
range between 150 nm and 1.5 µm for the glass ceramic and 300 nm and 50 µm for the resin
composite material. The least roughness was generated using the 4000 grit SiC paper. Identical
surface grinding technique led to different results for EMP and TEC as Table 1 shows for 4000
and 320 grit.
Statistical significant differences in EMP were found at a surface roughness of R
a
= 0.65 µm.
However, a linear correlation over the whole roughness range could be proved (R
2
= 0.9265, Fig.
2).
In TEC a wide range of roughness produced statistical homogenous results. Significant
differences are observed at a surface roughness of R
a
= 4.22 µm. No linear correlation could
be proved. Statistical homogenous subgroups are labelled in Table 1. Figures 2 and 3 point
out the correlation between fracture strength and the applied surface roughness. Here mean
values of EMP and TEC are presented together with their
actual standard deviations.
Poisson ratio
Density
[g/ cm³]
E-Modulus
[GPa]
Hardness
[GPa]
Fracture toughness
K
Ic
[MPam
0.5
]
IEM 1.29 *
EMP 0.23 ** 2.524 ± 0.01 93.8 ± 2.11 5.56 ± 0.26 4.15 ± 0.58
TEC 0.31 *** 2.138 ± 0.01 9.8 ± 0.75 0.62 ± 0.09 1.89 ± 0.43
Fig. 2. Correlation between fracture strength
c
and the applied surface roughness R
a
for
EMP.
Fig. 3. Correlation between fracture strength
c
and the applied surface roughness R
a
for
TEC.
The Weibull distribution of facture strength for IEM is shown in Fig 4. An initial fracture
strength of
0
= 134.2 MPa and a Weibull modulus of m = 8.1 was calculated for IEM under
dry conditions, suppressing the influence of slow crack growth. Setting the failure
probability to P
F
= 5% the strength is reduced to
0.05
= 92.8 MPa. Table 3 summarizes the
Surface quality controls mechanical strength and
fatigue lifetime of dental ceramics and resin composites 185
*: (Anstis et al., 1981) **: (Fujishima & Ferracane, 1996) ***: (Chung et al., 2004)
Table 2. Mechanical properties of the test materials, required for calculation of fracture
toughness.
Fractographic examinations were performed under a light microscope (SV11, Zeiss,
Germany) on all specimens and under a SEM (Leitz ISI SR 50, Akashi, Japan) on
representative samples.
Results
Fracture strength, slow crack growth and lifetime
The characteristic fracture strengths
0
for IEM, EMP, and TEC at a failure probability P
F
= 63,2
%, their Weibull moduli m and the calculated fracture releasing critical flaw sizes are given in
Table 1. The crack lengths a
c
were calculated according to eq. 1 inserting the related strength
c
and fracture toughness K
Ic
values. Fracture strength for the glass ceramic material EMP
decreased from 441.4 to 303.3 MPa and for the resin composite TEC from 109.8 to 74.0 MPa, in
both cases with increasing surface roughness. In Table 1, the mean roughness values R
a
,
determined under the CLSM, are related to the applied surface grinding technique and cover a
range between 150 nm and 1.5 µm for the glass ceramic and 300 nm and 50 µm for the resin
composite material. The least roughness was generated using the 4000 grit SiC paper. Identical
surface grinding technique led to different results for EMP and TEC as Table 1 shows for 4000
and 320 grit.
Statistical significant differences in EMP were found at a surface roughness of R
a
= 0.65 µm.
However, a linear correlation over the whole roughness range could be proved (R
2
= 0.9265, Fig.
2).
In TEC a wide range of roughness produced statistical homogenous results. Significant
differences are observed at a surface roughness of R
a
= 4.22 µm. No linear correlation could
be proved. Statistical homogenous subgroups are labelled in Table 1. Figures 2 and 3 point
out the correlation between fracture strength and the applied surface roughness. Here mean
values of EMP and TEC are presented together with their
actual standard deviations.
Poisson ratio
Density
[g/ cm³]
E-Modulus
[GPa]
Hardness
[GPa]
Fracture toughness
K
Ic
[MPam
0.5
]
IEM 1.29 *
EMP 0.23 ** 2.524 ± 0.01 93.8 ± 2.11 5.56 ± 0.26 4.15 ± 0.58
TEC 0.31 *** 2.138 ± 0.01 9.8 ± 0.75 0.62 ± 0.09 1.89 ± 0.43
Fig. 2. Correlation between fracture strength
c
and the applied surface roughness R
a
for
EMP.
Fig. 3. Correlation between fracture strength
c
and the applied surface roughness R
a
for
TEC.
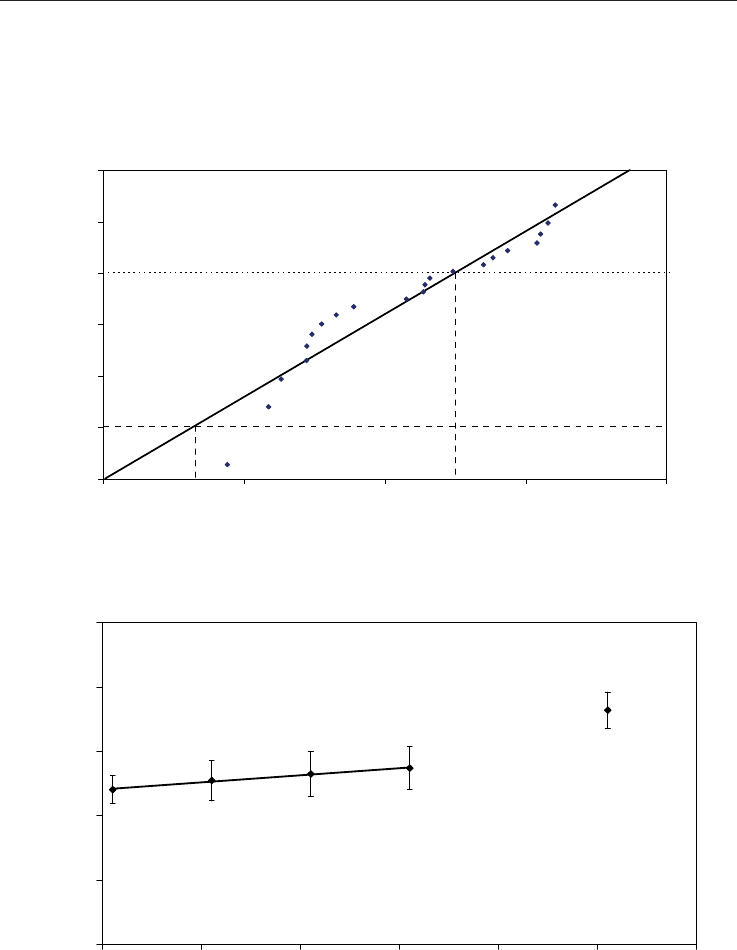
The Weibull distribution of facture strength for IEM is shown in Fig 4. An initial fracture
strength of
0
= 134.2 MPa and a Weibull modulus of m = 8.1 was calculated for IEM under
dry conditions, suppressing the influence of slow crack growth. Setting the failure
probability to P
F
= 5% the strength is reduced to
0.05
= 92.8 MPa. Table 3 summarizes the
Ceramic Materials 186
measured Weibull data for all loading rates d/dt of the dynamic fatigue experiments. The
subcritical crack growth performance was determined under wet conditions. Fig. 5 shows
the correlation between fracture strength and the applied loading rates (dynamic fatigue).
The subcritical crack growth parameters n and A were determined to n = 19.16 and A =
1.41214 mm/s.
Fig. 4. Distribution of the inert strength data
c
according to the applied Weibull statistics.
Fig. 5. Dynamic fatigue measurements for IEM in relation to the respective fatigue strength.
-4
-3
-2
-1
0
1
2
4,4 4,6 4,8 5,0 5,2
ln
B
lnln(1/(1-P
F
))
m = 8.1
63,2%
= 134.2 MPa
5%
= 92.8 MPa
y = 0.0221x + 1.9468
1.4
1.6
1.8
2
2.2
2.4
-3 -2 -1 0 1 2 3
Loading rate d/dt [log MPas
-1
]
Fracture strength
c
[log MPa]
n = 19.16
A = 1.41214 mm/s
R
2
= 0.9888
Loading rate d
/dt [MPas
-1
] Scale parameter
0
Weibull modulus m
130 134.2 8.1
1.3 88.5 6.8
0.13 84.9 6.5
0.013 81.0 7.0
0.0013 75.9 11.1
Table 3. Weibull inert strength and dynamic fatigue data for IEM.
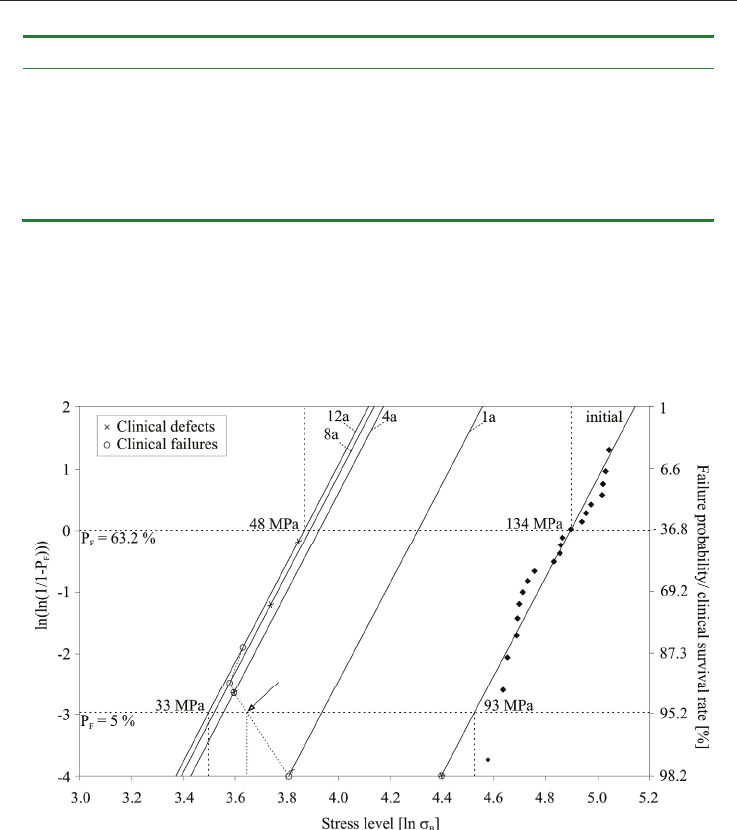
Fig. 6 shows the resulting SPT plots
for IEM. The characteristic strength values were
estimated for failure probabilities of P
F
= 63.2% and P
F
= 5%. Predictions were calculated for
lifetimes of 1, 4, 8 and 12 years according to the clinical follow-up scedule. In other words,
influenced by mechanical and chemical degradation through dynamic loading and
humidity, fracture strength of the dental glass ceramic under investigation is theoretically
predicted to drop from initial
0.05
= 93 MPa down to
0.05
= 33 MPa after 12 years (- 64%).
Fig. 6. SPT lifetime predictions for 1, 4, 8 and 12 years under simulated static loading
conditions. Clinical survival rates according to Kaplan-Meier algorithm as well as the time
dependent incidence of all bulk, chipping, and marginal inlay defects are shown. The arrow
indicates the convergence of clinical and experimental lifetimes at 38.5 MPa static loading
and for a failure probability of P
F
= 5%.
Fracture toughness
Fracture toughness has been calculated according to eq. 10. EMP exhibited a fracture
toughness of K
Ic
= 4.14 ± 0.58 MPam
0.5
and TEC a reduced performance of K
Ic
= 1.89 ± 0.43
MPam
0.5
. The values for IEM were taken from literature.
Surface quality controls mechanical strength and
fatigue lifetime of dental ceramics and resin composites 187
measured Weibull data for all loading rates d/dt of the dynamic fatigue experiments. The
subcritical crack growth performance was determined under wet conditions. Fig. 5 shows
the correlation between fracture strength and the applied loading rates (dynamic fatigue).
The subcritical crack growth parameters n and A were determined to n = 19.16 and A =
1.41214 mm/s.
Fig. 4. Distribution of the inert strength data
c
according to the applied Weibull statistics.
Fig. 5. Dynamic fatigue measurements for IEM in relation to the respective fatigue strength.
-4
-3
-2
-1
0
1
2
4,4 4,6 4,8 5,0 5,2
ln
B
lnln(1/(1-P
F
))
m = 8.1
63,2%
= 134.2 MPa
5%
= 92.8 MPa
y = 0.0221x + 1.9468
1.4
1.6
1.8
2
2.2
2.4
-3 -2 -1 0 1 2 3
Loading rate d/dt [log MPas
-1
]
Fracture strength
c
[log MPa]
n = 19.16
A = 1.41214 mm/s
R
2
= 0.9888
Loading rate d/dt [MPas
-1
] Scale parameter
0
Weibull modulus m
130 134.2 8.1
1.3 88.5 6.8
0.13 84.9 6.5
0.013 81.0 7.0
0.0013 75.9 11.1
Table 3. Weibull inert strength and dynamic fatigue data for IEM.
Fig. 6 shows the resulting SPT plots
for IEM. The characteristic strength values were
estimated for failure probabilities of P
F
= 63.2% and P
F
= 5%. Predictions were calculated for
lifetimes of 1, 4, 8 and 12 years according to the clinical follow-up scedule. In other words,
influenced by mechanical and chemical degradation through dynamic loading and
humidity, fracture strength of the dental glass ceramic under investigation is theoretically
predicted to drop from initial
0.05
= 93 MPa down to
0.05
= 33 MPa after 12 years (- 64%).
Fig. 6. SPT lifetime predictions for 1, 4, 8 and 12 years under simulated static loading
conditions. Clinical survival rates according to Kaplan-Meier algorithm as well as the time
dependent incidence of all bulk, chipping, and marginal inlay defects are shown. The arrow
indicates the convergence of clinical and experimental lifetimes at 38.5 MPa static loading
and for a failure probability of P
F
= 5%.
Fracture toughness
Fracture toughness has been calculated according to eq. 10. EMP exhibited a fracture
toughness of K
Ic
= 4.14 ± 0.58 MPam
0.5
and TEC a reduced performance of K
Ic
= 1.89 ± 0.43
MPam
0.5
. The values for IEM were taken from literature.

Ceramic Materials 188
A K
Ic
= 1.29 MPam
0.5
is reported for IEM [41]. In Table 2 all values are listed, required for
calculation of the fracture toughness values. The elastic moduli were calculated based on the
ultrasound velocity through the materials. A far stiffer material response of 93.8 GPa was
measured for EMP compared to TEC (9.8 GPa). A comparable material hardness ratio
was
measured for
EMP (5.56 GPa) and TEC (0.62 GPa). Poisson ratio values were taken from
literature (Table 2). Since fracture toughness is a material constant, the estimated fracture
releasing flaw size increased with decreasing fracture strength. For EMP the crack size
ranged from 28.1 µm (441.4 MPa) to 59.6 µm (303.3 MPa) and for TEC from 94.3 µm (109.8
MPa) to 207.0 µm (74.0 MPa). IEM with a fracture toughness K
Ic
= 1.29 MPam
0.5
and a
characteristic strength of
c
= 134.2 MPa would match a fracture releasing crack size of a
c
=
92.4 µm.
Clinical findings
All patients were satisfied with their restorations. 38 restorations could not be examined after
twelve years due to failure or missed recall investigation. Eight patients were not available and
one patient lost the
inlays due to prosthetic treatment independent from the study.
Cohesive bulk fractures of the ceramic material led to replacement of eleven inlays over 12
years. First catastrophic fractures were observed between 3 and 4.5 years (1 failure in 2
nd
year, 3 in 3
rd
year, and 2 in 4
th
year) late failures after 11 - 12 years (3 failures in 11
th
year and
2 in 12
th
year). There was no statistically significant correlation between dimensions of the
inlay and fractures observed (P > 0.05). The incidence of inlay defects over time increased
from 1 % at baseline, 2 % after 1 year, 7 % after 4 years, 26 % after 8 years to 57 % after 12
years. Table 4 summarizes the number and percentage of observed fractures and defects
during the whole observation period. Mainly chipping defects in the proximal and marginal
regions were observed as shown in Fig. 7. Survival rates from Kaplan-Meier analysis and
percentage of fractures are almost identical, since most restorations failed due to fracture.
Median survival rates have been calculated according to Kaplan-Meier survival analysis.
The clinical survival rate dropped from 100 % (1 year) to 93 % (4 years), 92 % (8 years) down
to 86 % after 12 years. Those results were merged into the SPT lifetime prediction, shown in
Fig. 6. Related to their specific location in the SPT diagram, Table 4 exhibits the
corresponding critical stress levels, calculated for static loading conditions.
Baseline 1y 4y 8y 12y
Clinical survival rate 100% 100% 93% 92% 86%
No. of fractures 0 (100%) 0 (100%) 6 (94%) 6 (94%) 11 (88%)
Fracture releasing stress
level
81.4 MPa 44.7 MPa 36.6 MPa 35.9 MPa 37.7 MPa
No. of defects 1 (99%) 2 (98%) 5 (93%) 18 (74%) 34 (43%)
Defect inducing stress level 80.4 MPa 45.6 MPa 36.6 MPa 42.1 MPa 46.5 MPa
Table 4. Clinical survival rates according to Kaplan-Meier algorithm, number and
percentage (survival rates) of failures and defects and corresponding experimental critical
stress levels, calculated for static loading conditions from the SPT diagram for the clinical
follow-up periods after baseline, 1, 4, 8, and 12 years.
Discussion
Fracture strength, slow crack growth and lifetime
Both, the EMP glass ceramic and the TEC resin composite suffer from a substantial decrease
in strength with increasing surface roughness. A surface roughness of 25 or 50 µm has no
clinical relevance but clearly underline the ongoing trend of strength degradation.
A fracture strength of 110 MPa of TEC correlate with the biaxial fracture strength data
published within the scientific documentation of the manufacturer (120 MPa). For EMP the
literature provides varying fracture strength data. Values from 239 MPa to 303 MPa to 455
MPa are reported, depending on the applied surface roughness and methodology (Albakry
et al., 2003b; Sorensen et al., 2000; Annusavice et al., 2001). Fisher et al., for example, found a
significant strength decrease from 103 to 65 MPa correlating to either a polished (R
a
= 0.2
µm) or a rough (R
a
= 5.8 µm) surface of a glass ceramic material (Fischer et al., 2003).
However, since a close relation between ceramic strength and surface roughness is proven,
little evidence is provided in literature for resin composites (Hayashi et al., 2003; Reiss &
Walther, 2000).
Average crystallite size of EMP is 3 – 6 µm. TEC consist of anorganic fillers between 0.4 and
0.7 µm and prepolymeric fillers between 20 – 50 µm. Microstructural dimensions of EMP
and TEC are shown in Fig 1b and 1c. The dependency of fracture strength on surface
roughness thus leads to the suggestion that neither crystallite size of the glass ceramic
material nor filler sizes of the resin composite are strength limiting factors. The statistical
treatment of the strength development provides
threshold values for both EMP and TEC.
No significant increase in fracture strength has been observed below 0.65 µm (1000 grit) in
EMP. For TEC a threshold value might be found below 2.1 µm (320 grit).
In vitro measurement of fracture strength and slow crack growth in IEM led to a strength of
0
= 134 MPa and a n-value of 19.16. Calculations on the basis of a static crack growth
mechanism predict a drop in strength from initial
0.05
= 93 MPa down to
0.05
= 33 MPa
after 12 years (- 64 %). This decrease represents a high sensitivity to slow crack growth of the
glass ceramic and was explained by the stress enhanced corrosive effect of water and a high
amount of silica glass phase (60 vol %). Compared with literature data, a superior fracture
strength was measured (
Lit
= 89 MPa) while the crack growth potential of IEM was
calculated being rather conservative estimation (n
Lit
= 25) (Fischer et al., 2003b). The
susceptibility to slow crack growth of the material under investigation is superior to that of
feldspathic CAD/CAM materials (n
Lit
= 16.8), feldspathic veneering porcelain (n
Lit
= 14.6),
or silica-lime glasses (n
Lit
= 16) (Morena et al., 1986; Wiederhorn, 1967; Lohbauer et al., 2002).
Fracture toughness and critical flaw sizes
Table 2 exhibits the material parameters for density, elastic modulus, hardness and fracture
toughness of EMP and TEC. Due to a lack of published data for TEC, the investigated data
were compared with the scientific documentation of the manufacturer. The data under
investigation clearly correlate with the reported density (2.1 g/cm³), elastic modulus (10
GPa), and hardness (0.58 GPa) published within. Values for EMP also correlate with
literature findings for elastic modulus (91 GPa) and hardness (5.5 GPa) (Shin & Drummond,
1999; El Hejazi & Watts, 1999).
Fracture initiating crack length have been calculated from eq. 1 and listed in Table 1. The material
fracture strength is thereby related to critical flaw sizes by
c
~ 1/ a
c
0.5
. Average flaw sizes

Surface quality controls mechanical strength and
fatigue lifetime of dental ceramics and resin composites 189
A K
Ic
= 1.29 MPam
0.5
is reported for IEM [41]. In Table 2 all values are listed, required for
calculation of the fracture toughness values. The elastic moduli were calculated based on the
ultrasound velocity through the materials. A far stiffer material response of 93.8 GPa was
measured for EMP compared to TEC (9.8 GPa). A comparable material hardness ratio
was
measured for
EMP (5.56 GPa) and TEC (0.62 GPa). Poisson ratio values were taken from
literature (Table 2). Since fracture toughness is a material constant, the estimated fracture
releasing flaw size increased with decreasing fracture strength. For EMP the crack size
ranged from 28.1 µm (441.4 MPa) to 59.6 µm (303.3 MPa) and for TEC from 94.3 µm (109.8
MPa) to 207.0 µm (74.0 MPa). IEM with a fracture toughness K
Ic
= 1.29 MPam
0.5
and a
characteristic strength of
c
= 134.2 MPa would match a fracture releasing crack size of a
c
=
92.4 µm.
Clinical findings
All patients were satisfied with their restorations. 38 restorations could not be examined after
twelve years due to failure or missed recall investigation. Eight patients were not available and
one patient lost the
inlays due to prosthetic treatment independent from the study.
Cohesive bulk fractures of the ceramic material led to replacement of eleven inlays over 12
years. First catastrophic fractures were observed between 3 and 4.5 years (1 failure in 2
nd
year, 3 in 3
rd
year, and 2 in 4
th
year) late failures after 11 - 12 years (3 failures in 11
th
year and
2 in 12
th
year). There was no statistically significant correlation between dimensions of the
inlay and fractures observed (P > 0.05). The incidence of inlay defects over time increased
from 1 % at baseline, 2 % after 1 year, 7 % after 4 years, 26 % after 8 years to 57 % after 12
years. Table 4 summarizes the number and percentage of observed fractures and defects
during the whole observation period. Mainly chipping defects in the proximal and marginal
regions were observed as shown in Fig. 7. Survival rates from Kaplan-Meier analysis and
percentage of fractures are almost identical, since most restorations failed due to fracture.
Median survival rates have been calculated according to Kaplan-Meier survival analysis.
The clinical survival rate dropped from 100 % (1 year) to 93 % (4 years), 92 % (8 years) down
to 86 % after 12 years. Those results were merged into the SPT lifetime prediction, shown in
Fig. 6. Related to their specific location in the SPT diagram, Table 4 exhibits the
corresponding critical stress levels, calculated for static loading conditions.
Baseline 1y 4y 8y 12y
Clinical survival rate 100% 100% 93% 92% 86%
No. of fractures 0 (100%) 0 (100%) 6 (94%) 6 (94%) 11 (88%)
Fracture releasing stress
level
81.4 MPa 44.7 MPa 36.6 MPa 35.9 MPa 37.7 MPa
No. of defects 1 (99%) 2 (98%) 5 (93%) 18 (74%) 34 (43%)
Defect inducing stress level 80.4 MPa 45.6 MPa 36.6 MPa 42.1 MPa 46.5 MPa
Table 4. Clinical survival rates according to Kaplan-Meier algorithm, number and
percentage (survival rates) of failures and defects and corresponding experimental critical
stress levels, calculated for static loading conditions from the SPT diagram for the clinical
follow-up periods after baseline, 1, 4, 8, and 12 years.
Discussion
Fracture strength, slow crack growth and lifetime
Both, the EMP glass ceramic and the TEC resin composite suffer from a substantial decrease
in strength with increasing surface roughness. A surface roughness of 25 or 50 µm has no
clinical relevance but clearly underline the ongoing trend of strength degradation.
A fracture strength of 110 MPa of TEC correlate with the biaxial fracture strength data
published within the scientific documentation of the manufacturer (120 MPa). For EMP the
literature provides varying fracture strength data. Values from 239 MPa to 303 MPa to 455
MPa are reported, depending on the applied surface roughness and methodology (Albakry
et al., 2003b; Sorensen et al., 2000; Annusavice et al., 2001). Fisher et al., for example, found a
significant strength decrease from 103 to 65 MPa correlating to either a polished (R
a
= 0.2
µm) or a rough (R
a
= 5.8 µm) surface of a glass ceramic material (Fischer et al., 2003).
However, since a close relation between ceramic strength and surface roughness is proven,
little evidence is provided in literature for resin composites (Hayashi et al., 2003; Reiss &
Walther, 2000).
Average crystallite size of EMP is 3 – 6 µm. TEC consist of anorganic fillers between 0.4 and
0.7 µm and prepolymeric fillers between 20 – 50 µm. Microstructural dimensions of EMP
and TEC are shown in Fig 1b and 1c. The dependency of fracture strength on surface
roughness thus leads to the suggestion that neither crystallite size of the glass ceramic
material nor filler sizes of the resin composite are strength limiting factors. The statistical
treatment of the strength development provides
threshold values for both EMP and TEC.
No significant increase in fracture strength has been observed below 0.65 µm (1000 grit) in
EMP. For TEC a threshold value might be found below 2.1 µm (320 grit).
In vitro measurement of fracture strength and slow crack growth in IEM led to a strength of
0
= 134 MPa and a n-value of 19.16. Calculations on the basis of a static crack growth
mechanism predict a drop in strength from initial
0.05
= 93 MPa down to
0.05
= 33 MPa
after 12 years (- 64 %). This decrease represents a high sensitivity to slow crack growth of the
glass ceramic and was explained by the stress enhanced corrosive effect of water and a high
amount of silica glass phase (60 vol %). Compared with literature data, a superior fracture
strength was measured (
Lit
= 89 MPa) while the crack growth potential of IEM was
calculated being rather conservative estimation (n
Lit
= 25) (Fischer et al., 2003b). The
susceptibility to slow crack growth of the material under investigation is superior to that of
feldspathic CAD/CAM materials (n
Lit
= 16.8), feldspathic veneering porcelain (n
Lit
= 14.6),
or silica-lime glasses (n
Lit
= 16) (Morena et al., 1986; Wiederhorn, 1967; Lohbauer et al., 2002).
Fracture toughness and critical flaw sizes
Table 2 exhibits the material parameters for density, elastic modulus, hardness and fracture
toughness of EMP and TEC. Due to a lack of published data for TEC, the investigated data
were compared with the scientific documentation of the manufacturer. The data under
investigation clearly correlate with the reported density (2.1 g/cm³), elastic modulus (10
GPa), and hardness (0.58 GPa) published within. Values for EMP also correlate with
literature findings for elastic modulus (91 GPa) and hardness (5.5 GPa) (Shin & Drummond,
1999; El Hejazi & Watts, 1999).
Fracture initiating crack length have been calculated from eq. 1 and listed in Table 1. The material
fracture strength is thereby related to critical flaw sizes by
c
~ 1/ a
c
0.5
. Average flaw sizes
Ceramic Materials 190
between 28 µm (441 MPa) and 60 µm (303 MPa) have been calculated for EMP. TEC exhibits a far
wider distribution from 94 µm (110 MPa) until 208 µm (74 MPa), due to a reduced fracture
toughness of K
Ic
= 1.89 MPam
0.5
. It has been shown for linear elastic materials, that prior to
catastrophic failure of a brittle material crack extension will occur, thus leading to a
differentiation between the initial flaw a
0
and the crack length at fracture a
c
. This phenomen has
been termed stable crack extension or slow crack growth and is described as a function of loading
rate, residual stress state and testing environment (Scherrer et al., 1999). This in turn leads to the
suggestion that the fracture initiating flaws under investigation are of smaller size. Chantikul et
al. developed a a
c
/ a
0
ratio of around 2.5 (Chantikul et al., 1981). This means that fracture
initiating flaw sizes will be effective between 11 and 24 µm for EMP and between 38 and 83 µm
for TEC. However, the results shown here represent a strength degradation related to an applied
surface roughness far smaller compared to the above estimation. Quantitative fractography is
reported a useful tool to more precisely localize fracture origins and to trace back critical flaw
sizes (Mecholsky, 1995b; Kelly et al., 1989).
Fracture toughness data is extremely sensitive on the applied methodology. Amongst a
variety of techniques, such as the Chevron-notch-beam test (CNB), the single-etch-notch
beam test (SENB) or indentation strength (IS) the indentation fracture technique (IF) has
been selected here (Munz & Fett, 1999; Anstis et al., 1981). Guazzato et al. measured a
fracture toughness for EMP of K
Ic
= 3.0 MPam
0.5
using the IS technique (Guzzato et al.,
2004). Fracture toughness for resin composites commonly range between K
Ic
= 1.2 and 2.0
MPam
0.5
which in turn matches the fracture toughness under investigation (Manhart et al.,
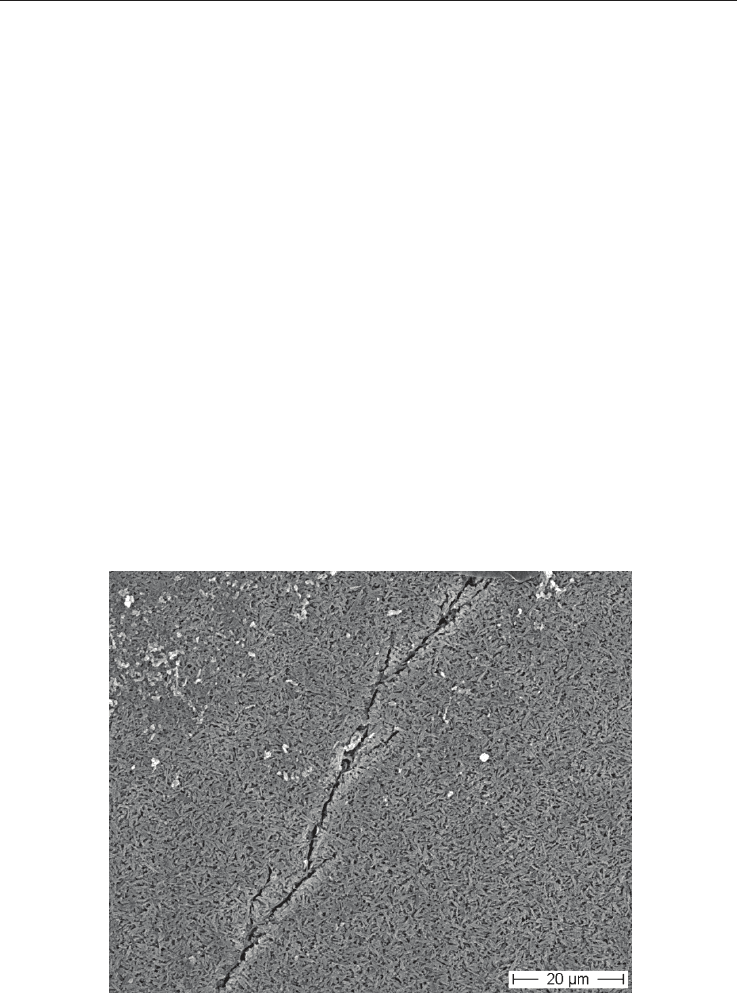
2000; Yap et al., 2004). An increasing fracture toughness of EMP contributes to an improved
clinical reliability. The respective underlying toughening mechanisms are shown in Fig. 7.
Fig. 7. Crack propagation in EMP showing crack deflection and crack branching. (HF
etching for 40 s after fracture).
The needle-shaped lithiumdisilicate crystallites serve as second phase particles, thus
inducing crack bowing and crack deflection (twisting and tilting) (Evans, 1990; Davidge &
Evans, 1970). Crack branching (Fig. 7) further contribute to increase the material toughness
(Evans, 1990). A mixture of intergranular and intragranular fracture in EMP is reported in
literature (Guzzato et al., 2004). Composites on the other hand exhibit an inferior fracture
toughness. Underlying mechanisms like crack bowing and crack deflection are thereby
based on the filler size distribution and content (Evans, 1990; Reiss & Walther, 2000). Crack
blunting is a described mechanism which further contributes to toughening in resin
composites (Davis & Waters, 1987).
Clinical outcome
The clinical results shown here, emphasize bulk fractures as the main failure reason,
clustered between 3 to 4.5 and between 11 to 12 years of clinical service. Of course, clinical
success of the present glass ceramic restorations is proved for at least 12 years. Anusavice
and Brennan stated a minimum clinical survival time of 5 years (Annusavice & Brennan,
1996).
Analyzing the clinical images resulted in the finding that in each case of catastrophic failure,
occlusal adjustments were performed while this trend continued throughout the study.
There is considerable indication that most of the fractures were attributed to cyclic,
masticatory fatigue (Drummond et al., 2000; Ohyama et al., 1999). Due to the difficult
intraoral situation, occlusal corrections may not have been polished sufficiently and those
microcracks may have accelerated later catastrophic fractures (see surface roughness R
a
in
Fig. 8). Therefore, a clinician should pay attention to a careful polish of ceramic surfaces,
having been previously subjected to intraoral adjustment in order to prevent this particular
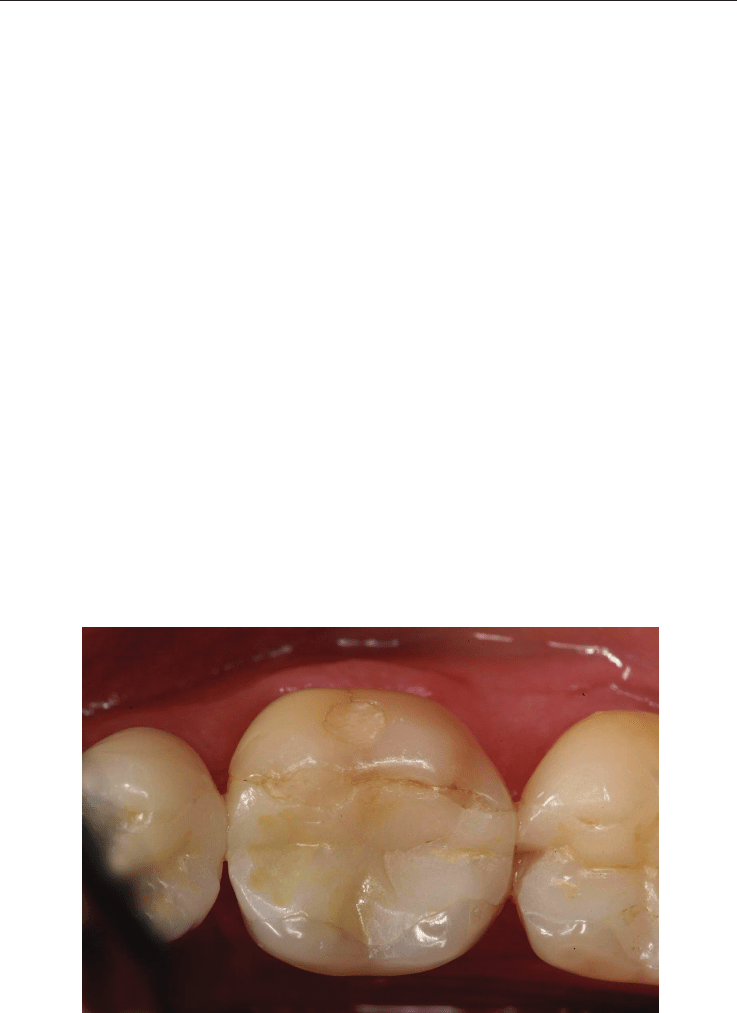
problem.
Fig. 8. IEM restoration in the left lower jaw after 8 years. Small marginal and chipping
fractures were detected (A). Clinical visibility of increased surface roughness in the occlusal
area (B).
(A)
(A)
(A)
(B)
Surface quality controls mechanical strength and
fatigue lifetime of dental ceramics and resin composites 191
between 28 µm (441 MPa) and 60 µm (303 MPa) have been calculated for EMP. TEC exhibits a far
wider distribution from 94 µm (110 MPa) until 208 µm (74 MPa), due to a reduced fracture
toughness of K
Ic
= 1.89 MPam
0.5
. It has been shown for linear elastic materials, that prior to
catastrophic failure of a brittle material crack extension will occur, thus leading to a
differentiation between the initial flaw a
0
and the crack length at fracture a
c
. This phenomen has
been termed stable crack extension or slow crack growth and is described as a function of loading
rate, residual stress state and testing environment (Scherrer et al., 1999). This in turn leads to the
suggestion that the fracture initiating flaws under investigation are of smaller size. Chantikul et
al. developed a a
c
/ a
0
ratio of around 2.5 (Chantikul et al., 1981). This means that fracture
initiating flaw sizes will be effective between 11 and 24 µm for EMP and between 38 and 83 µm
for TEC. However, the results shown here represent a strength degradation related to an applied
surface roughness far smaller compared to the above estimation. Quantitative fractography is
reported a useful tool to more precisely localize fracture origins and to trace back critical flaw
sizes (Mecholsky, 1995b; Kelly et al., 1989).
Fracture toughness data is extremely sensitive on the applied methodology. Amongst a
variety of techniques, such as the Chevron-notch-beam test (CNB), the single-etch-notch
beam test (SENB) or indentation strength (IS) the indentation fracture technique (IF) has
been selected here (Munz & Fett, 1999; Anstis et al., 1981). Guazzato et al. measured a
fracture toughness for EMP of K
Ic
= 3.0 MPam
0.5
using the IS technique (Guzzato et al.,
2004). Fracture toughness for resin composites commonly range between K
Ic
= 1.2 and 2.0
MPam
0.5
which in turn matches the fracture toughness under investigation (Manhart et al.,
2000; Yap et al., 2004). An increasing fracture toughness of EMP contributes to an improved
clinical reliability. The respective underlying toughening mechanisms are shown in Fig. 7.
Fig. 7. Crack propagation in EMP showing crack deflection and crack branching. (HF
etching for 40 s after fracture).
The needle-shaped lithiumdisilicate crystallites serve as second phase particles, thus
inducing crack bowing and crack deflection (twisting and tilting) (Evans, 1990; Davidge &
Evans, 1970). Crack branching (Fig. 7) further contribute to increase the material toughness
(Evans, 1990). A mixture of intergranular and intragranular fracture in EMP is reported in
literature (Guzzato et al., 2004). Composites on the other hand exhibit an inferior fracture
toughness. Underlying mechanisms like crack bowing and crack deflection are thereby
based on the filler size distribution and content (Evans, 1990; Reiss & Walther, 2000). Crack
blunting is a described mechanism which further contributes to toughening in resin
composites (Davis & Waters, 1987).
Clinical outcome
The clinical results shown here, emphasize bulk fractures as the main failure reason,
clustered between 3 to 4.5 and between 11 to 12 years of clinical service. Of course, clinical
success of the present glass ceramic restorations is proved for at least 12 years. Anusavice
and Brennan stated a minimum clinical survival time of 5 years (Annusavice & Brennan,
1996).
Analyzing the clinical images resulted in the finding that in each case of catastrophic failure,
occlusal adjustments were performed while this trend continued throughout the study.
There is considerable indication that most of the fractures were attributed to cyclic,
masticatory fatigue (Drummond et al., 2000; Ohyama et al., 1999). Due to the difficult
intraoral situation, occlusal corrections may not have been polished sufficiently and those
microcracks may have accelerated later catastrophic fractures (see surface roughness R
a
in
Fig. 8). Therefore, a clinician should pay attention to a careful polish of ceramic surfaces,
having been previously subjected to intraoral adjustment in order to prevent this particular
problem.
Fig. 8. IEM restoration in the left lower jaw after 8 years. Small marginal and chipping
fractures were detected (A). Clinical visibility of increased surface roughness in the occlusal
area (B).
(A)
(A)
(A)
(B)

Ceramic Materials 192
Further detoriation of the restorations by marginal and chipping fractures has been
observed especially between the 6 and 8 years recall and after 12 years as shown in Table 4.
Chippings that have been recorded at the eight years recall seem to be independent from
rotary instrumentation during occlusal adjustment directly after luting. During the 8 years
recall it was predicted that if deterioration progresses over the next years of clinical service,
it might be possible that further failures will occur due to a further decreased marginal
quality (Krämer & Frankenberger, 2005). Consequently, late catastrophic fatigue fractures
occurred between 11 and 12 years of clinical service. In literature, marginal fractures were
frequently observed, especially when luting was performed with materials of low adhesion
and wear resistance e.g. glass ionomer cements (Höglund et al., van Dijken & Hörstedt,
1994).
It would be of interest, if size and location of an individual restoration would have
influenced the clinical outcome. Neither the number of restoration surfaces nor the size nor
the tooth type showed any significant influence on clinical performance over the twelve
years period (p > .05, Mann-Whitney U-test). No correlation was found between ceramic
thickness and fractures. The lowest cusp thickness (0.3 mm) was recorded without having
any clinical consequences.
Experimental lifetime calculation and clinical survival rate
In this study exemplary lifetimes have been predicted according to the clinical recall
intervals of 1, 4, 8, and 12 years and shown in the SPT diagram (Fig. 6). This, based on static
loading conditions and on the associated slow crack growth mechanism. Different static
lifetimes t
1
and t
2
were calculated on the basis of eq. 11 (Kelly, 1995):
1 2
2 1
n
t
t
(11)
Fig. 6 represents clinical survival rates as well as percentage of inlay defects, merged to the
experimentally calculated lifetime predictions. Defects here include all bulk, chipping, and
marginal fractures. For clinical concerns the question should be addressed to the level of
fracture releasing stresses. Since clinical conditions are affected by constant average
masticatory loading over time the maximum increase in failure rate is observed after 12
years.
Based on a clinical requirement for a maximum failure rate of P
F
= 5%, a fracture releasing
static loading of 35.5 MPa was calculated after 4 years or respectively 33 MPa after 12 years
(Fig. 6). However, constant static loading does not match clinical relevant average chewing
forces but appears to represent far more conservative estimation. Maximum masticatory
forces may easily achieve 300 - 400 N, but far reduced average chewing forces of approx. 220
N in the molar region are reported in literature (Pröschel & Morneburg, 2002; Hidaka et al.
1999). Assigning those forces to a contact area of 7 - 8 mm
2
(single molar tooth) result in an
average chewing pressure of 27 - 31 MPa. This data range beneath the values from the static
experiment after 4 years (35.5 MPa). An underlying failure rate of P
F
= 5% has clinically been
exceeded after 4 years and related to an experimentally calculated threshold value of 35.5
MPa, as shown in Fig. 6. In consequence, the clinical failure rate increases to P
F
= 14% after
12 years in-situ. The clustered incidence of failures after 12 years can be explained by
exceeding this threshold value and can be related to slow crack growth in
the glass ceramic
material. A further increased failure rate is expected from future recalls. In order to prevent
from further clinical degradation or in order to extend clinical lifetimes, the use of highly
corrosion resistant (high n-value) or high strength materials is recommended for use in
extended class I and II restorations (Lohbauer et al., 2002).
However, laboratory fatigue testing should meet clinical criteria as there are cyclic loading
and intraoral temperature and humidity simulation. Braem predicted 10
6
cycles to represent
about one year of real-life contact (Braem, 2001). He approximated 2700 chews per day
(three periods of 15 minutes of chewing per day at a chewing rate of 1 Hz). Keeping the
chewing frequency, a single in vitro experiment would last for approx. two weeks.
In this context, the dynamic fatigue method should be viewed as an efficient screening tool
for evaluating dental materials, rather than as a simulation of actual dental function. In
order to predict reliable lifetimes, further influences on damage accumulation should be
considered. The effect of contact fatigue or further enhancement of crack growth from cyclic
fatigue might play a critical role in predicting clinical lifetimes (Annusavice & Brennan,
1996).
Polishing techniques
A variety of clinical polishing systems are marketed, including particle impregnated rubber
cups, disks, and brushes together with different polishing pastes (Watanabe et al., 2006;
Venturini et al., 2006). Depending on the treated material and applied technique, a clinical
surface roughness between 200 and 30 nm is reported for resin composites as well as for
glass ceramics (de Jager et al., 2000; Turssi et al., 2005). After years of clinical service, load
bearing restorations are exposed to masticatory degradation. A dramatic increase in surface
roughness from 100 - 300 nm to 15 - 40 µm has been measured due to in-vitro abrasive wear
simulation on resin composite materials (Turssi et al., 2005). Clinical abrasive wear on glass
ceramic inlays and onlays has been reported to increase after 12 years of clinical service
(Lohbauer et al., 2008). As a consequence, the authors observed an increasing amount of
fatigue failures due to fracture. Those studies point out the significance of surface roughness
(fracture releasing crack length) not only on abrasive wear but on the resulting strength of
clinically placed restoration. Optimal polishing of a restoration right after placement is thus
strongly recommended to guarantee an optimum strength performance and to increase the
clinical lifetime.
References
Albakry M, Guzzato M, Swain MV. (2003). Fracture toughness and hardness evaluation of
three pressable all-ceramic dental materials. J Dent 31:181-188.
Albakry M, Guazzato M, Swain MV. (2003b). Biaxial flexure strength, elastic moduli, and x-
ray diffraction characterisation of three pressable all-ceramic materials. J Prosthet
Dent 89:374-380.
Anstis GR, Chantikul P, Lawn BR, Marshall DB. (1981). A Critical Evaluation of Indentation
Techniques for Measuring Fracture Toughness: I, Direct Crack Measurements. J Am
Ceram Soc 64:533-538.