Wunderlich W. (ed.). Ceramic Materials
Подождите немного. Документ загружается.

Development of Thermoelectric materials based on NaTaO3 - composite ceramics 13
section 2.4. Hence, it can be concluded, that the octahedron tilting mentioned in section 2
was suppressed by the doping.
Fig. 12. SEM micrographs of the as-prepared surfaces of different NaTaO
3
-composites
processed by adding 40 wt% of (a) Fe, (b) Ag, (c) Ti, (d) Mo, (e) Mn, (e) Cr, (g) Ni, (h) W.
The microstructure of the NaTaO
3
composite processed with 50 wt% Fe consists of a
NaTaO
3
- 50 mol% Fe
2
O
3
composite as shown in fig. 12 a. It consists of dark Fe
2
O
3
particles,
on average 10 m in size, and appearing in streaks-like shape, which are embedded in a
grey NaTaO
3
matrix. Detailed explanation is provided in a previous paper [Wunderlich &
Soga 2010]. When NaTaO
3
is initially processed with Fe
2
O
3
instead of Fe, the microstructure
looks like a sintered ceramic composite with white Fe
2
O
3
besides white NaTaO
3
particles.
The change from black to white color can be explained by oxygen saturation as explained in
section 6. Such a micrograph is shown in a previous paper [Wunderlich 2009-b]. The white
areas in fig. 12 a are pores remaining from insufficient compaction during sintering or from
released oxygen as explained in section 5.
In NaTaO
3
-composites containing Ag, Ti, Mn, and Ni the dark, metallic particles are slightly
bigger (5~10 m). The particles have a volume fraction of about 30% which correspond well
to the intensity ratios of the XRD-pattern. In specimens, which were produced from Fe
2
O
3
-
instead of Fe-powder, the Fe
2
O
3
-particles form round particles as shown in fig. 3 a in
[Wunderlich 2009-b]. In the case of Cr the dark, metallic Cr-particles are significantly larger
(20 m), which can be explained by their low diffusivity. The same would be expected for
Mo and W with their high melting points, but instead they lead to faceted interfaces. By
chemical mapping homogeneous distribution of Na, Ta, Mo or W was confirmed. The two
elements, Mo, and W, having their location in the period system and their atomic radii close
to Ta, and, hence, can inter-diffuse easily with Ta. They lower the surface energy of certain
crystallographic planes, which is an important fact to be kept in mind when nano-layered
composite materials based on NaTaO
3
are desired.
The main goal of doping is to increase the carrier concentration of NaTaO
3
in order to
increase the conductivity. In a composite this can only be achieved by increasing the
concentration of the dissolved element. Composition measurements by EDX in SEM with
lateral resolution of 1 m were performed on the NaTaO
3
-phase in the NaTaO
3
-composites
processed with different metals. For Cr, Mo and W concentrations below 2 at% were
detected, for Ag, Ti, Mn, and Ni, 5 ~ 10 at% were detected and for Fe 14 at%. This result can
Is a necessity for a thermoelectric material and explains the success of Fe and Ag for the TE-
performance as explained in the following section.
5. Thermoelectric characterization
5.1 Measuring device
The thermoelectric measurements were performed with a self-manufactured device as
shown in the inset of fig. 13. The specimen was attached to the device, so that its left side lies
on a copper block as a heat sink and its right side on a micro-ceramic heater (Sakaguchi Ltd.
MS1000) with a power of 1kW, and was heated up to 1000
o
C within 3 minutes. Hence, the
bottom part of the specimen experienced the large temperature difference, while the upper
part was heated through the heat conductivity of the specimen. The temperature
distribution as measured by thermocouples is shown in fig. 1c of [Wunderlich & Soga 2010].
Seebeck voltages were measured on both, the bottom and top part of the specimen by Ni-
wires, which were connected to voltmeters (Sanwa PC510), marked as V1 and V2 in the inset
of fig. 13 b. The temperature was measured with thermocouples also attached to voltmeters.
The data were recorded online by a personal computer.
Most TE-literature reports TE-data measured under small temperature gradient [Bulusu &
Walkner 2008], where the theory is valid for. Our device however, measures the data under
large temperature gradient, which is close to applications. When comparing such measured
data with literature data on similar specimens (CoTiSb, Fe), in general about 1.5 times larger
values for the Seebeck voltages are obtained.
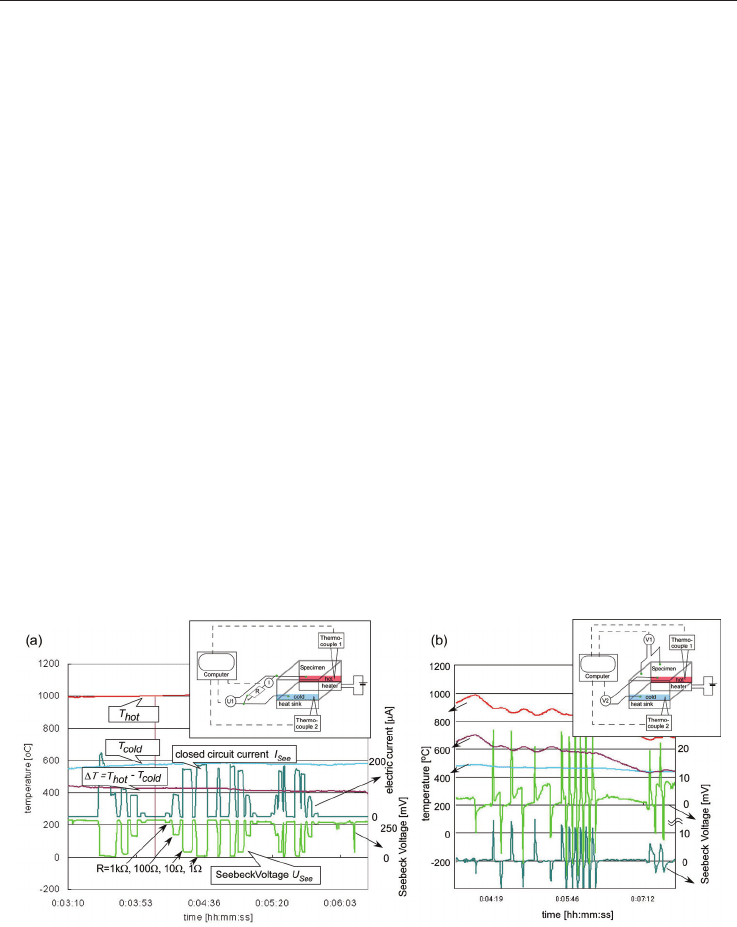
Fig. 13. Temperature (on the left y-axis), Seebeck Voltage and short-circuit current (both on
the right y-axis) as a function of time. The inset shows the scheme of the experimental setup
for measuring the Seebeck voltage and the closed circuit current. (a) Typical measurement
for NaTaO
3
+ 50 wt% Fe, (b) Seebeck voltage response for NaTaO
3
+ 50 wt% Cu, when the
heater is switched off or on (red line).

Ceramic Materials 14
By putting the specimen completely above the ceramics heater, the temperature dependence
of the electric resistivity was measured with the same device as shown previously
[Wunderlich 2009-b, Wunderlich & Soga 2010]. The reason, why the Seebeck voltage only
appears when heated above 500°C, can be explained by the poor electric conductivity at low
temperatures. The room temperature resistivity of such samples decreases from about 10
M to 0.1 M when sintered in at least five sintering steps (1000
o
C, 5h) [Wunderlich & Soga
2010]. The temperature dependence of the resistivity was measured. The activation energy
E
A
for thermal activation of the charge carriers n
e
in this n-doped semiconductors was
estimated according to n
e
= N exp (-E
A
/2kT) by a suitable data fit. This analysis yield to an
activation energy for charge carriers of about 1 eV during heating and 0.6 eV during cooling
[Wunderlich 2009-b].
Another option of this device is the measurement of the closed circuit current. For this
option, the wires below the specimen are connected with resistances of 1, 10, 100, 1k,
or 1M in a closed circuit condition as seen in the inset of fig. 13 a. As the measured electric
current is a material dependent property, it is recorded too. As shown in fig. 13 a or fig. 3 in
[Wunderlich 2009-b], as soon as the circuit is closed, the voltage of the NaTaO
3
- 30mol%
Fe
2
O
3
specimen drops down, and the current increases according to the amount of load with
a short delay time of a few ms. The detection limits are about U=1mV and I=0.8A.
5.2 Time-dependence of Seebeck voltage
For the most specimens, the Seebeck voltage is not time-dependent and only depends on the
temperature gradient. Time-dependent effects of the Seebeck-voltage occurrence have been
reported for Co-based rare-earth Perovskite-composites (for example Gd
2
O
3
+CoO
x
) [Wunderlich
& Fujizawa. 2009-d] and were explained as a combined occurrence of pyro-electricity and
thermoelectricity. In some Co-based perovskite specimes remarkable non-linearities in the plot
Seebeck voltage versus temperature difference appear, but not in NaTaO
3
.
A time-dependent Seebeck voltage behavior appears at specimens NaTaO
3
+ x Cu, with x from
30 to 50 wt%, as shown in fig. 13 b for x= 50wt%. On such specimens in general only a small
Seebeck voltage of only -5 mV is measured, even at temperatures above 500
o
C, when a
sufficiently high charge carrier concentration is reached. However, when then the heater is
switched off suddenly, a sharp pulse, a few milliseconds in length, of the Seebeck voltage with a
value of 20 mV is measured with a negative sign. When switching on the heater again, the sign
reverses to a positive pulse of Seebeck voltage with the same absolute value of 20mV. The
Seebeck voltage on the backside of the specimen, which experiences the temperature gradient
only indirectly through heat conduction, is not so high in its absolute value (12 mV for a 5 mm
thick specimen), but it appears with the same sign and at the same time. In fig. 13 b this is shown
in dark-green, while the pulse of the specimen side with the large temperature gradient is shown
in light-green. The value of the Seebeck pulse is independent on the time-interval between the
heat flow reversals, just the Seebeck voltage between the pulses fluctuates between 2 and 10
times of its absolute value. Only when the temperature gradient decreases (right side of fig. 13b),
the absolute value of the pulse becomes smaller.
This heat flow dependent Seebeck pulse in time appears also in NaTaO
3
+ x Ag specimens,
which were sintered only for a short time (1000
o
C, 5h). The reason is not yet completely
investigated, but the interface between NaTaO
3
and metallic particles, which are not reactive
with NaTaO
3
, is responsible for this effect. It is different from pyroelectricity, which showed
a similar behavior like an electric capacitor. The heat-flow dependent Seebeck voltage pulse
can be utilized for building a heat-flow meter, which would be able to detect the forward or
backward direction of the heat flow, due to the sign of the voltage pulse. By micro
fabrication several such specimens could be arranged under different angles to heat flow, so
that the vector of the heat flow can be determined, and when such devices are arranged in
an array, even the heat flow tensor can be measured.
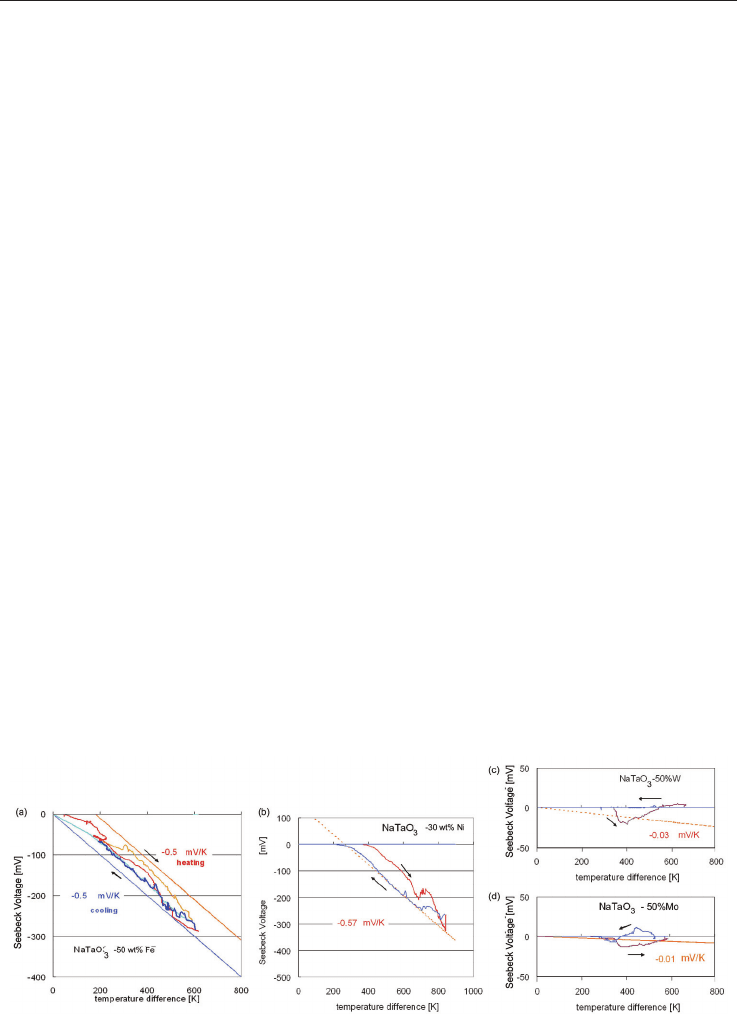
5.3 Seebeck voltage measured under large temperature gradients
The measurements of the Seebeck voltage U
See
are shown in fig. 14, where a temperature
gradient of up to T = 800 K was applied to the specimens and the Seebeck voltage
measured as explained in section 5.1. The specimens with NaTaO
3
+x Fe were measured for
x = 30, 40, 50, 60, 70, 80, 90 wt%. The specimen with x= 50, 60, 70 wt% showed the high
Seebeck voltages of about -300 mV as shown in fig. 14 a, details are explained in previous
publications [Wunderlich 2009-b, Wunderlich & Soga 2010]. From the plot temperature
difference dT versus Seebeck voltage U
S
a Seebeck coefficient S of 0.5 mV/K was estimated
by the slope S = dU
S
/dT.
As the XRD results showed the formation of Fe
2
O
3
, also NaTaO
3
+ r Fe
2
O
3
specimens were
sintered, were r was 30, 50, 70, 90 wt%. These specimens showed all a Seebeck voltage of +60
mV at T = 800K with a slightly nonlinear T-dependence. Hence, different processing
causes a different oxidation state of the second component in this composite, and changes
the n-type NaTaO
3
+x Fe into a p-type NaTaO
3
+ r Fe
2
O
3
composite. As mentioned above,
the microstructure looks slightly different for both composites and the thermo-kinetic
measurements in section 6 too.
When metallic Ni is added to NaTaO
3
, the sintered composites with x= 30 wt% Ni showed
the highest value of -320 mV with a Seebeck coefficient of 0.57 mV/K, as shown in fig. 14 b.
In this case non-linear behavior at T = 650 K during heating, and T = 600K during cooling
appears at all Ni-specimens, but not at other elements, and is probably related to some
phase transitions. In the case of W additions to NaTaO
3
the specimens showed only a small
Seebeck voltage of -30 mV for all concentrations in the range 30 to 90 wt% (fig. 14 c). A
similar behavior is seen for Mo, where the 50 wt% sample showed a Seebeck voltage of -10
mV during heating and +10 mV during cooling. The plots of Seebeck voltage versus
temperature difference are linear.
Fig. 14. Seebeck Voltage as a function of the temperature difference for (a) NaTaO
3
+50 wt%
Fe, (b) NaTaO
3
+30 wt% Ni, (c) NaTaO
3
+50 wt% W, (d) NaTaO
3
+50 wt% Mo. The slope of
the plots yield to the Seebeck-coefficients as mentioned.
Development of Thermoelectric materials based on NaTaO3 - composite ceramics 15
By putting the specimen completely above the ceramics heater, the temperature dependence
of the electric resistivity was measured with the same device as shown previously
[Wunderlich 2009-b, Wunderlich & Soga 2010]. The reason, why the Seebeck voltage only
appears when heated above 500°C, can be explained by the poor electric conductivity at low
temperatures. The room temperature resistivity of such samples decreases from about 10
M to 0.1 M when sintered in at least five sintering steps (1000
o
C, 5h) [Wunderlich & Soga
2010]. The temperature dependence of the resistivity was measured. The activation energy
E
A
for thermal activation of the charge carriers n
e
in this n-doped semiconductors was
estimated according to n
e
= N exp (-E
A
/2kT) by a suitable data fit. This analysis yield to an
activation energy for charge carriers of about 1 eV during heating and 0.6 eV during cooling
[Wunderlich 2009-b].
Another option of this device is the measurement of the closed circuit current. For this
option, the wires below the specimen are connected with resistances of 1, 10, 100, 1k,
or 1M in a closed circuit condition as seen in the inset of fig. 13 a. As the measured electric
current is a material dependent property, it is recorded too. As shown in fig. 13 a or fig. 3 in
[Wunderlich 2009-b], as soon as the circuit is closed, the voltage of the NaTaO
3
- 30mol%
Fe
2
O
3
specimen drops down, and the current increases according to the amount of load with
a short delay time of a few ms. The detection limits are about U=1mV and I=0.8A.
5.2 Time-dependence of Seebeck voltage
For the most specimens, the Seebeck voltage is not time-dependent and only depends on the
temperature gradient. Time-dependent effects of the Seebeck-voltage occurrence have been
reported for Co-based rare-earth Perovskite-composites (for example Gd
2
O
3
+CoO
x
) [Wunderlich
& Fujizawa. 2009-d] and were explained as a combined occurrence of pyro-electricity and
thermoelectricity. In some Co-based perovskite specimes remarkable non-linearities in the plot
Seebeck voltage versus temperature difference appear, but not in NaTaO
3
.
A time-dependent Seebeck voltage behavior appears at specimens NaTaO
3
+ x Cu, with x from
30 to 50 wt%, as shown in fig. 13 b for x= 50wt%. On such specimens in general only a small
Seebeck voltage of only -5 mV is measured, even at temperatures above 500
o
C, when a
sufficiently high charge carrier concentration is reached. However, when then the heater is
switched off suddenly, a sharp pulse, a few milliseconds in length, of the Seebeck voltage with a
value of 20 mV is measured with a negative sign. When switching on the heater again, the sign
reverses to a positive pulse of Seebeck voltage with the same absolute value of 20mV. The
Seebeck voltage on the backside of the specimen, which experiences the temperature gradient
only indirectly through heat conduction, is not so high in its absolute value (12 mV for a 5 mm
thick specimen), but it appears with the same sign and at the same time. In fig. 13 b this is shown
in dark-green, while the pulse of the specimen side with the large temperature gradient is shown
in light-green. The value of the Seebeck pulse is independent on the time-interval between the
heat flow reversals, just the Seebeck voltage between the pulses fluctuates between 2 and 10
times of its absolute value. Only when the temperature gradient decreases (right side of fig. 13b),
the absolute value of the pulse becomes smaller.
This heat flow dependent Seebeck pulse in time appears also in NaTaO
3
+ x Ag specimens,
which were sintered only for a short time (1000
o
C, 5h). The reason is not yet completely
investigated, but the interface between NaTaO
3
and metallic particles, which are not reactive
with NaTaO
3
, is responsible for this effect. It is different from pyroelectricity, which showed
a similar behavior like an electric capacitor. The heat-flow dependent Seebeck voltage pulse
can be utilized for building a heat-flow meter, which would be able to detect the forward or
backward direction of the heat flow, due to the sign of the voltage pulse. By micro
fabrication several such specimens could be arranged under different angles to heat flow, so
that the vector of the heat flow can be determined, and when such devices are arranged in
an array, even the heat flow tensor can be measured.
5.3 Seebeck voltage measured under large temperature gradients
The measurements of the Seebeck voltage U
See
are shown in fig. 14, where a temperature
gradient of up to T = 800 K was applied to the specimens and the Seebeck voltage
measured as explained in section 5.1. The specimens with NaTaO
3
+x Fe were measured for
x = 30, 40, 50, 60, 70, 80, 90 wt%. The specimen with x= 50, 60, 70 wt% showed the high
Seebeck voltages of about -300 mV as shown in fig. 14 a, details are explained in previous
publications [Wunderlich 2009-b, Wunderlich & Soga 2010]. From the plot temperature
difference dT versus Seebeck voltage U
S
a Seebeck coefficient S of 0.5 mV/K was estimated
by the slope S = dU
S
/dT.
As the XRD results showed the formation of Fe
2
O
3
, also NaTaO
3
+ r Fe
2
O
3
specimens were
sintered, were r was 30, 50, 70, 90 wt%. These specimens showed all a Seebeck voltage of +60
mV at T = 800K with a slightly nonlinear T-dependence. Hence, different processing
causes a different oxidation state of the second component in this composite, and changes
the n-type NaTaO
3
+x Fe into a p-type NaTaO
3
+ r Fe
2
O
3
composite. As mentioned above,
the microstructure looks slightly different for both composites and the thermo-kinetic
measurements in section 6 too.
When metallic Ni is added to NaTaO
3
, the sintered composites with x= 30 wt% Ni showed
the highest value of -320 mV with a Seebeck coefficient of 0.57 mV/K, as shown in fig. 14 b.
In this case non-linear behavior at T = 650 K during heating, and T = 600K during cooling
appears at all Ni-specimens, but not at other elements, and is probably related to some
phase transitions. In the case of W additions to NaTaO
3
the specimens showed only a small
Seebeck voltage of -30 mV for all concentrations in the range 30 to 90 wt% (fig. 14 c). A
similar behavior is seen for Mo, where the 50 wt% sample showed a Seebeck voltage of -10
mV during heating and +10 mV during cooling. The plots of Seebeck voltage versus
temperature difference are linear.
Fig. 14. Seebeck Voltage as a function of the temperature difference for (a) NaTaO
3
+50 wt%
Fe, (b) NaTaO
3
+30 wt% Ni, (c) NaTaO
3
+50 wt% W, (d) NaTaO
3
+50 wt% Mo. The slope of
the plots yield to the Seebeck-coefficients as mentioned.

Ceramic Materials 16
Na Mg Al Si P
-- / / 0 / /
K * Ca Sc Ti V Cr Mn
Fe
Co Ni Cu Zn Ga Ge As
-30 / / -20 / -200 -30
-320
-20 -360 -20 / / / /
Rb Sr Y Zr Nb Mo Tc Ru Rh Pd
Ag
Cd In Sn Sb
/ / / / / -10/+10 / / / /
+250
/ / 0 0
Cs Ba Hf Ta W Re Os Ir Pt Au Hg Tl Pb Bi
/ / / -- -20 / / / / / / / / 0
* KTaO
3
+Fe
Fig. 15. Part of the periodic table showing the elements which were tested as doping
additives for NaTaO
3
. The vale refers to the Seebeck voltage in mV at T = 750K. In the case
of K it means KTaO
3
with Fe-additions. Only the two elements in bold letters (Fe, Ag)
showed a remarkable closed-circuit current.
Such measurements were performed by adding several metallic elements Me from the
periodic system NaTaO
3
+x Me specimens with x = 30, 50, 70, 90 wt%. Fig. 15 shows the
largest Seebeck voltage at T=800 K among these specimens, where the best results usually
were achieved for x around 50 wt%. Al and those semiconducting elements which were
measured did not dissolve in NaTaO
3
and such specimens remain white, a sign that they are
still insulators.
Specimens sintered from NaTaO
3
- x Ag powders with x= 30, 50, 60 wt% lead to p-type
thermoelectrics. The Seebeck coefficient as deduced from fig. 14 a, Fe as n-type, and the
corresponding plot for Ag as p-type [Wunderlich 2009-b] yield for both composites to
almost the same value, namely +/- 0.5mV/K. In the case of NaTaO
3
+ x Fe specimens, the
Seebeck voltage increases during the first three sintering cycles (1000
o
C 5h), and reached
this saturation value, which was confirmed to be stable even after eight sintering cycles. In
the case of Ag-doped NaTaO
3
, the value also increases, however, after the fourth sintering
cycle the Seebeck voltage drops to less than 30mV and the color turns into white again,
indicating a structural instability of the NaTaO
3
-Ag compound probably due to silver
evaporation. The temperature dependence of the electric resistivity was shown previously
[Wunderlich 2009-b, Wunderlich & Soga 2010] for both, n- and p-type specimens, with x= 50
wt%, which was found as the optimum concentration for low resistivity. According to the
thermal activation of the carriers an activation energy in the order of the band gap (1 eV) can
be estimated by fitting the data as shown in [Wunderlich 2009-b, Wunderlich & Soga 2010]
by the formula
= N
0
exp(-E
0
/2kT) |e|
e
. with E
0
activation energy.
There are further promising doping candidates, not yet checked, as Nb, or rare earth. As a
conclusion, it can be stated that only the light transition metals like Fe, Cr, Mn, Ni showed
remarkable Seebeck voltages. Among them, the closed-circuit measurements described in
the following section, lead to further restrictions.
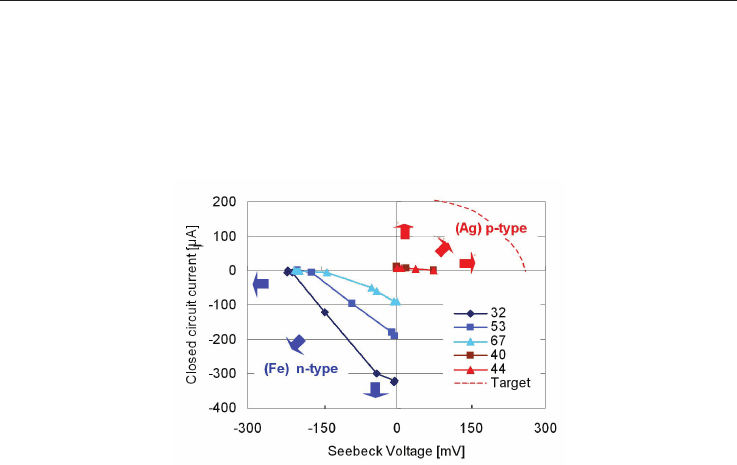
5.4 Electric current under closed circuit conditions
For power generation the performance under closed circuit conditions is important. Fig. 16
shows the measured current when different electric resistances as load are connected. While
both composites, the one processed from NaTaO
3
+x Fe and the NaTaO
3
- x Ag one, showed
large Seebeck voltage in the range of x = 50 to 70 wt%, the closed circuit current
measurements showed the highest value only for the specimen processed from NaTaO
3
+x
Fe with x= 50 wt%, which corresponds to NaTaO
3
+r Fe
2
O
3
with r = 32 mol% after sintering.
In the silver added composite, the specimen with 40 mol% Ag (about 50 wt%) yields to the
optimum between large Seebeck coefficient and low resistivity. For the NaTaO
3
-x Fe
2
O
3
-
composite, the specimen with x = 32 mol % shows the highest current of 320 A, but for the
Fig. 16. Seebeck Voltage and closed circuit current for n- and p-type NaTaO
3
with Fe- or Ag-
additions with the Mol-% as shown. The horizontal and vertical arrows indicate the target
for current and voltage increase, the inclined ones indicate the target for power
improvement. P- and n-type materials should have the same Seebeck voltage as expressed
by the target-line.
NaTaO
3
-x Ag-composite, it is only 1.2 A. For the silver added composite, a part of Ag gets
dissolved, another part gets oxidized as NaTa
1-x
Ag
x
O
3-y
+ t AgO
u
, when sintered in three
cycles (1000
o
C 5h). While NaTaO
3
- Fe
2
O
3
is a stable composite, the metallic Ag in the p-type
composite with its low melting point decomposes into an insulating oxide after four
sintering cycles (1000
o
C, 5h), and metallic silver balls at the surface.
The microstructure of the p-type material needs to be stabilized and optimized for
improving both, Seebeck voltage as well as resistivity. When this is realized, and the p-type
material would have had the same short-circuit current as suggested by the target line in fig.
16, it is expected that modules with both n- and p-type materials work optimal. As p- and n-
type material has been found, NaTaO
3
is suggested as a new thermoelectric for power
generation suitable for applications in an upper range of application temperatures (500 to
1100
o
C), when a sufficient performance is achieved as described in the next section.
5.5 Estimation of the figure-of-merit
The absolute value of the negative Seebeck Voltage increases linearly with the temperature
and reaches -320 mV at a temperature difference of 800 K as shown in fig. 14 a for the
specimen NaTaO
3
-50mol% Fe
2
O
3
. From the slope of the Seebeck voltage versus temperature
a Seebeck coefficient of -0.5 mV/K was estimated. Specimens in the range of 20 mol to 70
mol% Fe
2
O
3
showed all a Seebeck coefficient larger than -0.45 mV/K. From these data the
figure of merit can be deduced, a little bit more promising as previously [Wunderlich 2009-
b]. For the thermal conductivity in the worst case a high value of 5 W/(m K) was assumed
Development of Thermoelectric materials based on NaTaO3 - composite ceramics 17
Na Mg Al Si P
-- / / 0 / /
K * Ca Sc Ti V Cr Mn
Fe
Co Ni Cu Zn Ga Ge As
-30 / / -20 / -200 -30
-320
-20 -360 -20 / / / /
Rb Sr Y Zr Nb Mo Tc Ru Rh Pd
Ag
Cd In Sn Sb
/ / / / / -10/+10 / / / /
+250
/ / 0 0
Cs Ba Hf Ta W Re Os Ir Pt Au Hg Tl Pb Bi
/ / / -- -20 / / / / / / / / 0
* KTaO
3
+Fe
Fig. 15. Part of the periodic table showing the elements which were tested as doping
additives for NaTaO
3
. The vale refers to the Seebeck voltage in mV at T = 750K. In the case
of K it means KTaO
3
with Fe-additions. Only the two elements in bold letters (Fe, Ag)
showed a remarkable closed-circuit current.
Such measurements were performed by adding several metallic elements Me from the
periodic system NaTaO
3
+x Me specimens with x = 30, 50, 70, 90 wt%. Fig. 15 shows the
largest Seebeck voltage at T=800 K among these specimens, where the best results usually
were achieved for x around 50 wt%. Al and those semiconducting elements which were
measured did not dissolve in NaTaO
3
and such specimens remain white, a sign that they are
still insulators.
Specimens sintered from NaTaO
3
- x Ag powders with x= 30, 50, 60 wt% lead to p-type
thermoelectrics. The Seebeck coefficient as deduced from fig. 14 a, Fe as n-type, and the
corresponding plot for Ag as p-type [Wunderlich 2009-b] yield for both composites to
almost the same value, namely +/- 0.5mV/K. In the case of NaTaO
3
+ x Fe specimens, the
Seebeck voltage increases during the first three sintering cycles (1000
o
C 5h), and reached
this saturation value, which was confirmed to be stable even after eight sintering cycles. In
the case of Ag-doped NaTaO
3
, the value also increases, however, after the fourth sintering
cycle the Seebeck voltage drops to less than 30mV and the color turns into white again,
indicating a structural instability of the NaTaO
3
-Ag compound probably due to silver
evaporation. The temperature dependence of the electric resistivity was shown previously
[Wunderlich 2009-b, Wunderlich & Soga 2010] for both, n- and p-type specimens, with x= 50
wt%, which was found as the optimum concentration for low resistivity. According to the
thermal activation of the carriers an activation energy in the order of the band gap (1 eV) can
be estimated by fitting the data as shown in [Wunderlich 2009-b, Wunderlich & Soga 2010]
by the formula
= N
0
exp(-E
0
/2kT) |e|
e
. with E
0
activation energy.
There are further promising doping candidates, not yet checked, as Nb, or rare earth. As a
conclusion, it can be stated that only the light transition metals like Fe, Cr, Mn, Ni showed
remarkable Seebeck voltages. Among them, the closed-circuit measurements described in
the following section, lead to further restrictions.
5.4 Electric current under closed circuit conditions
For power generation the performance under closed circuit conditions is important. Fig. 16
shows the measured current when different electric resistances as load are connected. While
both composites, the one processed from NaTaO
3
+x Fe and the NaTaO
3
- x Ag one, showed
large Seebeck voltage in the range of x = 50 to 70 wt%, the closed circuit current
measurements showed the highest value only for the specimen processed from NaTaO
3
+x
Fe with x= 50 wt%, which corresponds to NaTaO
3
+r Fe
2
O
3
with r = 32 mol% after sintering.
In the silver added composite, the specimen with 40 mol% Ag (about 50 wt%) yields to the
optimum between large Seebeck coefficient and low resistivity. For the NaTaO
3
-x Fe
2
O
3
-
composite, the specimen with x = 32 mol % shows the highest current of 320 A, but for the
Fig. 16. Seebeck Voltage and closed circuit current for n- and p-type NaTaO
3
with Fe- or Ag-
additions with the Mol-% as shown. The horizontal and vertical arrows indicate the target
for current and voltage increase, the inclined ones indicate the target for power
improvement. P- and n-type materials should have the same Seebeck voltage as expressed
by the target-line.
NaTaO
3
-x Ag-composite, it is only 1.2 A. For the silver added composite, a part of Ag gets
dissolved, another part gets oxidized as NaTa
1-x
Ag
x
O
3-y
+ t AgO
u
, when sintered in three
cycles (1000
o
C 5h). While NaTaO
3
- Fe
2
O
3
is a stable composite, the metallic Ag in the p-type
composite with its low melting point decomposes into an insulating oxide after four
sintering cycles (1000
o
C, 5h), and metallic silver balls at the surface.
The microstructure of the p-type material needs to be stabilized and optimized for
improving both, Seebeck voltage as well as resistivity. When this is realized, and the p-type
material would have had the same short-circuit current as suggested by the target line in fig.
16, it is expected that modules with both n- and p-type materials work optimal. As p- and n-
type material has been found, NaTaO
3
is suggested as a new thermoelectric for power
generation suitable for applications in an upper range of application temperatures (500 to
1100
o
C), when a sufficient performance is achieved as described in the next section.
5.5 Estimation of the figure-of-merit
The absolute value of the negative Seebeck Voltage increases linearly with the temperature
and reaches -320 mV at a temperature difference of 800 K as shown in fig. 14 a for the
specimen NaTaO
3
-50mol% Fe
2
O
3
. From the slope of the Seebeck voltage versus temperature
a Seebeck coefficient of -0.5 mV/K was estimated. Specimens in the range of 20 mol to 70
mol% Fe
2
O
3
showed all a Seebeck coefficient larger than -0.45 mV/K. From these data the
figure of merit can be deduced, a little bit more promising as previously [Wunderlich 2009-
b]. For the thermal conductivity in the worst case a high value of 5 W/(m K) was assumed
Ceramic Materials 18
according to the range of usual ceramics. This leads to an estimation of the figure-of merit
ZT at 1000
o
C as:
2
S
Z
19
11
2
1010
5
S/m 1)/5.0(
K
KmW
KmV
,
5
'1000
1027.1
C
ZT
(5)
This estimated value of ZT is at the moment much lower than state-of-the-art materials, for
example SiGe, or the above mentioned Nb-doped SrTiO
3
, but materials development, like
improved sintering, higher solubility of Fe, higher conductivity etc., will definitely increase the
performance of NaTaO
3
, for which the following thermokinetic investigations are helpful.
6. Thermo-kinetic characterization
In order to clarify the sintering behavior of the NaTaO
3
-Fe
2
O
3
composite differential
scanning calorimetry (DSC) and thermo-gravimetric (TG) measurements were performed.
The development in the field of thermo-kinetics in the last decade allows the estimation of
activation energies for chemical reactions, when DSC and TG are measured simultaneously
with at least three different heating rates [Opfermann et al. 1992, Opfermann 2000]. The
analysis of the different sintering steps of alumina [Baca et al. 2001], and the oxidation of
Magnetite to Fe
2
O
3
[Sanders & Gallagher 2003] are examples, where this technique has
successfully been applied for ceramics.
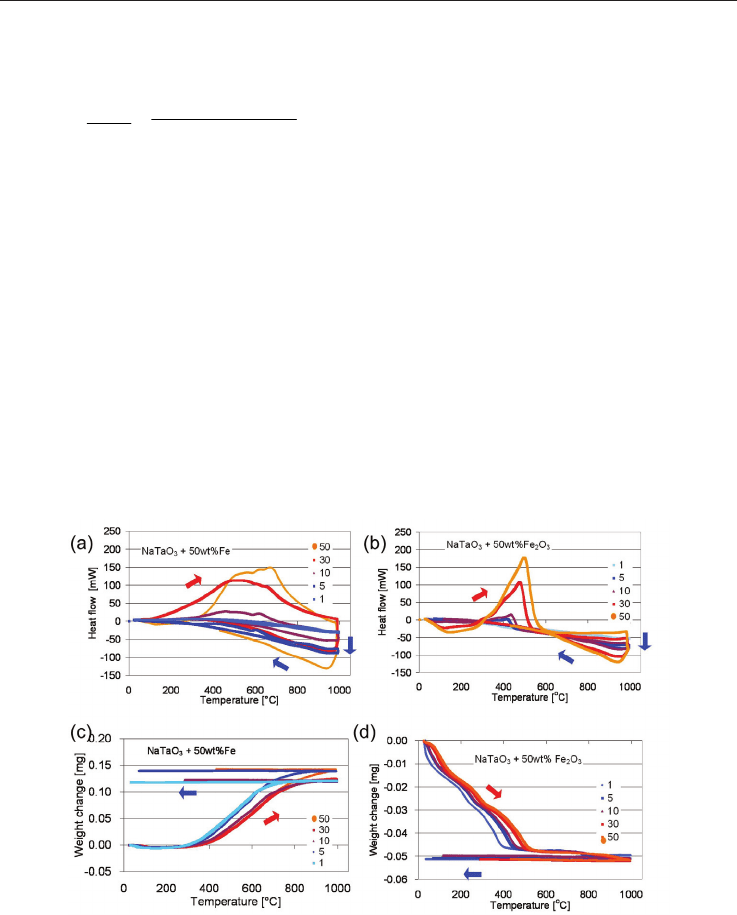
Fig. 17 Results of (a,b) DSC and (c,d) TGA measurements of (a,c) NaTaO
3
+ 50 wt% Fe-, and
(b,d) NaTaO
3
+ 50 wt% Fe
2
O
3
-powder specimens. The numbers in the inset refer to heating
rates in [K/min]. The red and blue arrows indicate heating and cooling, respectively.
Simultaneous DSC-TG measurements were performed on a SDT Q600 (T.A.instruments) by
heating two different sets of mixed powder samples (26 mg NaTaO
3
+ 50 wt% Fe, and 60 mg
NaTaO
3
+ 50 wt% Fe
2
O
3
) under air with five different heating rates up to 1000
O
C. The
results are shown in fig. 17. The thermo-gravimetric measurements showed that the
NaTaO
3
-50wt% Fe powder gains 0.13 mg in weight (fig. 17c, increase of 0.5%) and the
NaTaO
3
-50wt%Fe
2
O
3
powder looses 0.05 mg in weight (weight reduction of 0.2%). The fact
that the weight gain in fig. 17c is not the same for all heating rates can be explained by
concentration inhomogeneities in each specimen.
The interpretation of these results is that Fe gets oxidized forming Fe
2
O
3
which was
observed in the XRD pattern, see section 4 and [Wunderlich & Soga 2010]. The experimental
results showed that a part of Fe gets dissolved in NaTaO
3
, about 14 %. Assuming that the
same amount of Fe is dissolved in NaTaO
3
in both composites (NaTaO
3
+ 50 wt% Fe and
NaTaO
3
+ 50 wt% Fe
2
O
3
), this fact can explain why the weight decreases for the NaTaO
3
+
Fe
2
O
3
mixture. Namely, the dissolved Fe needs to be reduced from the initial Fe
2
O
3
and the
excess oxygen is released.
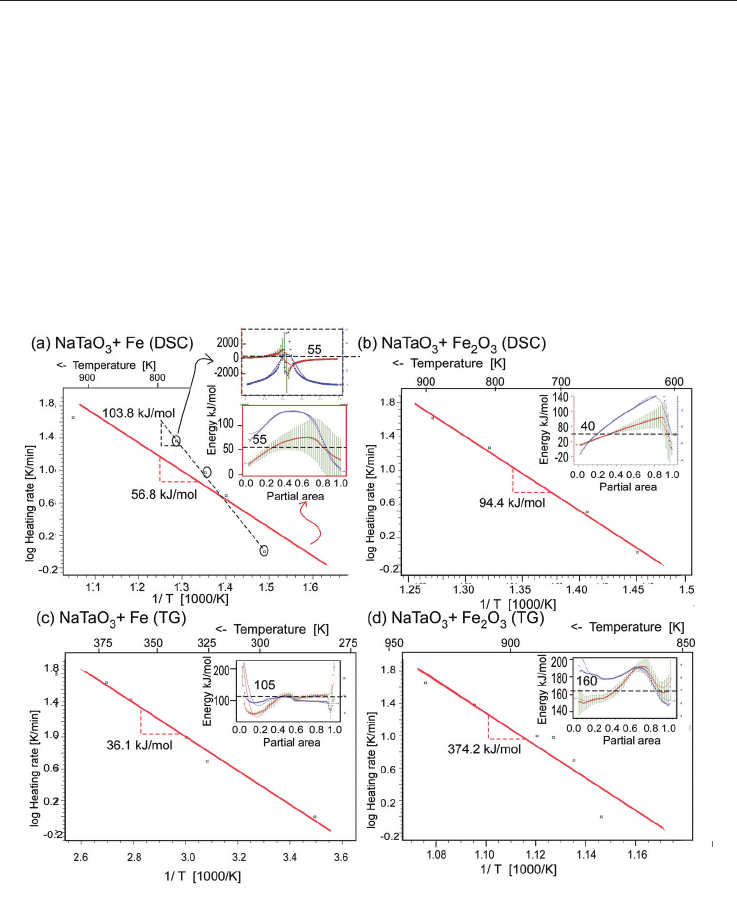
Fig. 18. Analysis of the (a,b) DSC-, (c,d) TG-data from fig. 17 for (a,c) NaTaO
3
+ 50 wt% Fe
and (b,d) NaTaO
3
+ 50 wt% Fe
2
O
3
using ASTM and Friedman method yielding to the
activation energy from the slope in the logarithmic plot heating rate versus inverse
temperature. The inset shows the distribution of the activation energy as a function of the
partial fraction.
The DSC measurements showed an exothermic peak for NaTaO
3
+ 50 wt% Fe (fig. 17 a),
namely a positive heat flow, with a broad maximum at 500
o
C and small wiggles at 690
o
C
Development of Thermoelectric materials based on NaTaO3 - composite ceramics 19
according to the range of usual ceramics. This leads to an estimation of the figure-of merit
ZT at 1000
o
C as:
2
S
Z
19
11
2
1010
5
S/m 1)/5.0(
K
KmW
KmV
,
5
'1000
1027.1
C
ZT
(5)
This estimated value of ZT is at the moment much lower than state-of-the-art materials, for
example SiGe, or the above mentioned Nb-doped SrTiO
3
, but materials development, like
improved sintering, higher solubility of Fe, higher conductivity etc., will definitely increase the
performance of NaTaO
3
, for which the following thermokinetic investigations are helpful.
6. Thermo-kinetic characterization
In order to clarify the sintering behavior of the NaTaO
3
-Fe
2
O
3
composite differential
scanning calorimetry (DSC) and thermo-gravimetric (TG) measurements were performed.
The development in the field of thermo-kinetics in the last decade allows the estimation of
activation energies for chemical reactions, when DSC and TG are measured simultaneously
with at least three different heating rates [Opfermann et al. 1992, Opfermann 2000]. The
analysis of the different sintering steps of alumina [Baca et al. 2001], and the oxidation of
Magnetite to Fe
2
O
3
[Sanders & Gallagher 2003] are examples, where this technique has
successfully been applied for ceramics.
Fig. 17 Results of (a,b) DSC and (c,d) TGA measurements of (a,c) NaTaO
3
+ 50 wt% Fe-, and
(b,d) NaTaO
3
+ 50 wt% Fe
2
O
3
-powder specimens. The numbers in the inset refer to heating
rates in [K/min]. The red and blue arrows indicate heating and cooling, respectively.
Simultaneous DSC-TG measurements were performed on a SDT Q600 (T.A.instruments) by
heating two different sets of mixed powder samples (26 mg NaTaO
3
+ 50 wt% Fe, and 60 mg
NaTaO
3
+ 50 wt% Fe
2
O
3
) under air with five different heating rates up to 1000
O
C. The
results are shown in fig. 17. The thermo-gravimetric measurements showed that the
NaTaO
3
-50wt% Fe powder gains 0.13 mg in weight (fig. 17c, increase of 0.5%) and the
NaTaO
3
-50wt%Fe
2
O
3
powder looses 0.05 mg in weight (weight reduction of 0.2%). The fact
that the weight gain in fig. 17c is not the same for all heating rates can be explained by
concentration inhomogeneities in each specimen.
The interpretation of these results is that Fe gets oxidized forming Fe
2
O
3
which was
observed in the XRD pattern, see section 4 and [Wunderlich & Soga 2010]. The experimental
results showed that a part of Fe gets dissolved in NaTaO
3
, about 14 %. Assuming that the
same amount of Fe is dissolved in NaTaO
3
in both composites (NaTaO
3
+ 50 wt% Fe and
NaTaO
3
+ 50 wt% Fe
2
O
3
), this fact can explain why the weight decreases for the NaTaO
3
+
Fe
2
O
3
mixture. Namely, the dissolved Fe needs to be reduced from the initial Fe
2
O
3
and the
excess oxygen is released.
Fig. 18. Analysis of the (a,b) DSC-, (c,d) TG-data from fig. 17 for (a,c) NaTaO
3
+ 50 wt% Fe
and (b,d) NaTaO
3
+ 50 wt% Fe
2
O
3
using ASTM and Friedman method yielding to the
activation energy from the slope in the logarithmic plot heating rate versus inverse
temperature. The inset shows the distribution of the activation energy as a function of the
partial fraction.
The DSC measurements showed an exothermic peak for NaTaO
3
+ 50 wt% Fe (fig. 17 a),
namely a positive heat flow, with a broad maximum at 500
o
C and small wiggles at 690
o
C

Ceramic Materials 20
and 700
o
C, present in data obtained at all heating rates at the same temperature. On the
other hand, at the NaTaO
3
-Fe
2
O
3
mixture the main exothermic peak shifts from 410
O
C at
slow heating rates (1 K/min, 3 K/min) to 510
o
C at the fastest heating rate (50 K/min). At
these temperatures the corresponding TG-data showed a large decrease in weight,
indicating a chemical reaction.
The Netzsch Thermokinetics software package version 3 [Opfermann 2000] was used for
data analysis. All four sets of data were analyzed separately and only the data during
heating were used. For each set, the parameter-free analysis of the activation energy
according to ASTM E698 was performed as shown in fig. 18. Then Friedman analysis
[Opfermann et al. 1992, Opfermann 2000] of the activation energy as a function of the partial
area was performed as shown in the insets of fig. 18.
The results show an activation energy of 56.8 kJ/mol for the NaTaO
3
+ 50 wt% Fe- specimen
(fig. 18a). The activation energy increases to 103.8 kJ/mol, when only the three data points
with best correlation are used, as shown with the circles. In this case the Friedman analysis
yields a curve, which looks in its shape like a resonance curve (inset of fig. 18a, upper part,
fig. 5). As a function of partial area the energy increases to a partial area of 50%, then
suddenly drops down and increases asymptotically. The pre-factor a of the logarithm shown
in blue in the inset of fig. 18a has a maximum at the transition point at the partial area 0.5.
The activation energy of DSC of the Fe specimen (fig. 18a) is estimated as 118.4 kJ/mol,
when also the fourth data point with good matching is included. This energy is exactly the
formation enthalpy for Fe
3
O
4
magnetite, but concerning the oxidation states (0, +2, +3, +4),
the sequence is [Majzlan et al.2004]:
Fe – FeO (-266.3 kJ/mol) – Fe
2
O
3
(-824.2 kJ/mol) – Fe
3
O
4
(-118.4 kJ/mol) (6)
Such a change in oxidation state is impossible, and the formation of Fe
3
O
4
magnetite is
unlikely; instead, the formation of FeO could explain the change of the color from white to
black for the NaTaO
3
+ Fe composite and from brown to black for the NaTaO
3
+Fe
2
O
3
composite. The XRD spectrum, which was measured on bulk specimens, however, showed
only evidence for the presence of Fe
2
O
3
. Also, the other activation energies (fig. 18 c, d) do
not fit to the mentioned sequence. The small activation energy of 36 kJ/mol estimated from
TG on Fe is explained by the solution of Fe into the NaTaO
3
lattice. The Friedman analysis of
this data shows the smoothest fit, almost constant energy for the entire region of the partial
area (inset of fig. 18b).
As summarized in the following section, the sintering behavior of the NaTaO
3
-Fe
2
O
3
composite produced from Fe or Fe
2
O
3
is a combined reaction between Fe-solution in the
Perovskite lattice, the oxidation of Fe and the reaction bonding, so the quantitative analysis
of the DSC and TG data remains a challenge, but some preliminary suggestions are made
during the following discussion.
7. Discussion: Micro-structural and electronic model of NaTaO
3
In this section the above mentioned data are discussed and ideas for further development
are provided. A detailed understanding for the reaction behavior and thermoelectric
properties of NaTaO
3
+ Fe composite would provide the opportunity to increase its
performance. Two facts are obvious and should be tried first. The first task is to improve the
sintered density as the present material still contains pores (fig. 12). The next step is the
increase in electric conductivity, which is considered as the main factor for the poor figure-
of-merit. Thereafter, the Ag-doping need to be stabilized.
The quantitative explanation of the doping requires detailed understanding of the defect
chemistry of iron oxides and Perovskites and is still a challenge. In the following, we present
a suggestion for the coupled reaction equation, where the quantitative values are more or
less rough estimations. NaTaO
3
sintered with Fe reacts in the following way to the n-type
composite:
NaTaO
3
+ x Fe -> NaTa
1-x
Fe
x
O
3-y
+ y O + 2x e
-
with x = 0.14, y = ~ 2/3 x
z Fe + (y + w) O -> (z-x)/2 Fe
2
O
3-u
with u = f(v, w, y, x, z)
(7)
(8)
where z is the molar ratio of the amount of NaTaO
3
relative to Fe in the mixed powder
specimens before sintering. y is the estimated amount of oxygen released by the reduction of
NaTaO
3
when Fe is dissolved, which gives two electrons and releases instead one of the
three oxygen atoms. The value of x=0.14, maximum solubility of Fe in NaTaO
3
, is an
experimental result of the SEM-EDX analysis (section 4). w the weight gain in oxygen taken
from air in order to oxidize metallic Fe, and is estimated from the TG –data measurements
as w = 0.1. u is a complicate function of the other quantities and estimated from the
differences between TG-data of the NaTaO
3
+ z Fe and NaTaO
3
+ x Fe
2
O
3 u
composites as u =
0.2…0.6, while u=1 would yield to FeO, which was not observed in the XRD data. The sum
formula yields to
NaTaO
3
+ z Fe + w O -> NaTa
1-x
Fe
x
O
3-
y
+ t Fe
2
O
3-u
+ 2x e
-
with t = (z-x)/2 (9)
Similarly, sintering from a certain amount m of Fe
2
O
3
instead of Fe yields to the p-type
composite:
NaTaO
3
+ m Fe
2
O
3
-> NaTa
1-r
Fe
r
O
3-s
+ v Fe
2
O
3-q
+ s h
+
+ (q+s) O
with r < x, s < y, q =~ 0.5 < u
(10)
The ab-initio calculations explained in section 3, as well as the experiments, confirmed that
Fe is a n-type dopant, and Ag a p-type dopant. In conventional semiconductors like Si as in
SrTiO
3
the doping situation is straight-forward as illustrated in fig. 4 (section 2.2). Added
elements from the right side in the periodic table provide one additional electron, so the
material becomes n-type, those from the left side provide a hole and the material becomes p-
type. In pure NaTaO
3
the valence of each elements are Na
1+
Ta
5+
O
2-
3
. Doping with Fe, which
has usual the valence Fe
3+
, would create two holes. In contrary, as this material is a n-type
material in TE-experiments, electrons are released, which cause the oxygen reduction, the
same mechanism as it happens for Nb-doped SrTiO
3
illustrated in fig. 4 b. On the other
hand, oxygen reduction of the specimens occurs, when NaTaO
3
is sintered with Fe
2
O
3
, then
yielding to p-type behavior. Thus, it is concluded that the reaction path and the related
oxygen partial pressure decide, whether this material is an n- or p-type material.
The thermoelectric data measured on the composite NaTa
1-x
Fe
x
O
3-y
+ z Mol% Fe
2
O
3
with
z=32 % and produced from Fe, showed the highest n-type Seebeck voltage (-320mV at

Development of Thermoelectric materials based on NaTaO3 - composite ceramics 21
and 700
o
C, present in data obtained at all heating rates at the same temperature. On the
other hand, at the NaTaO
3
-Fe
2
O
3
mixture the main exothermic peak shifts from 410
O
C at
slow heating rates (1 K/min, 3 K/min) to 510
o
C at the fastest heating rate (50 K/min). At
these temperatures the corresponding TG-data showed a large decrease in weight,
indicating a chemical reaction.
The Netzsch Thermokinetics software package version 3 [Opfermann 2000] was used for
data analysis. All four sets of data were analyzed separately and only the data during
heating were used. For each set, the parameter-free analysis of the activation energy
according to ASTM E698 was performed as shown in fig. 18. Then Friedman analysis
[Opfermann et al. 1992, Opfermann 2000] of the activation energy as a function of the partial
area was performed as shown in the insets of fig. 18.
The results show an activation energy of 56.8 kJ/mol for the NaTaO
3
+ 50 wt% Fe- specimen
(fig. 18a). The activation energy increases to 103.8 kJ/mol, when only the three data points
with best correlation are used, as shown with the circles. In this case the Friedman analysis
yields a curve, which looks in its shape like a resonance curve (inset of fig. 18a, upper part,
fig. 5). As a function of partial area the energy increases to a partial area of 50%, then
suddenly drops down and increases asymptotically. The pre-factor a of the logarithm shown
in blue in the inset of fig. 18a has a maximum at the transition point at the partial area 0.5.
The activation energy of DSC of the Fe specimen (fig. 18a) is estimated as 118.4 kJ/mol,
when also the fourth data point with good matching is included. This energy is exactly the
formation enthalpy for Fe
3
O
4
magnetite, but concerning the oxidation states (0, +2, +3, +4),
the sequence is [Majzlan et al.2004]:
Fe – FeO (-266.3 kJ/mol) – Fe
2
O
3
(-824.2 kJ/mol) – Fe
3
O
4
(-118.4 kJ/mol) (6)
Such a change in oxidation state is impossible, and the formation of Fe
3
O
4
magnetite is
unlikely; instead, the formation of FeO could explain the change of the color from white to
black for the NaTaO
3
+ Fe composite and from brown to black for the NaTaO
3
+Fe
2
O
3
composite. The XRD spectrum, which was measured on bulk specimens, however, showed
only evidence for the presence of Fe
2
O
3
. Also, the other activation energies (fig. 18 c, d) do
not fit to the mentioned sequence. The small activation energy of 36 kJ/mol estimated from
TG on Fe is explained by the solution of Fe into the NaTaO
3
lattice. The Friedman analysis of
this data shows the smoothest fit, almost constant energy for the entire region of the partial
area (inset of fig. 18b).
As summarized in the following section, the sintering behavior of the NaTaO
3
-Fe
2
O
3
composite produced from Fe or Fe
2
O
3
is a combined reaction between Fe-solution in the
Perovskite lattice, the oxidation of Fe and the reaction bonding, so the quantitative analysis
of the DSC and TG data remains a challenge, but some preliminary suggestions are made
during the following discussion.
7. Discussion: Micro-structural and electronic model of NaTaO
3
In this section the above mentioned data are discussed and ideas for further development
are provided. A detailed understanding for the reaction behavior and thermoelectric
properties of NaTaO
3
+ Fe composite would provide the opportunity to increase its
performance. Two facts are obvious and should be tried first. The first task is to improve the
sintered density as the present material still contains pores (fig. 12). The next step is the
increase in electric conductivity, which is considered as the main factor for the poor figure-
of-merit. Thereafter, the Ag-doping need to be stabilized.
The quantitative explanation of the doping requires detailed understanding of the defect
chemistry of iron oxides and Perovskites and is still a challenge. In the following, we present
a suggestion for the coupled reaction equation, where the quantitative values are more or
less rough estimations. NaTaO
3
sintered with Fe reacts in the following way to the n-type
composite:
NaTaO
3
+ x Fe -> NaTa
1-x
Fe
x
O
3-y
+ y O + 2x e
-
with x = 0.14, y = ~ 2/3 x
z Fe + (y + w) O -> (z-x)/2 Fe
2
O
3-u
with u = f(v, w, y, x, z)
(7)
(8)
where z is the molar ratio of the amount of NaTaO
3
relative to Fe in the mixed powder
specimens before sintering. y is the estimated amount of oxygen released by the reduction of
NaTaO
3
when Fe is dissolved, which gives two electrons and releases instead one of the
three oxygen atoms. The value of x=0.14, maximum solubility of Fe in NaTaO
3
, is an
experimental result of the SEM-EDX analysis (section 4). w the weight gain in oxygen taken
from air in order to oxidize metallic Fe, and is estimated from the TG –data measurements
as w = 0.1. u is a complicate function of the other quantities and estimated from the
differences between TG-data of the NaTaO
3
+ z Fe and NaTaO
3
+ x Fe
2
O
3 u
composites as u =
0.2…0.6, while u=1 would yield to FeO, which was not observed in the XRD data. The sum
formula yields to
NaTaO
3
+ z Fe + w O -> NaTa
1-x
Fe
x
O
3-y
+ t Fe
2
O
3-u
+ 2x e
-
with t = (z-x)/2 (9)
Similarly, sintering from a certain amount m of Fe
2
O
3
instead of Fe yields to the p-type
composite:
NaTaO
3
+ m Fe
2
O
3
-> NaTa
1-r
Fe
r
O
3-s
+ v Fe
2
O
3-q
+ s h
+
+ (q+s) O
with r < x, s < y, q =~ 0.5 < u
(10)
The ab-initio calculations explained in section 3, as well as the experiments, confirmed that
Fe is a n-type dopant, and Ag a p-type dopant. In conventional semiconductors like Si as in
SrTiO
3
the doping situation is straight-forward as illustrated in fig. 4 (section 2.2). Added
elements from the right side in the periodic table provide one additional electron, so the
material becomes n-type, those from the left side provide a hole and the material becomes p-
type. In pure NaTaO
3
the valence of each elements are Na
1+
Ta
5+
O
2-
3
. Doping with Fe, which
has usual the valence Fe
3+
, would create two holes. In contrary, as this material is a n-type
material in TE-experiments, electrons are released, which cause the oxygen reduction, the
same mechanism as it happens for Nb-doped SrTiO
3
illustrated in fig. 4 b. On the other
hand, oxygen reduction of the specimens occurs, when NaTaO
3
is sintered with Fe
2
O
3
, then
yielding to p-type behavior. Thus, it is concluded that the reaction path and the related
oxygen partial pressure decide, whether this material is an n- or p-type material.
The thermoelectric data measured on the composite NaTa
1-x
Fe
x
O
3-y
+ z Mol% Fe
2
O
3
with
z=32 % and produced from Fe, showed the highest n-type Seebeck voltage (-320mV at

Ceramic Materials 22
T=800K). As the exact oxygen content has not yet been measured, the reason for the
Seebeck voltage remains unknown. One explanation can be found by considering
percolation theory for composite materials consisting of the main phase A and inserted
minor phase B. The volume fraction of 32% is the border line, where the entire connection
between A-particles is changed, and connection between B-particles become dominant. In
other words, around this concentration range the interfaces between A-B phase are
dominant for the materials properties, while at lower concentrations A-phase and at higher
concentrations the B-phase properties are dominant. This fact emphasizes that interface
properties of this composite material are important.
At composite materials, the Fermi level of phase A and B are adjusted at the interface
leading to a p-n-junction, when a remarkable difference between the Fermi level exists. In
semiconductor engineering this is known as space charge region (SCR) which forms a large
electric field on nano-scale at the p-n junction. In material science this has been emphasized
also for improving properties [Gleiter et al. 2001]. In Co-based perovskite thermoelectric
composite material this leads to time-dependent pyroelectric behavior [Wunderlich et al.
2009-d]. The strong electric field at the space charge region sucks the electrons towards the
boundaries, in which they can travel due to the confinement of the two-dimensional electron
gas (2DEG) faster than in usual ceramics. A difference in the electric field at grain
boundaries between hot and cold end is necessary to explain the Seebeck voltage leading to
a small net electric field macroscopically. The improvement of TE-properties due to 2DEG
has been mentioned in section 2.3 especially the discovery of an ultra-high Seebeck-
coefficent at the Nb-SrTiO
3
monolayer embedded in SrTiO
3
[Mune et al. 2007]. Another
evidence that interfaces play an important role, is the finding that certain interfaces can filter
crossing electrons according to their energy [Vashaee & Shakouri 2004]. This filtering
behavior can explain enhanced thermoelectric performance, because electron-phonon
interaction is changed and recombination of excited electrons is suppressed. Such
consideration together with future improvement of the NaTaO
3
composites, such as nano-
structuring or proper doping are expected to yield to materials with large Seebeck
coefficient.
8. Conclusions
Historically, the intensive research and development of perovskite ceramics as microwave
resonators in portable phones has accumulated much knowledge, from which Nb-SrTiO
3
was developed as semiconductor with high performance suitable for thermoelectric
applications. The search for materials with large effective mass yielded then from Nb-SrTiO
3
to NaTaO
3
. The following findings have been described in this book chapter:
(1) At present, the best n-type TE material is NaTa
1-x
Fe
x
O
3-y
+ t Fe
2
O
3-u
with x = 0.14, t = 32
Mol-% and a Seebeck coefficient of 0.5 mV/K and a high closed circuit current of 0.25 mA.
(2) This material can be processed by reaction sintering of NaTaO
3
+ z Fe with z =50 wt%,
while sintering of NaTaO
3
+ r Fe
2
O
3
with r = 50 wt% leads to a p-type thermoelectric
material.
(3) The remarkable conductivity above 500
o
C can be improved by denser sintering (several
cycles 1000oC 5h), as well as the ZT, in order to make NaTaO
3
+ z Fe compatible with other
materials.
(4) The Seebeck coefficient of the p-type-TE material NaTa
1-x
Ag
x
O
3-y
+ t AgO
u
is also 0.5
mV/K with a yet small closed circuit current of 0.001 mA.
(5) The NaTaO
3
+ z Cu composite shows +/-20 mV high Seebeck voltage pulses when the
heat flow is reversed, which might be utilized in a phonon flow-meter.
Further improvement of this promising material is expected. The goals for further materials
development of NaTaO
3
– Fe
2
O
3
composite are:
(1) Improvement of the sintering density,
(2) Improvement of the electric conductivity,
(3) Increase of the solubility of Fe or other elements into the cubic structure of NaTaO
3
,
(4) Search for co-doping methods to increase of the charier concentration,
(5) Stabilization of the solubility of Ag in NaTaO
3
for example by co-doping of other
elements
(6) Clarification of the reaction path during sintering.
(7) Finally the ultimate goal is most important: Search for n- and p-type TE-materials with
higher efficiency.
This material has a great potential as thermoelectric material, especially when nano-layered
composites are considered.
9. Acknowledgements
The publisher suggested this contribution as an invited paper, which is gratefully
acknowledged. Experimental data were provided by Susumu Soga, Yoshiyuki Kondo,
Naotoshi Okabe and Wataru Sasaki , which is appreciated gratefully.
10. References
[Baca et al. 2001] Baca L., Plewa P., Pach L., and J. Opfermann, Kinetic Analysis
Crystallixation of a-Al2O3 by dynamic DTA technique, Journal of Thermal Analysis
and Calorimetry 66 (2001) 803-813
[Bobnar et al. 2002] Bobnar V., Lunkenheimer P., Hemberger J., Loidl A., Lichtenberg F., and
Mannhart J., Dielectric properties and charge transport in the (Sr,La)NbO3.5-x
system, Phys. Rev. B 65, 155115 (2002)
[Bulusu & Walker 2008] Bulusu A., Walker D.G., Review of electronic transport models for
thermoelectric materials, Superlattices and Microstructures 44 [1] (2008) 1-36,
doi:10.1016/j.spmi.2008.02.008
[Claussen et al. 1996] Claussen N., Garcia D.E., Janssen R., Reaction Sintering of Alumina-
Aluminide Alloys (3A), J. Mater. Res.11 [11] (1996) 2884-2888, doi:
10.1557/JMR.1996.0364
[Coey et al. 1999] Coey J.M.D., Viret M., Molnar S.von, Mixed valence magnetites, Adv. Phys.
48 (1999) 167
[Culp et al. 2006] Culp S.R., Poon S.J., Hickman M., Tritt T.M., Blumm H., Effect of
substitutions on the thermoelectric figure of merit of half-Heusler phases at 800 °C,
Appl. Phys. Lett. 88, (2006) 042106 1-3, doi: 10.1063/1.2168019
[Gleiter et al. 2001] Gleiter H., Weißmüller J., Wollersheim O., Würschum R.,
Nanocrystalline materials: A way to solids with tunable electronic structures and
properties?, Acta materialia 49 (2001) 737 – 745, doi:10.1016/S1359-6454(00)00221-4