Yellampalli S. (ed.) Carbon Nanotubes - Polymer Nanocomposites
Подождите немного. Документ загружается.

Characterization of Nanotube - Reinforced Polymer Composites
157
Several load-transfer models have been proposed and examined using atomistic molecular
dynamic simulations. Most recent molecular dynamics simulations suggest that weak van
der Waals force (Srivastava et al., 2003), as well as thermal expansion mismatch can
contribute to strong interfacial interaction (Wong et al., 2003; Zhang & Wang, 2005).
Panhuis’s model suggests that the polymer chains will adapt their conformations to wrap
around a single CNT (Panhuis et al., 2003; Wong et al., 2003). Frankland’s model suggests
that a small fraction of chemical bonds are formed between polymers and carbon atoms of
the CNTs thus cross-links are formed between the matrix and CNTs (Frankland et al., 2002).
Chemical bonding between CNT and polymer is apparent in the adhesion of polymers to
CNT on the fracture surface through transmission electron microscopy (TEM) (Bower et al.,
1999). However, Raman spectroscopy along with the SEM images of fracture surface by
Ajayan et al. showed the sliding of SWNT bundles with respect to the matrix suggesting that
the actual load transfer was poor between CNT and the polymer matrix, which rules out the
chemical bonding model (Ajayan et al., 2000). A number of experiments have been carried
out to test these models for the interaction between polymer matrix and CNTs (SWNTs and
MWNTs) through tensile tests, microscopy and x-ray scattering. Deformation of the CNTs
observed by x-ray scattering measurements (see section 3.3) shows an interaction between
the matrix and CNTs that is sufficient to transfer the load from the matrix to the CNTs
(Wang et al.,2008b). Actual measurements of the adhesion between the matrix and CNTs
were also carried out using scanning probe microscope to pull out the CNTs from the matrix
(Cooper et al., 2002). Coleman et al. found that a layer of polymer attached to the CNTs after
pullout was very similar to the crystalline polymer coating nucleated by the MWNTs. The
presence of interfacial crystalline layers partly contributes to the mechanical properties of
composites (Coleman et al., 2006). Pull-out measurement can also be carried out by atomic
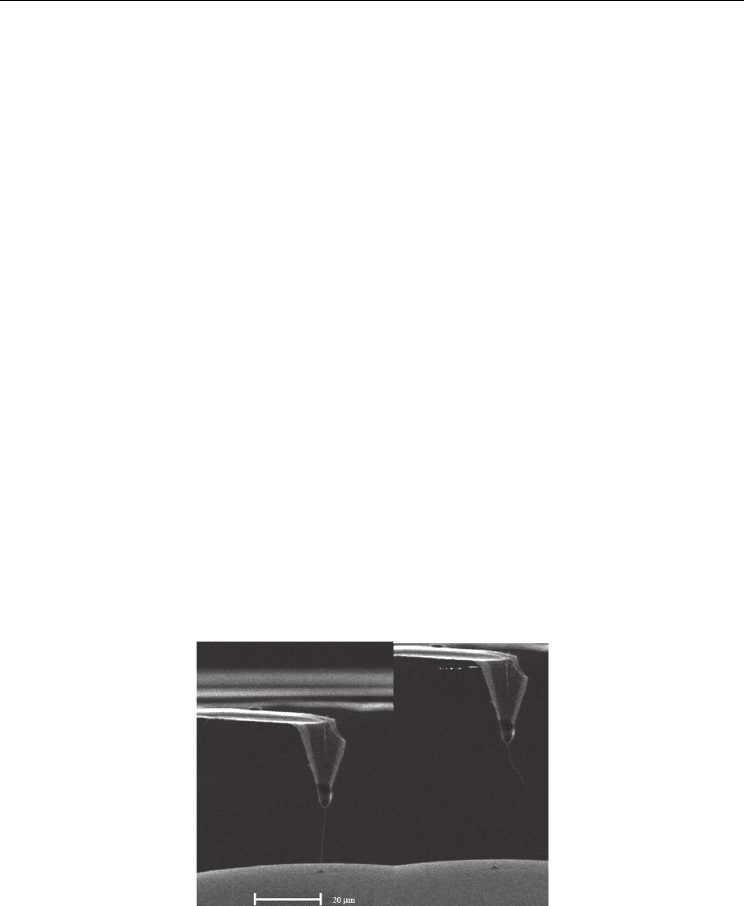
force microscopy (AFM). Barber et al. attached one end of a single CNT to the tip of AFM
and embedded the other end into the polymer matrix. The critical force needed to pull the
nanotube from the polymer matrix was then recorded (Figure 1).
Fig. 1. Left panel shows that one end of a single CNT is attached to the AFM tip and the
other is embedded in the solid polymer matrix. Right panel shows the process of pull-out of
CNT. The critical force needed for pull-out can be recorded by AFM (Reprinted from
Philosophical Transactions of the Royal Society A: Mathematical, Physical and Engineering
Sciences, vol. 366, W. Wang, P. Ciselli, E. Kuznetsov, T. Peijs and A.H. Barber. “Effective
reinforcement in carbon nanotube-polymer composites”, Figure 2, Copyright 2008, with
permission from the Royal Society.).

Carbon Nanotubes – Polymer Nanocomposites
158
Because of the interfacial interaction between CNTs and the polymer matrix, the properties
of the matrix in the interfacial regions are different from the bulk materials (Schadler, 2007).
CNTs dispersed in the polymer matrix, despite the small volume fraction (usually 1-5 vol%),
enhance the overall mechanical properties, also affect the structure of the matrix during
conventional processing. Many observations show that the presence of CNTs can affect the
crystallization behaviors of the polymers (Brosse et al., 2008; Grady et al., 2002; Liu et al.,
2004) and alter the morphology of matrix (Brosse et al., 2008; Chatterjee et al., 2007). For
instance, instead of the expected spherulites, crystalline lamellae were observed growing
perpendicular to the surface of CNTs. (Brosse et al., 2008). Therefore, the microstructure of
the polymer matrix should be taken into account when evaluating the performance of
nanocomposites (Advani, 2006).
Two other factors that affect the performance of CNT-reinforced nanocomposites are the
degree of dispersion and alignment of nanotubes. Poor or nonuniform dispersion causes the
fillers to aggregate, acting as defect sites (Advani, 2006). Dispersion process is affected by
interactions of CNT-CNT and CNT-matrix. It is controlled by several factors such as filler’s
size, specific surface area, and interfacial volumes (Moniruzzaman & Winey, 2006). The
degree of dispersion of CNTs in polymer matrix can be assessed using small angle x-ray
scattering as described in the following section. Rheological study of dispersions of MWNTs
in the polymer matrix by Huang et al (Huang et al., 2006) also suggests that a satisfactory
dispersion can be achieved if the mixing time exceeds a critical value (characteristic mixing
time).
2.3 Processing of PNCs
CNTs are dispersed into the polymer matrix to form a polymer/CNTs composite, and there
are several ways to achieve a good dispersion. Following is a condensed version of the
various processing methods as discussed by Coleman et al. (Coleman et al., 2006). Solution
processing is the easiest if the polymer can be dissolved in a suitable solvent. Typically,
nanotubes well dispersed in a solvent is mixed with a polymer solution with energetic
agitation (e.g., sonication), and the solvent is allowed to evaporate in a controlled way
leaving a composite film. For insoluble thermoplastic polymers, the polymer is heated above
either glass transition (if amorphous) or melt temperature (if semicrystalline) to form a
viscous liquid, and the CNTs are mixed into this viscous liquid to be then processed into a
fiber or a film using common production processes. For thermosetting polymers such as
epoxy, the CNTs are blended when epoxy is in a liquid state, and the mixture is then
allowed to cure. Chemical processing of Polymer/CNTs composites aims at formation of
chemical bonds between the polymer matrix and the CNTs; this provides for stronger
interaction between the polymer and CNTs and better dispersion, and thus results in better
mechanical properties. Chemical methods include in-situ polymerization and
functionalization of CNTs with polymer, also called polymer grafting.
3. Characterization of CNT/Polymer composites
Although the CNTs’ high strength and stiffness as well as high aspect ratio promise
significant improvement in mechanical properties of polymer nanocomposites (Treacy et
al., 1996), the actual measured enhancement is below these expectations (Schaefer et al.,
2003). The major reason might be the intrinsic van der Waals’ attraction makes CNTs
entangled agglomerates incapable of fully blending into the polymer matrix. Since the four

Characterization of Nanotube - Reinforced Polymer Composites
159
factors important to the reinforcement are CNTs’ aspect ratio, alignment, dispersion, and
interfacial interactions (Coleman et al., 2006), it is desirable to examine the morphology of
CNTs in the polymer matrix. Several methods including x-ray diffraction, Raman
spectroscopy, scanning and transmission electron microscopy are employed to
characterize the structure, morphology and properties of carbon nanotube-reinforced
polymer nanocomposites.
3.1 Electron microscopy
Transmission electron microscopy (TEM) and scanning electron microscopy (SEM) enable
the visualization of the microscopic structure and morphology of CNTs in composites at
resolution down to 0.1 nm (Michler, 2008; Sawyer et al., 2010). The limitations of using
electron beam to probe the polymer are the low contrast (most polymers are made of light
elements) and radiation damage. TEM is used to probe the bulk structure from thin sections
of the material, and SEM to examine the surfaces. In addition to imaging, TEM is also used
to carry out micromechanical measurements. Examples of these applications will be
illustrated below.
3.1.1 Dispersion and alignment of the CNTs
One of the primary uses of microscopy is characterizing the dispersion and alignment of the
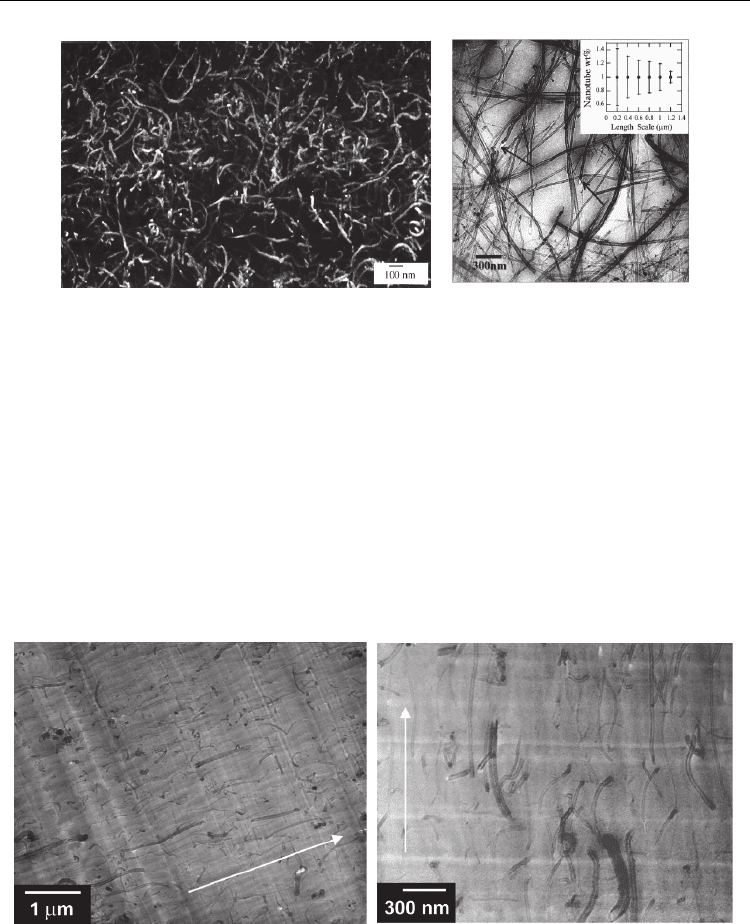
nanotubes in the polymers. Figure 2a is an SEM image from a composite prepared by
mixing aqueous solution poly(vinyl alcohol) with CNT dispersions followed by subsequent
casting and controlled water evaporation (Shaffer & Windle, 1999). It shows homogeneous
dispersion of the nanotubes even at 50 wt% loading. By examining the fracture surface using
SEM, they confirmed the uniform dispersion of CNTs. Figure 2b shows the use of TEM to
examine the dispersion of CNTs (Qian et al., 2000). In this experiment Qian et al. used high-
energy sonication to disperse MWNTs (predispersed in toluene) into polystyrene (PS)
dissolved in toluene, and the solvent was then evaporated to produce 0.4 mm thick films.
Figure 2b shows 34 nm diameter MWNTs well dispersed down to the m length scales. The
inset is a plot of the loading of the CNT’s at different length scale, and shows that
homogeneity increases (decrease in standard deviation) with increase in the length scale.
Furthermore, the TEM images also reveal defects that were present as a result of the
polymer shrinkage primarily at the end of the nanotubes. Other than the quality of
dispersion, both of these nanoscale images show that in PNCs, as pointed out by Fisher et
al., the nanotubes are curved instead of being straight. Based on these observations, Fisher et
al. illustrated that the reduction of effective modulus of CNT-reinforced materials is due to
the curvature of embedded CNTs (Fisher et al., 2002).
Figure 3 illustrates the degree of alignment that can be achieved in PNC composites as seen
in a TEM image (Thostenson & Chou, 2002). Unlike the two examples discussed above, in
this instance, Thostenson & Chou extruded the polymer (polystyrene, PS) and a master
batch of nanotube dispersed in PS using a micro-compounder. The film coming out of a
rectangular die was drawn and solidified by passing over a chill roll. TEM was used to
characterize the dispersion and alignment of MWNTs in polymer films. Figure 3a shows the
large-scale dispersion and overall alignment of the carbon nanotubes and Figure 3b shows
the alignment of the individual nanotubes. Examination of the drawn films showed that a
draw ratio of five was sufficient to achieve a good nanotube alignment.
Carbon Nanotubes – Polymer Nanocomposites
160
Fig. 2. Left Panel (a): A SEM image for 50 wt% CNT/ Poly(vinyl alcohol) composites (S.P.
Shaffer and A.H. Windle, “Fabrication and characterization of carbon nanotube/poly(vinyl
alcohol) composites”. Advanced materials (1999). Vol. 11. 937-941. Copyright Wiley-VCH
Verlag GmbH & Co. KGaA. Reproduced with permission.). Right panel (b): An example of
TEM image at 1 m length scale showing homogeneously dispersed MWNT in polystyrene
(PS) matrix. Homogeneity of nanotube dispersion was evaluated by assessing the weight
fraction of nanotubes in different areas in the TEM images for different length scale. The
inset shows that homogeneity is greater at 1.2 μm length scale (small error bar) than lower
length scale. An arrow in the image indicates the defects present at the nanotube ends
(Reprinted with permission from D.Qian, E.C. Dickey, R. Andrews and T. Rantell., “Load
transfer and deformation mechanisms in carbon nanotube-polystyrene composites”,
Applied Physics Letters, vol. 76, 2868-2870. Copyright 2000, American Institute of Physics.)
Fig. 3. TEM images of dispersion and alignment of CNTs in nanocomposites films. The
arrows indicate flow/drawing direction. Left panel (a): TEM at length scale of micrometer.
Right panel (b): TEM at length scale of nanometer (Reprinted with permission from E.T.
Thostenson and T.W. Chou, “Aligned multi-walled carbon nanotube-reinforced composites:
processing and mechanical characterization”, J. Phys. D: Appl. Phys., vol. 35, L77-L80.
Copyright 2002, Institute of Physics Publishing.).
Characterization of Nanotube - Reinforced Polymer Composites
161
3.1.2 Mechanical properties of CNTs
TEM is also used to measure the mechanical properties and to study the deformation
mechanism in PNCs. In fact, the Young’s modulus of CNTs, which is hard to measure by
conventional means, was first directly measured using TEM from the thermal vibration
amplitudes of CNTs, and thus confirming the predicted axial stiffness on the scale of
terapascal (TPa) and the high axial strength due to the in-plane graphitic structure of CNTs
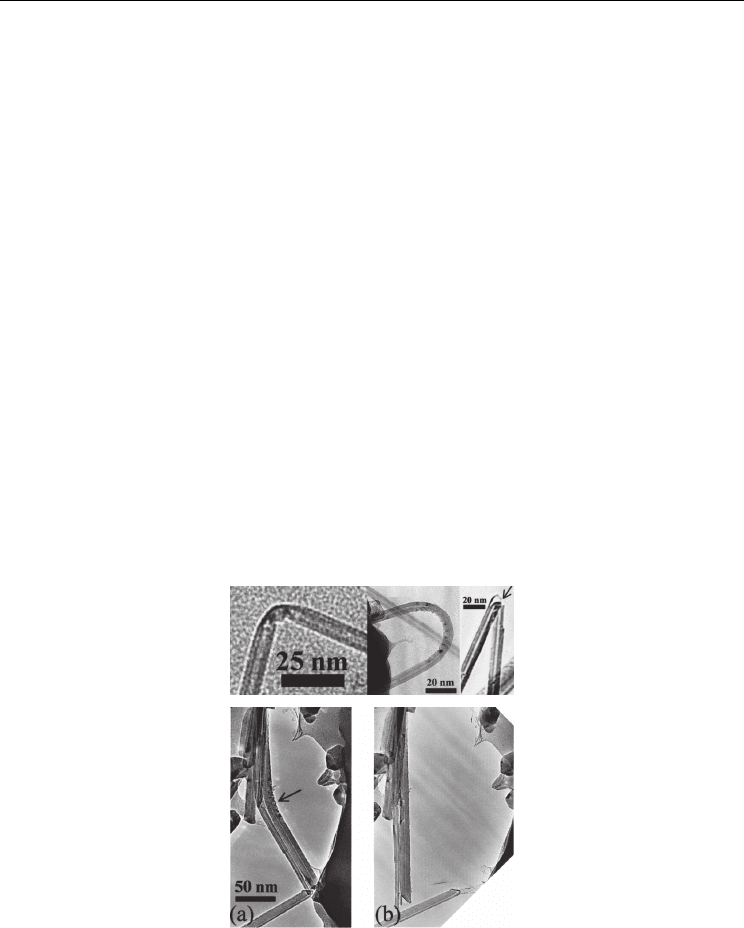
(Treacy et al., 1996). Bower et al. (Bower et al., 1999) aligned MWNTs in the thermoplastic
polymer (polyhydroxyaminoether, DowChemical Co.) films by stretching above the glass
transition temperature and releasing the load at 300 K. The uniaxial alignment of MWNTs
was confirmed by x-ray diffraction. The CNTs in the polymer matrix are bent (Figure 4),
presumably because of the shrinkage of the polymer matrix as the composite is cooled from
100 °C to room temperature. The deformation was reversible at moderate bending, i.e. the
CNTs returned to their straight cylindrical shape by heating the polymer matrix. Fracture
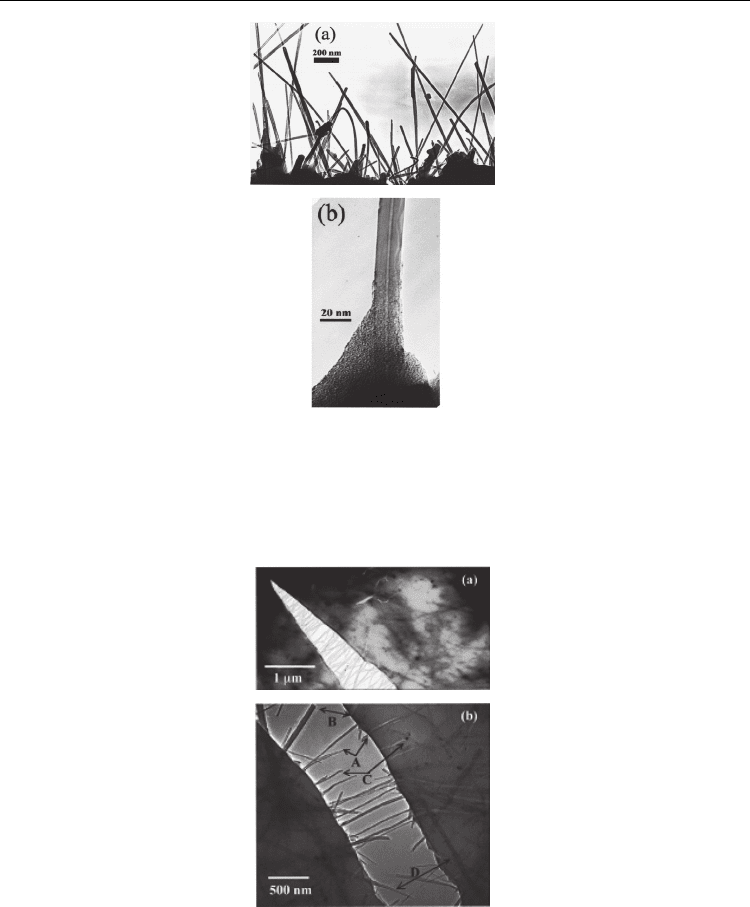
surfaces in PNC’s can be examined to ascertain the strength of the adhesion between the
polymer and the nanotube. Figure 5 shows MWNT protruding from polymer matrix
attached with a layer of polymer. All these observations point to the effective interactions
and intimate contact between CNTs and polymer matrix. In a final example, Figure 6 shows
the use of TEM to observe the nucleation and propagation of a crack induced in thin
MWNT-PS film by thermal stresses in a TEM (Qian et al., 2000). The nucleation and
propagation occur in regions of low CNT density and along the weak CNT-polymer
interface. Also, the CNTs tend to align perpendicular to the crack and bridge the gap, and
some of them are already pulled out, suggesting that the critical failure force is determined
by interaction between polymer matrix and CNTs. These CNTs provide a closure force until
a critical value is reached to be pulled out of the matrix.
Fig. 4. Top panel: TEM images showing the buckling of in bent MWNTs in MWNT/polymer
composites. Bottom panel: (a) A bent nanotube before heating; (b) the bent nanotube
restored to its straight cylindrical shape after heating (Reprinted with permission from C.
Bower, R. Rosen, L. Jin, J. Han and O. Zhou, “Deformation of carbon nanotubes in nanotube-
polymer composites”, Applied Physics Letters, vol. 74, 3317-3319. Copyright 1999, American
Institute of Physics.).
Carbon Nanotubes – Polymer Nanocomposites
162
Fig. 5. TEM images of the fracture surface showing MWNT protruding from the polymer
matrix suggestive of strong adhesion between the MWNT and the polymer matrix
(Reprinted with permission from C. Bower, R. Rosen, L. Jin, J. Han and O. Zhou,
“Deformation of carbon nanotubes in nanotube-polymer composites”, Applied Physics
Letters, vol. 74, 3317-3319. Copyright 1999, American Institute of Physics.).
Fig. 6. Crack initiated by thermal stress. Upper panel shows the crack initiation and
propagation at low CNT density areas. Lower panel shows the CNTs aligned perpendicular
to the crack bridging the crack. Arrows labelled A, B, C and D point to CNTs that are broken
and pulled out of matrix (Reprinted with permission from D. Qian, E.C. Dickey, R. Andrews
and T. Rantell, “Load transfer and deformation mechanisms in carbon nanotube-
polystyrene composites”, Applied Physics Letters, vol. 76, 2868-2870. Copyright 2000,
American Institute of Physics.).
Characterization of Nanotube - Reinforced Polymer Composites
163
3.2 Raman spectroscopy
Infrared (IR) and Raman spectroscopy (RS) are the two vibrational spectroscopic techniques
widely used to obtain molecular structure information for the identification of polymers,
functional groups and stereochemical structures. Both techniques measure the vibrational
energies of molecules. However, for a vibrational motion to be IR active, the dipole moment
of the molecule must change, and for a transition to be Raman active there must be a change
in polarizability of the molecule. In most instances, IR and RS yield complementary
information because IR activity suggests RS inactivity and vice versa. Sample requirements
for RS are less stringent than for IR. Details of application of RS to CNTs have been
discussed thoroughly in the literature (Dresselhaus et al., 2005), and a few examples of the
use of RS to PNCs are provided here. For oriented specimen, the intensity of RS spectra line
depends on the orientation of molecules relative to the polarization of the incident beam as
well as scattering beam. This feature is used to determine the orientation distribution for
CNTs in polymer matrix. Polarized RS has also been used to probe the one -dimensional
nature of SWNT in the bulk materials (Gommans et al., 2000). These results show that the RS
intensity has the same orientation dependence as nanotube’s polarizability. A similar work
on MWNT has also shown that there is a strong dependence of the graphite-like G band and
the disorder-induced D band on the polarization geometry (Rao et al., 2000).
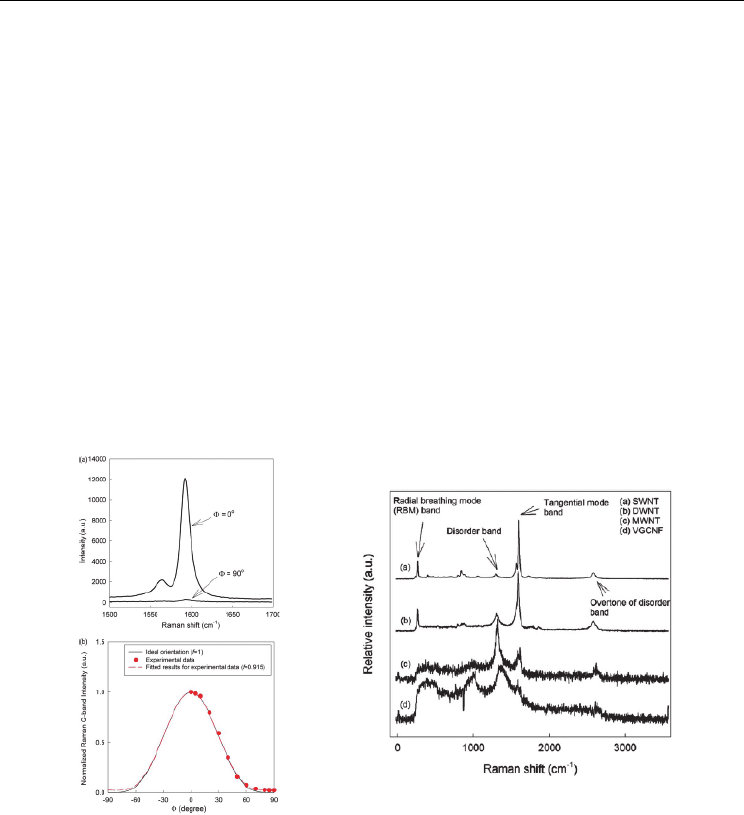
Fig. 7. Upper left panel: G-band Raman spectra for PAN/SWNT fiber. The ratio of the peak
intensity at 1592 cm
-1
are compared when the angles between polarizer and the fiber axis are
0 and 90°, respectively. Lower left panel: The normalized G-band Raman intensity as
function of angles between polarizer and fiber axis. Experimental data are for PAN/SWNT
(1 wt%) at draw ratio 51 (Reprinted from Polymer, Vol.47, H.G. Chae, M.L. Minus and S.
Kumar, “Oriented and exfoliated single wall carbon nanotubes in polyacrylonitrile”, 3494-
4504. Copyright 2006, with permission from Elsevier.) Right panel: Raman spectra for
pristine CNT powders (Reprinted from Polymer, Vol.46, H.G. Chae, T.V. Sreekumar, T.
Uchida and S. Kumar, “A comparison of reinforcement efficiency of various types of carbon
nanotubes in polyacrylonitrile fiber”, 10925-10935. Copyright 2005, with permission from
Elsevier.).

Carbon Nanotubes – Polymer Nanocomposites
164
Mathematical description of Raman intensity distribution as a function of SWNT’s
orientation has been derived using Legendre polynomials by Liu et al. (Liu & Kumar, 2003).
They built a relationship between 2
nd
and 4
th
orientation parameters of SWNT and Raman
scattering intensity and depolarization ratio. This quantitative relation was used by Chae et
al. to investigate the orientation of SWNT in polyacrylonitrile fibers (Chae et al., 2006). They
measured G-band intensity ratio at about 1592 cm
-1
for polarization parallel and
perpendicular to the fiber axis (Figure 7). By comparing the G-band ratio for conventional
spun and gel-spun PAN/SWNT fibers, they were able to conclude that the orientation of
SWNT is only slightly improved by the gel-spinning process. They also showed that RS
could be used to estimate the relative intensity of disorder band for SWNT, DWNT, MWNT,
VGCNF (Chae et al., 2005) (Figure 7). They concluded that SWNT has best perfection while
MWNT and VGCNF have more disorder (Chae et al., 2005).
3.3 X-ray scattering
X-ray scattering is an ideal tool to investigate the influence of CNTs on polymer
morphology at multiple length scales from nm to sub m length scales. This is achieved by
using variations of the basic diffraction/scattering technique that are usually referred to as
x-ray diffraction (XRD), wide-angle x-ray diffraction (WAXD), and small-angle x-ray
scattering (SAXS). The scattering or diffraction intensity is expressed as a function of the
scattering vector, q(=4πsinθ/λ) or s(=2sinθ/λ), 2θ being the scattering angle, and λ the x-ray
wavelength. The sample preparation is far simpler than that for TEM. Whereas electron
microscopy can provide information about the distribution of the CNTs and other structural
information within a particular frame of an image, SAXS can provide similar data about the
distribution, but averaged over lengths ~ mm in the bulk of the sample. Some of the
characteristics of the PNCs that can be measured using x-ray scattering include the
structural changes in the polymer due to the incorporation of the CNT, orientation of the
polymer chains/crystals and the CNTs, and structure at the interface between the polymer
and the CNT, and the changes in these features during deformation. The advent of
synchrotron radiation, whose brilliance is ~ 10 orders of magnitude higher than that from a
rotating anode tube, makes it possible to carry out in-situ dynamical measurements. Some
of the data in this section were obtained from CNTs dispersed in polyacrylonitrile (PAN)
that was then spun into a fiber. PAN fibers reinforced with CNTs are made by solution- or
gel-spinning. PAN/CNTs fibers with significant enhancement in properties suggested good
interactions between PAN and CNTs (Chae et al., 2006; Chae et al., 2005; Guo et al., 2005;
Sreekumar et al., 2004; Uchida et al., 2006). These studies showed that the improvement in
low strain is due to the interaction of PAN and CNTs, while the improvement as high strain
is partly due to the CNT length.
3.3.1 Characterization of the CNTs
Before discussing the results for the PNCs, we will first discuss some of the scattering data
relevant to the characterization for the CNTs. Historically, the MWNTs were observed by
electron microscopy and were depicted as concentric seamless cylinders (Iijima, 1991). This
model was used to interpret XRD data (Pasqualini, 1997), and further direct evidence
appeared later to support this concentric cylinder model (Xu et al., 2001). However, there
has been evidence that suggest that the local structure is similar to turbostratic graphite or
scrolls of graphite sheets (Dravid et al., 1993; Zhou et al., 1994). More recent data suggest
that while thin MWNTs could be modelled as concentric 7-15 tubules, thicker MWNTs were
Characterization of Nanotube - Reinforced Polymer Composites
165
found to be mixtures of both scroll-type MWNT and concentric-cylinder (nested Russian
doll) MWNTs (Maniwa et al., 2001).
An individual CNT cannot be characterized using SAXS. However, due to the π-π chemical
bonding and van de Waals interactions, the CNTs tend to aggregate into bundles while
lacking a clear-cut rod-like morphology (Schaefer et al., 2003a), and this typical morphology
can be characterized using SAXS. Schaefer et al. combined small-angle light scattering, ultra-
SAXS and SAXS to measure morphology and degree of dispersion of SWNTs and MWNTs
suspended in water (Schaefer, 2003a; Schaefer, 2003b). They found that the intensities over 5
decades of q are characterized by different power laws. The power-law of intensity from
SWNT indicates a branched rope network with fractal characteristics. Porod’s law was
observed at length scale smaller than inner radius, suggesting the smoothness of interface.
The nonuniform dispersion of CNTs in polymers partly explains why the reinforcement of
CNTs to polymer composites falls below expectations.
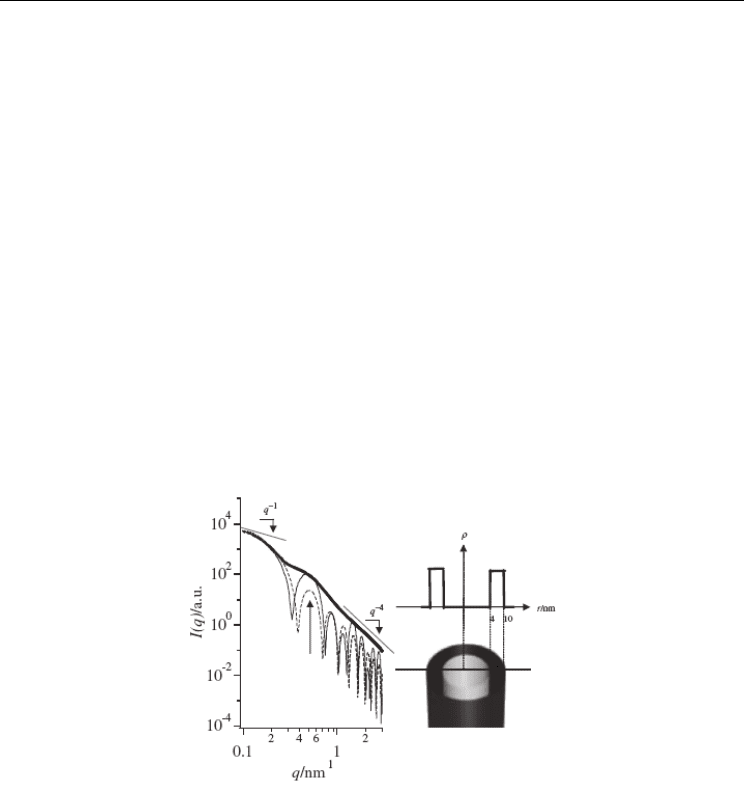
In another experiment (Inada et al., 2005), two segments of different power-law behavior
were observed in the intensity distribution (Figure 8). One segment conforms to Porod’s law
corresponding to smooth interfaces. The other follows a power-law with exponent -1,
suggesting scattering is from a rod-like structure. The scattering could be modeled as those
from MWNTs represented as hollow tubes with an inner diameter of about 8 nm and a wall
thickness of 6 nm, which is in agreement with the reported results from direct measurement
through TEM.
Fig. 8. Left: Measured SAXS intensity as function of scattering vector. Two power laws were
presented indicating a one-dimension cylinder structure and sharp interface, respectively.
Straight line and dotted line are calculated for a core-shell and hard cylinder models,
respectively. Right: The best fit parameter suggest the structure of CNT is a core-shell
structure (Reprinted from T. Inada et al., “Small-angle x-ray scattering from multi-wall
carbon nanotubes (CNTs) dispersed in polymeric matrix”, Chemistry Letters, Vol. 34, 525
(2005), with permission from The Chemical Society of Japan.)
3.3.2 SAXS characterization of the voids and the CNTs in the polymer
Voids are invariably formed in the fibers during the spinning and the drawing process,
especially in the presence of reinforcements. Voids, and in general any scattering entities,
give rise to SAXS that can be analyzed to obtain information about the length, diameter, and
Carbon Nanotubes – Polymer Nanocomposites
166
orientation of these entities as well the information about the nature of the interface. In the
work with PAN fibers, the degree of orientation of the voids measured by SAXS was found
to be same as those of the crystalline domains observed in WAXS. Both increased reversibly
upon stretching, indicating that the voids are integral parts of the polymer matrix and
closely associated with the crystalline domains in the fibrils (Wang et al., 2009). SAXS data
also showed large changes in the size distribution of the voids during elongation in the
solution spun PAN fibers, but not the composite fibers. Furthermore, heating the fiber above
the glass transition temperature (T
g
) decreased the volume fraction of the voids considerably
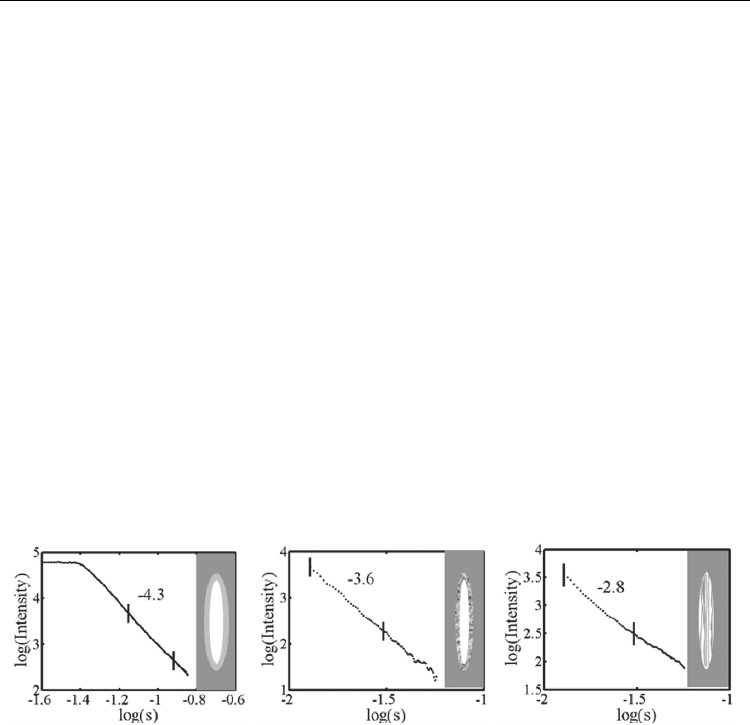
as indicated by a decrease in the scattered intensity. Figure 9 shows examples of the decay in
equatorial scattering with scattering angle. The rate of this decay, as indicated by the slope
of the log-log plot (called the exponent) provides valuable insight into the nature of the
void-polymer interface. In the plot of the PAN with MWNT, we see the exponent is 4.4
(Figure 9a). An exponent of 4.0 would indicate a sharp, smooth interface. A value higher
than 4 suggests that in the PAN/MWNT sample, there is a diffuse interface between the
polymer and the void as indicated schematically in the figure. An exponent between 3 and 4
would indicate a rough void-polymer interface, which was observed in gel-spun fibers
without any CNT’s (Figure 9b). An exponent between 2 and 3 indicates that the structure
within the void is similar to a mass-fractal. It is speculated that because of the nature of gel-
spinning process, the voids are partially filled with polymer, and perhaps CNT, and as a
result the scattering exponent falls below 3 as indicated in Figure 9c. It is possible that a
similar analysis can be carried out to probe the nanotube-polymer interface provided there
is a contrast between the CNTs and the matrix.
Fig. 9. Power law for equatorial intensities. (a) PAN/MWNT for a void with diffuse
boundary ; (b) gel-spun PAN for a void with surface fractal; (c) gel-spun PAN/SWNT for a
void with mass fractal The linear segments that are fitted to obtain the fractal dimension are
shown in the figure (Wang et al., 2009).
3.3.3 WAXD analysis of the polymer and the CNTs
Figure 10 shows example of the 2D diffraction patterns and the corresponding 1D scans that
can be obtained from polymer composites with CNTs. Because of the large fraction of the
polymer ( 95%) the major features in these scans are due to the polymer, and these features
can be used to follow the changes in the polymer structure in terms of the unit cell
dimensions, crystallinity, crystallite size and polymer orientation (Wang et al., 2008b). For
example, the data show that a monotonic decrease in PAN inter-chain spacing with the fiber
strain is accompanied by a reversible change from helix to zigzag conformation, and by
changes in the axial repeats of the two conformations. These changes are much larger in gel-
spun fibers than in solution-spun fibers, indicating more effective load transfer between the