Zhu J., Cook W.D. (Eds.) Modeling Data Irregularities and Structural Complexities in Data Envelopment Analysis
Подождите немного. Документ загружается.

4
Table 1-1. Supply Chain Operations Within a Week
Inputs Output
DMU Cost ($100) Response time (days) Profit ($1,000)
1 1 5 2
2 2 2 2
3 4 1 2
4 6 1 2
5 4 4 2
Source: Zhu (2003).
DMU1
DMU2
DMU3 DMU4
DMU5
0
1
2
3
4
5
6
01234567
Supply chain response time (days)
Total supply chain cost ($100)
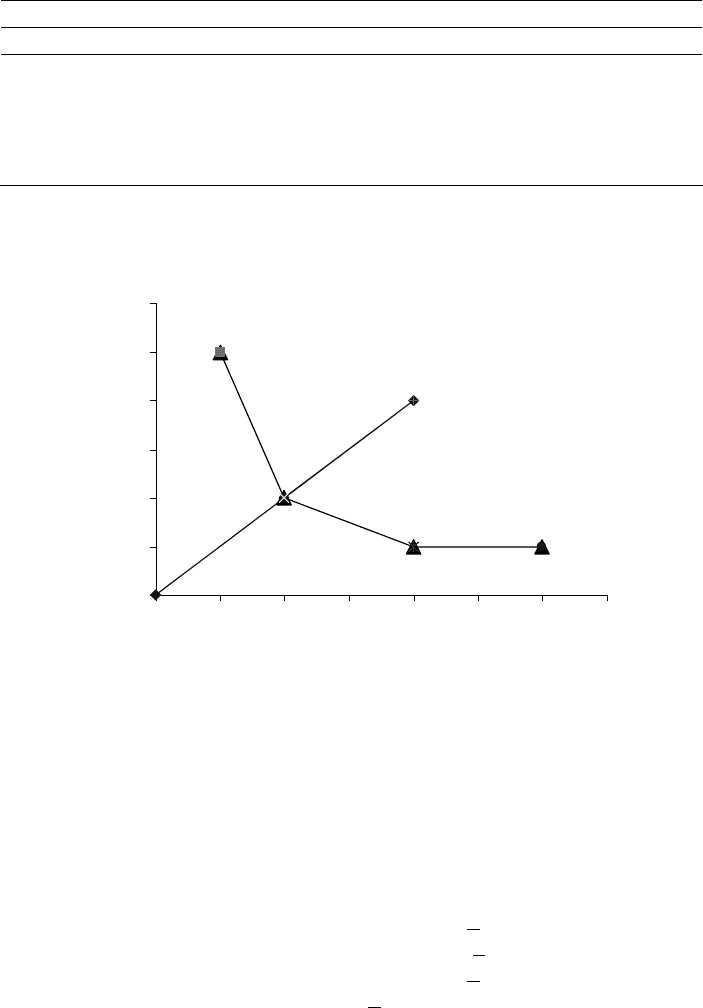
Figure 1-1. Five Supply Chain Operations
Figure 1-1 presents the five DMUs and the piecewise linear DEA
frontier. DMUs 1, 2, 3, and 4 are on the frontier--or the envelopment frontier.
If we apply model (3) to DMU5, we have,
Min
θ
Subject to
1
λ
1
+ 2
λ
2
+4
λ
3
+6
λ
4
+4
λ
5
< 4
θ
5
λ
1
+ 2
λ
2
+1
λ
3
+ 1
λ
4
+4
λ
5
< 4
θ
2
λ
1
+ 2
λ
2
+2
λ
3
+2
λ
4
+2
λ
5
> 2
λ
1
,
λ
2
,
λ
3
,
λ
4
,
λ
5
> 0
This model has the unique optimal solution of
*
θ
= 0.5,
*
2
λ
= 1, and
*
j
λ
= 0
(j ≠ 2), indicating that DMU5 needs to reduce its cost and response time to
Chapter 1

5
the amounts used by DMU2 if it is to be efficient This example indicates that
technical efficiency for DMU5 is achieved at DMU2.
Now, if we apply model (3) to DMU4, we obtain
*
θ
= 1,
*
4
λ
= 1, and
*
j
λ
= 0 (j ≠ 4), indicating that DMU4 is on the frontier. However, Figure 1-1
indicates that DMU4 can still reduce its response time by 2 days to achieve
coincidence with DMU3. This input reduction is usually called input slack.
The nonzero slack can be found by using the following model
i, j, r ss
srysy
mixsx
ss
rij
ror
n
j=
jrj
ioi
n
j
jij
s
r
r
m
i
i
∀≥
==−
==+
+
+−
+
−
=
=
+
=
−
∑
∑
∑∑
0 , ,
;,...,2,1
;,...,2,1
osubject t
max
1
*
1
11
λ
λ
θλ
(4)
where
*
θ
is determined by model (3) and is fixed in model (4).
For DMU4 with
*
θ
= 1, model (4) yields the following model,
Max
−
1
s +
−
2
s +
+
1
s
Subject to
1
λ
1
+ 2
λ
2
+4
λ
3
+6
λ
4
+4
λ
5
+
−
1
s = 6
*
θ
= 6
5
λ
1
+ 2
λ
2
+1
λ
3
+ 1
λ
4
+4
λ
5
+
−
2
s = 1
*
θ
= 1
2
λ
1
+ 2
λ
2
+2
λ
3
+2
λ
4
+2
λ
5
-
+
1
s = 2
λ
1
,
λ
2
,
λ
3
,
λ
4
,
λ
5
,
−
1
s ,
−
2
s ,
+
1
s > 0
The optimal slacks are
*
1
−
s = 2,
*
2
−
s =
*
1
+
s = 0, with
*
3
λ
= 1 and all other
*
j
λ
=
0.
We now have
Definition 1 (DEA Efficiency): The performance of
o
DMU is fully (100%)
efficient if and only if both (i)
*
θ
= 1 and (ii) all slacks
*−
i
s
=
*+
r
s
= 0.
Definition 2 (Weakly DEA Efficient): The performance of
o
DMU is
weakly efficient if and only if both (i)
*
θ
= 1 and (ii)
*−
i
s
≠
0 and/or
*+
r
s
≠
0
for some
i and r in some alternate optima.
Cook & Zhu, Data Irregularities and Structural Complexities in DEA
6
Model (4) is usually called the second stage calculation of an
envelopment model. In fact, the envelopment model can be written as:
i, j, r ss
srysy
mixsx
ss
rij
roi
n
j
jrj
ioi
n
j
jij
s
r
r
m
i
i
∀≥
==−
==+
+−
+−
+
=
−
=
=
+
=
−
∑
∑
∑∑
0 , ,
;,...,2,1
;,...,2,1
osubject t
)(min
1
1
11
λ
λ
θλ
εθ
(5)
where the
−
i
s and
+
r
s are slack variables used to convert the inequalities in
(3) to equivalent equations. This is equivalent to solving (5) in two stages by
first minimizing
θ
, then fixing
θ
=
*
θ
as in (4), where the slacks are to be
maximized without altering the previously determined value of
θ
=
*
θ
.
Formally, this is equivalent to granting “preemptive priority” to the
determination of
*
θ
in (3). In this manner, the fact that the non-
Archimedean element
ε
is defined to be smaller than any positive real
number is accommodated without having to specify the value of
ε
(Cooper,
Seiford and Zhu, 2004).
The above models are called input-oriented DEA models, as possible
input reductions are of interest while the outputs are kept at their current
levels. Similarly, output-oriented models can be developed. These models
focus on possible output increases while the inputs are kept at their current
levels. The interested reader should refer to Cooper, Seiford and Zhu (2004).
The models in Table 1-2 are also known as CRS (constant returns to
scale) models. If the constraint
∑
=
n
j
j
1
λ
= 1 is adjoined, they are referred to
as variable returns to scale (VRS) models (Banker, Charnes, Cooper, 1984).
This is due to the fact that
∑
=
n
j
j
1
λ
= 1 changes the shape of DEA frontier,
and is related to the concept of returns to scale.
Chapter 1

7
Table 1-2. CCR DEA Model
Input-oriented
Envelopment model Multiplier model
.,...,2,1 0
;,...,2,1
;,...,2,1
osubject t
)(min
1
1
11
nj
srysy
mixsx
ss
j
ror
n
j=
jrj
ioi
n
j
jij
s
r
r
m
i
i
=≥
==−
==+
+−
+
−
=
=
+
=
−
∑
∑
∑∑
λ
λ
θλ
εθ
0,
1
0
osubject t
max
1
11
1
>≥
=
≤−
=
∑
∑∑
∑
=
==
=
ενμ
ν
νμ
μ
ir
m
i
ioi
m
i
iji
s
r
rjr
s
r
ror
x
xy
yz
Output-oriented
Envelopment model Multiplier model
.,...,2,1 0
;,...,2,1
;,...,2,1
osubject t
)(max
1
1
11
nj
srysy
mixsx
ss
j
ror
n
j=
jrj
ioi
n
j
jij
s
r
r
m
i
i
=≥
==−
==+
++
+
−
=
=
+
=
−
∑
∑
∑∑
λ
φλ
λ
εφ
0,
1
0
osubject t
min
1
11
1
>≥
=
≥−
=
∑
∑∑
∑
=
==
=
ενμ
μ
μν
ν
ir
s
r
ror
s
r
rjr
m
i
iji
m
i
ioi
y
yx
xq
3. DATA AND STRUCTURE ISSUES
The current volume deals with data irregularities and structural
complexities in applications of DEA.
Chapter 2 (by Cook and Zhu) develops a general framework for
modeling and treating qualitative data in DEA and provides a unified
structure for embedding rank order data into the DEA framework. It is
shown that the existing approaches for dealing with qualitative data are
equivalent.
Cook & Zhu, Data Irregularities and Structural Complexities in DEA
8
Chapter 3 (by Chen and Zhu) discusses how to use the standard DEA
models to deal with imprecise data in DEA (IDEA), concentrating on
interval and ordinal data. There are two approaches in dealing with such
imprecise inputs and outputs. One uses scale transformations and variable
alternations to convert the non-linear IDEA model into a linear program,
while the other identifies a set of exact data from the imprecise inputs and
outputs and then uses the standard linear DEA model. The chapter focuses
on the latter IDEA approach that uses the standard DEA model. It is shown
that different results are obtained depending on whether the imprecise data
are introduced directly into the multiplier or envelopment DEA model; the
presence of imprecise data invalidates the linear duality between the
multiplier and envelopment DEA models. The approaches are illustrated
with both numerical and real world data sets.
Chapter 4 (by Pastor and Ruiz) presents an overview of the different
existing approaches dealing with the treatment of negative data in DEA.
Both the classical approaches and the most recent contributions to this
problem are presented. The focus is mainly on issues such as translation
invariance and units invariance of the variables, classification invariance of
the units, as well as efficiency measurement and target setting.
Chapter 5 (by Ruggiero) discusses existing approaches to measuring
performance when non-discretionary inputs affect the transformation of
discretionary inputs into outputs. The suitability of the approaches depends
on underlying assumptions about the relationship between non-discretionary
inputs and outputs. One model treats non-discretionary inputs like
discretionary inputs but uses a non-radial approach to project inefficient
decision making units (DMUs) to the frontier holding non-discretionary
inputs fixed. Other approaches use multiple stage models with regression to
control for the effect that non-discretionary inputs have on production.
Chapter 6 (by Hua and Bian) discusses the existing methods of treating
undesirable factors in DEA. Under strongly disposable technology and
weakly disposable technology, there are several approaches for treating
undesirable outputs in the DEA literature. One such approach is the
hyperbolic output efficiency measure that increases desirable outputs and
decreases undesirable outputs simultaneously. Based on the classification
invariance property, a linear monotone decreasing transformation is used to
treat the undesirable outputs. A directional distance function is used to
estimate the efficiency scores based on weak disposability of undesirable
outputs. This chapter also presents an extended DEA model in which
Chapter 1
9
undesirable outputs and non-discretionary inputs are considered
simultaneously.
Chapter 7 (by Piot-Lepetit and Le Moing) highlights the usefulness of the
directional distance function in measuring the impact of the EU Nitrate
directive, which prevents the free disposal of organic manure and nitrogen
surplus. Efficiency indices for the production and environmental
performance of farms at an individual level are proposed, together with an
evaluation of the impact caused by the said EU regulation. This chapter
extends the previous approach to good and bad outputs within the framework
of the directional distance function, by introducing a by-product (organic
manure), which becomes a pollutant once a certain level of disposability is
exceeded.
Chapter 8 (by Adler and Golany) presents the combined use of principal
component analysis (PCA) and DEA with the stated aim of reducing the
curse of dimensionality that occurs in DEA when there is an excessive
number of inputs and outputs in relation to the number of decision-making
units. Various PCA-DEA formulations are developed in the chapter utilizing
the results of principal component analyses to develop objective assurance
region type constraints on the DEA weights. The first set of models applies
PCA to grouped data representing similar themes, such as quality or
environmental measures. The second set of models, if needed, applies PCA
to all inputs and separately to all outputs, thus further strengthening the
discrimination power of DEA. A case study of municipal solid waste
managements in the Oulu district of Finland, which has been frequently
analyzed in the literature, will illustrate the different models and the power
of the PCA-DEA formulation.
Chapter 9 (by Dulá) deals with the extension of data envelopment
analysis to the general problem of mining oriented outliers. DEA is firmly
anchored in efficiency and productivity paradigms. This research claims new
application domains for DEA by releasing it from these moorings. The same
reasons why efficient entities are of interest in DEA apply to the geometric
equivalent in general point sets since they are based on the data’s magnitude
limits relative to the other data points. A framework for non-parametric
frontier analysis is derived from a new set of first principles.
Chapter 10 (by Adler, Raveh and Yazhemsky) presents the results of
DEA in a two-dimensional plot. Presenting DEA graphically, due to its
multiple variable nature, has proven difficult and some have argued that this
has left decision-makers at a loss in interpreting the results. Co-Plot, a
Cook & Zhu, Data Irregularities and Structural Complexities in DEA
10
variant of multi-dimensional scaling, locates each decision-making unit in a
two-dimensional space in which the location of each observation is
determined by all variables simultaneously. The graphical display technique
exhibits observations as points and variables (ratios) as arrows, relative to
the same center-of-gravity. Observations are mapped such that similar
decision-making units are closely located on the plot, signifying that they
belong to a group possessing comparable characteristics and behavior.
Chapter 11 (by Cook, Liang, Yang and Zhu) presents several DEA-based
approaches for characterizing and measuring supply chain efficiency. The
models are illustrated in a seller-buyer supply chain context, when the
relationship between the seller and buyer is treated leader-follower and
cooperative, respectively. In the leader-follower structure, the leader is first
evaluated, and then the follower is evaluated using information related to the
leader’s efficiency. In the cooperative structure, the joint efficiency which is
modeled as the average of the seller’s and buyer’s efficiency scores is
maximized, and both supply chain members are evaluated simultaneously.
Chapter 12 (by Färe, Grosskopf and Whittaker) describes network DEA
models, where a network consists of sub-technologies. A DEA model
typically describes a technology to a level of abstraction necessary for the
analyst’s purpose, but leaves out a description of the sub-technologies that
make up the internal functions of the technology. These sub-technologies are
usually treated as a “black box”, i.e., there is no information about what
happens inside them. The specification of the sub-technologies enables the
explicit examination of input allocation and intermediate products that
together form the production process. The combination of sub-technologies
into networks provides a method of analyzing problems that the traditional
DEA models cannot address.
Chapter 13 (Morita and Zhu) presents a context-dependent DEA
methodology, which refers to a DEA approach where a set of DMUs is
evaluated against a particular evaluation context. Each evaluation context
represents an efficient frontier composed of DMUs in a specific performance
level. The context-dependent DEA measures the attractiveness and the
progress when DMUs exhibiting poorer and better performance are chosen
as the evaluation context, respectively. This chapter also presents a slack-
based context-dependent DEA approach. In DEA, nonzero input and output
slacks are very likely to be present, after the radial efficiency score
improvement. Slack-based context-dependent DEA allows us to fully
evaluate the inefficiency in a DMU’s performance.
Chapter 1
11
Chapter 14 (by Cook and Zhu) presents DEA models to accommodate
flexible measures. In standard DEA, it is assumed that the input versus
output status of each of the chosen analysis measures is known. In some
situations, however, certain measures can play either input or output roles.
Consider using the number of nurse trainees on staff in a study of hospital
efficiency. Such a factor clearly constitutes an output measure for a hospital,
but at the same time is an important component of the hospital’s total staff
complement, hence is an input. Both an individual DMU model and an
aggregate model are suggested as methodologies for deriving the most
appropriate designations for flexible measures.
Chapter 15 (by Lozano
and Villa) presents DEA models under situations
where one or more inputs and/or outputs are integer quantities. Commonly,
in these situations, the non-integer targets are rounded off. However,
rounding off may easily lead to an infeasible target (i.e. out of the Production
Possibility Set) or to a dominated operation point. In this chapter, a general
framework to handle integer inputs and outputs is presented and a number of
integer DEA models are reviewed.
Chapter 16 (by Sarkis) looks at some data requirements and
characteristics that may ease the execution of the DEA models and the
interpretation of DEA results.
REFERENCES
1. Banker, R., A. Charnes and W.W. Cooper, 1984, Some models for
estimating technical and scale inefficiencies in data envelopment
analysis,
Management Science 30, 1078-1092.
2. Charnes A., W.W. Cooper and E. Rhodes, 1978, Measuring the
efficiency of decision making units,
European Journal of Operational
Research
, 2(6), 428-444.
3. Cooper, W.W., L.M. Seiford and J. Zhu, 2004,
Handbook of Data
Envelopment Analysis
, Kluwer Academic Publishers, Boston.
4. Zhu, J. 2003,
Quantitative Models for Performance Evaluation and
Benchmarking: Data Envelopment Analysis with Spreadsheets and DEA
Excel Solver
, Kluwer Academic Publishers, Boston.
Cook & Zhu, Data Irregularities and Structural Complexities in DEA
Chapter 2
RANK ORDER DATA IN DEA
Wade D. Cook
1
and Joe Zhu
2
1
Schulich School of Business, York University, Toronto, Ontario, Canada,
M
3J 1P3,
wcook@shulich.yorku.ca
2
Department of Management, Worcester Polytechnic Institute, Worcester, MA 01609,
j
zhu@wpi.edu
Abstract: In data envelopment analysis (DEA), performance evaluation is generally
assumed to be based upon a set of quantitative data. In many real world
settings, however, it is essential to take into account the presence of qualitative
factors when evaluating the performance of decision making units (DMUs).
Very often rankings are provided from best to worst relative to particular
attributes. Such rank positions might better be presented in an ordinal, rather
than numerical sense. The chapter develops a general framework for modeling
and treating qualitative data in DEA, and provides a unified structure for
embedding rank order data into the DEA framework. We show that the
approach developed earlier in Cook et al (1993, 1996) is equivalent to the
IDEA methodology given in Chapter 3. It is shown that, like IDEA, the
approach given her for dealing with qualitative data lends itself to treatment by
conventional DEA methodology.
.
Key words: Data envelopment analysis (DEA), efficiency, qualitative, rank order data
1. INTRODUCTION
In the data envelopment analysis (DEA) model of Charnes, Cooper and
Rhodes (1978), each member of a set of n decision making units (DMUs) is
to be evaluated relative to its peers. This evaluation is generally assumed to
be based on a set of quantitative output and input factors. In many real world
settings, however, it is essential to take into account the presence of
qualitative factors when rendering a decision on the performance of a DMU.
Very often it is the case that for a factor such as management competence,
one can, at most, provide a ranking of the DMUs from best to worst relative
to this attribute. The capability of providing a more precise, quantitative
measure reflecting such a factor is often not feasible. In some situations such
factors can be legitimately “quantified,” but very often such quantification
may be superficially forced as a modeling convenience.
In situations such as that described, the “data” for certain influence
factors (inputs and outputs) might better be represented as rank positions in
an ordinal, rather than numerical sense. Refer again to the management
competence example. In certain circumstances, the information available
may only permit one to put each DMU into one of L categories or groups
(e.g. ‘high’, ‘medium’ and ‘low’ competence). In other cases, one may be
able to provide a complete rank ordering of the DMUs on such a factor.
Cook, Kress and Seiford (1993), (1996) first presented a modified DEA
structure, incorporating rank order data. The 1996 article applied this
structure to the problem of prioritizing a set of research and development
projects, where there were both inputs and outputs defined on a Likert scale.
An alternative to the Cook et al approach was provided in Cooper, Park and
Yu (1999) in the form of the imprecise DEA (IDEA) model. While various
forms of imprecise data were examined, one major component of that
research focused on ordinal (rank order) data. See Chapter 3 for a treatment
of the specifics of IDEA. These two approaches to the treatment of ordinal
data in DEA are further discussed and compared in Cook and Zhu(2006).
In the current chapter, we present a unified structure for embedding rank
order or Likert scale data into the DEA framework. This development is very
much related to the presentation in Cook and Zhu (2006).To provide a
practical setting for the methodology to be developed herein, Section 2
briefly discusses the R&D project selection problem as presented in more
detail in Cook et al (1996). Section 3 presents a continuous projection
model, based on the conventional radial model of Charnes et al (1978). In
Section 4 this approach is compared to the IDEA methodology of Cooper et
al (1999). We demonstrate that IDEA for Likert Scale data is in fact
equivalent to the earlier approach of Cook, Kress and Seiford (1996).
Section 5 develops a discrete projection methodology that guarantees
projection to points on the Likert Scale. Conclusions and further directions
are addressed in Section 6.
14
Chapter 2