AckermannTh. (ed) Wind Power in Power Systems
Подождите немного. Документ загружается.

//INTEGRAS/KCG/P AGIN ATION/ WILEY /WPS /FINALS_1 4-12- 04/0470855088_ 28_CHA27 .3D – 611 – [603–628/26]
17.12.2004 10:55PM
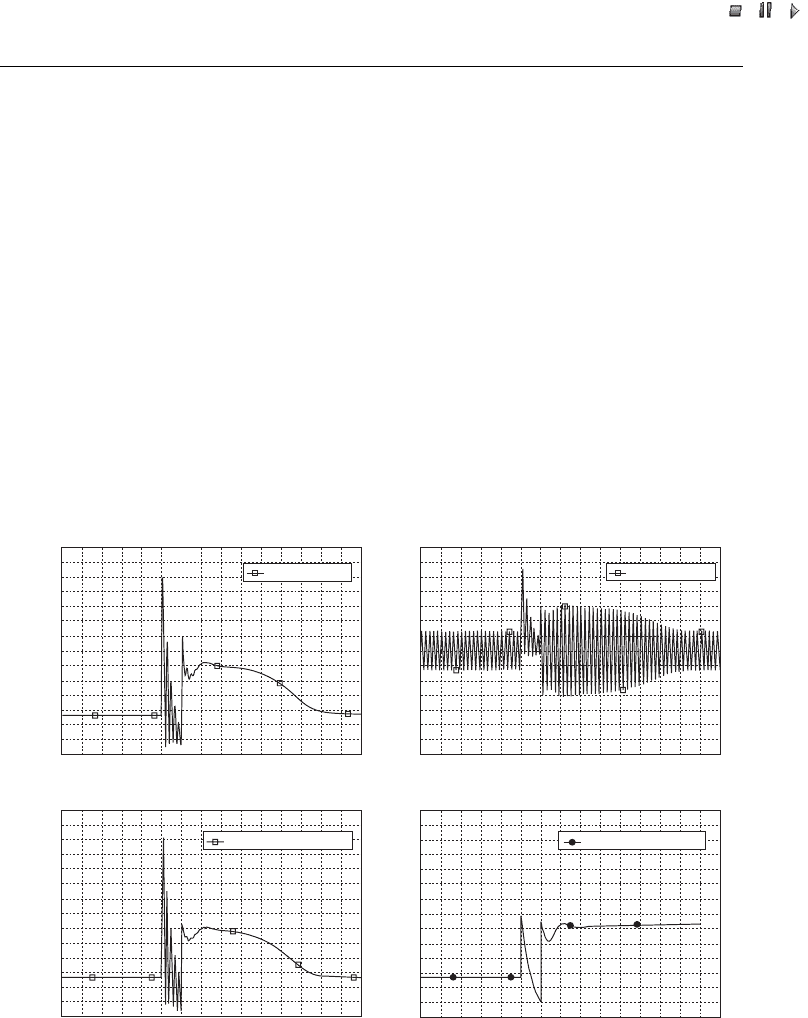
faulting time. There are no fundamental frequency transients. The insufficient repre-
sentation of the machine cu rrent with the common third-order model can be misleading
with respect to the prediction of the protective relay action during grid faults.
The transient fifth-order model of induction generators is a part of the dynamic model of
Type A wind turbines, which was implemented in the simulation tool PSS/E
TM
at NESA.
Until this implementation, the simulation tool PSS/E
TM
contained only the common third-
order model of induction generators, in this case the model CIMTR3. PTI is currently
working on a standardised higher-order model of induction generators to be implemented
in the tool PSS/E
TM
. This model also includes the representation of the fundamental
frequency transients in the machine current (Kazachkov, Feltes and Zavadil, 2003).
27.2.2 Shaft system model
Regarding the modelling of Type A wind turbines, it is common knowledge that this
type has a relatively soft coupling between the turbine rotor and the induction generator
rotor (Hinrichsen and Nolan, 1982). This is because the turbine rotor and the induction
Current (A)
(a)
0.6 0.7 0.8 0.9 1.0 1.1 1.2
Time (s)
1.3 1.4 1.5 1.6 1.7 1.8 1.90.5
13000
12000
11000
10000
9000
8000
7000
6000
5000
4000
3000
2000
1000
14000
0
2
Current (A)
(b)
0.6 0.7 0.8 0.9 1.0 1.1 1.2
Time (s)
1.3 1.4 1.5 1.6 1.7 1.8 1.90.5
1.2
1.0
0.8
0.6
0.4
0.2
0.0
–0.2
–0.4
–0.6
–0.8
–1.0
–1.2
1.4
× 10
4
–1.4
2
Current (A)
(c)
0.6 0.7 0.8 0.9 1.0 1.1 1.2
Time (s)
1.3 1.4 1.5 1.6 1.7 1.8 1.90.5
13000
12000
11000
10000
9000
8000
7000
6000
5000
4000
3000
2000
1000
14000
0
2
Current (A)
(d)
0.6 0.7 0.8 0.9 1.0 1.1 1.2
Time (s)
1.3 1.4 1.5 1.6 1.7 1.8 1.90.5
13000
12000
11000
10000
9000
8000
7000
6000
5000
4000
3000
2000
1000
14000
0
2
Matlab/Simulink
TM
Matlab/Simulink
TM
PSS/E
TM
fifth-order model
PSS/E
TM
fifth-order model
Figure 27.4 Simulated behaviour of the (peak phase) machine current: (a) the current phasor in
Matlab/Simulink
TM
, (b) the phase current in Matlab/Simulink
TM
, (c) the current phasor with the
fifth-order model in PSS/E
TM
, and (d) the current phasor with the third-order model in PSS/E
TM
.
Reprinted from Akhmatov, V. Analysis of Dynamic Behaviour of Electric Power Systems with
Large Amount of Wind Power, Ph.D. thesis, Technical University of Denmark, kgs. Lyngby,
Denmark, copyright 2003, with permission from the copyright holder
Wind Power in Power Systems 611

//INTEGRAS/KCG/P AGIN ATION/ WILEY /WPS /FINALS_1 4-12- 04/0470855088_ 28_CHA27 .3D – 612 – [603–628/26]
17.12.2004 10:55PM
generator rotor are connected through a shaft system with a relatively low stiffness.
When using a typical measure of shaft stiffness (i.e. p.u./el. rad) the shaft stiffness of
Type A wind turbines is between 30 and 100 times lower than the shaft stiffness of
conventional power plant units (Hinrichsen and Nolan, 1982). Therefore, the two-mass
model is used for the shaft systems of Type A wind turbines (Akhmatov, Knudsen and
Nielsen, 2000). The two masses represent the turbine rotor and the generator rotor,
respectively. Since its inception, the shaft representation in the two-mass model has been
the most disputed part of the dynamic wind turbine model that is applied in the analysis
of short-term voltage stability (Raben et al., 2003).
Before that time, wind turbine shafts were assumed to be stiff, so that turbine inertia
and generator rotor inertia were ‘lumped together’ – the lumped-mass model. When the
shaft system is represented by the two-mass model and relatively low values of
shaft stiffness are applied, the wind turbine model predicts the following phenomena
(Akhmatov, Knudsen and Nielsen, 2000):
.
It predicts oscillations of the voltage, the machine current, the electric and the reactive
power and the speed of the wind turbine induction generators when subjected to a
transient fault: the natural frequency of such oscillations is that of the shaft torsional
mode and is in the range of a few hertz, depending on the shaft construction and data.
.
It predicts the slower re-establishment of voltage in the power grid after the grid fault
is cleared. The two-mass model predicts larger demands for dynamic reactive com-
pensation than does the lumped-mass model.
That more dynamic reactive compensation is predicted for the same amount of grid-
connected wind power appears to be an even more important issue than the risk of
voltage oscillations lasting a few seconds after a grid fault. The reason for this is that a
higher demand for dynamic reactive compensation makes the incorpo ration of wind
power generally more costly.
The validation of the shaft system representat ion is therefore very important. One of
the first experiments that indicated the soft coupling between the turbine rotor and the
generator rotor was the islanding experiment carried out at the Rejsby Hede wind farm
(Pedersen et al., 2000). The wind farm comprises 40 600 kW fixe d-speed wind turbines
equipped with induction generators. It is situated in Western Denmark, in the area of
the transmission system operator Eltra.
During the experiment, the wind farm and a part of the local distribution network
were disconnected from the transmission power network. This islanded operation
continued for less than 1 s before the wind turbine generators were tripped and the wind
turbines were stopped (Pedersen et al., 2000). The wind speed was about 10 m/s and the
induction generators were 80 % reactive compensated (Pedersen et al., 2000).
(4)
During
the experiment, the phase currents, the phase voltages and the electric frequency from a
section of the wind farm were measured. Later, the results of the islanding experiment at
(4)
This implies that 80 % of the reactive power absorption of the induction generators was covered by the
capacitor banks and the charging from the wind farm cable network, whereas 20 % was covered by the reactive
power absorption from the entire grid.
612 Full-scale Verification of Dynamic Wind Turbine Models

//INTEGRAS/KCG/P AGIN ATION/ WILEY /WPS /FINALS_1 4-12- 04/0470855088_ 28_CHA27 .3D – 613 – [603–628/26]
17.12.2004 10:55PM
the Rejsby Hede wind farm were used for the partial validation of the dynamic model of
fixed-speed wind turbines (Pedersen et al., 2003).
During islanded operation, the electric frequency showed an oscillating behaviour
(Pedersen et al., 2003; see also Figure 27.5). The natural frequency of these oscillations is
1.7 Hz and corresponds to the shaft torsional mode (Akhma tov et al., 2003).
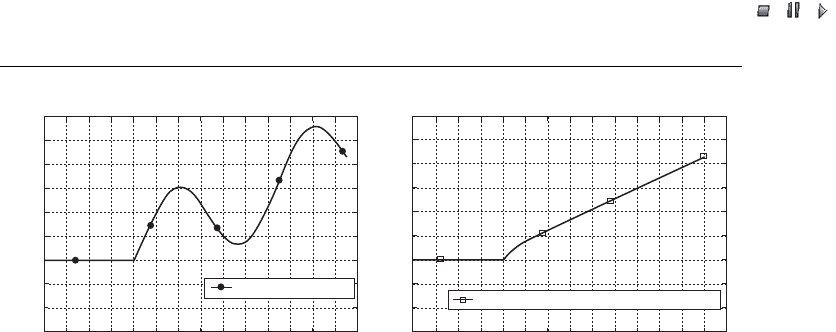
Figure 27.6 shows the behaviour of the electric frequency that was simulated under
similar conditions to those during the islanding experiment. The two-mass model and
the lumped-mass model, respectively, were used to simulate the behaviour.
The figures show that the measured behaviour and the behaviour simulated with the
two-mass model are in agreement. The behaviour predicted with the lumped-mass
model does not contain any oscillations but follows the average line sketched on the
measured frequency curve in Figure 27.5. The lumped-mass model gives an oversimpli-
fied representation of the wind turbine shaft system.
The measurements of the machine current during this experiment cannot be used to
validate the transient fifth-order model of induction generators. The reason is that the
disconnection of the wind farm is an unbalanced transient event. As explained in Section
27.2.1, the fundamental frequency transients in the machine current are eliminated
during unbalanced events. The validation described in Pedersen et al. (2003) uses the
common third-order model of induction generators for the validation.
The way in which the parameters of the two-mass model can be evaluated by using
measurements of the oscillating behaviour of the electric frequency has been described
elsewhere (Akhmatov et al., 2003). This approach can be useful if the data of the shaft
system model are unknown.
27.2.3 Aerodynamic rotor model
The aerodynam ic model of the wind turbine rotor introduces a feedback between
mechanical power and ro tational speed (Akhmatov, Knudsen and Nielsen 2000). In
56
54
52
50
48
Time (s)
Measured frequency
Average Line
Frequency (Hz)
0 0.2 0.4 0.6 0.8 1.0 1.2 1.4
Figure 27.5 Measured electric frequency reproduced Reprinted from the International Journal of
Electrical Power and Energy Systems, volume 22, issue 6, V. Akhmatov, H. Knudsen and
A. H. Nielsen, ‘Advanced Simulation of Windmills in the Electrical Power Supply’, pp. 421–431
copyright 2000, with permission from Elsevier
Wind Power in Power Systems 613
//INTEGRAS/KCG/P AGIN ATION/ WILEY /WPS /FINALS_1 4-12- 04/0470855088_ 28_CHA27 .3D – 614 – [603–628/26]
17.12.2004 10:55PM
addition, the aerodynamic rotor model is required to represent the mechanical power
control with blade-angle control (pitch or active-stall). The aerodynamic rotor model
has to be accurate if the blade-angle control is to be applied to improve short-term
voltage stability (Akhmatov, 2001). The use of blade-angle control for stabilising the
operation of large wind farms is discussed in Chapter 29, for instance.
The wind turbine rotor can be modelled in several ways, depending on the purpose of
the analysis. If short-term voltage stability is to be analysed, the wind turbine rotor is
commonly represented by using c
P
curves. The c
P
curves are often precalcu-
lated and provided by the wind turbine manufacturer. However, it may be necessary to
have more detailed aerodynamic representations in order to achieve a better accuracy. In
the following, aerodynamic rotor models of different complexity will be validated:
.
The wind turbin e is modelled with the use of its c
P
curves (see Chapter 24).
.
A model with unsteady inflow phenomena is applied (Øye, 1986).
.
The reduced aeroelastic code (AEC) is applied. The AEC is reduced because only
oscillations of the wind turbine blades are included, and the tower and the foundation
are considered to be stiff (Akhmatov, 2003b).
My colleagues and I implemented the aerodynamic rotor models of different complexity
as user-written models into the simulation tool PSS/E
TM
at NESA (Akhmatov, 2003b).
The aerodynamic rotor models were validated against the measurements in Snel and
Schepers (1995). These measurements came from a 2 MW fixed-speed, pitch-controlled
wind turbine equipped with an induction generator. The rotor diameter was 61 m. The
study also included the complete dataset of the wind turbine. In the experiment, the
wind turbine was subjected to the ‘step ’ of the pitch angle. This ‘pitch step’ was achieved
by a sudden change of the pitch reference. The pitch angle was then adjusted by the pitch
servo with a servo time constant of 0.25 s and a pitch rate limit of 7.2
per second.
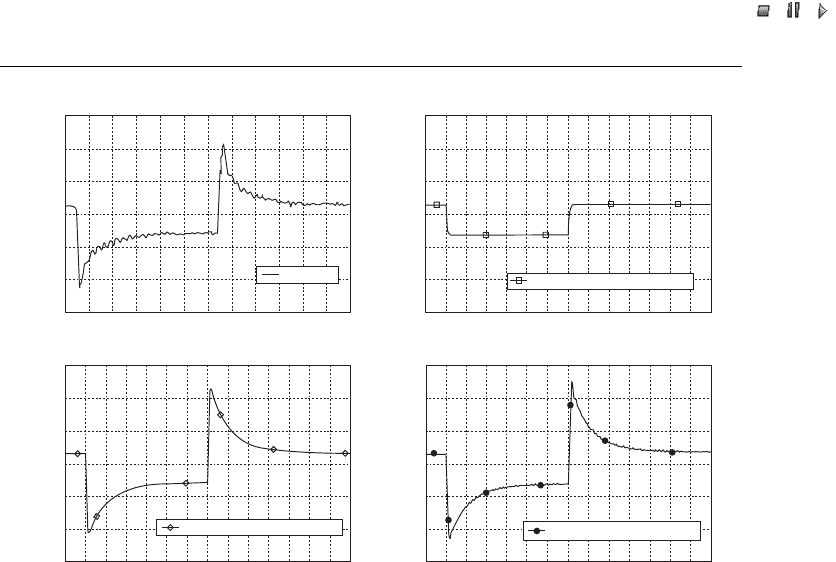
Figure 27.7(a) shows the measured curve of the wind turbine’s mechanical torque during
the selected study case. The selected study case corresponds to the operational point at
a wind speed of 8.7 m/s and an initial pitch angle of 0
. At the time t ¼1 s, the pitch
Frequency (Hz)
56
55
54
53
52
51
50
49
48
47
0.6 0.7 0.8 0.9 1.0 1.1 1.2 1.3 1.40.40.30.20.1 0.50
Time (s)
(a)
Simulated frequency
Frequency (Hz)
56
55
54
53
52
51
50
49
48
47
0.6 0.7 0.8 0.9 1.0 1.1 1.2 1.3 1.40.40.30.20.1 0.50
Time (s)
(b)
Simulated frequency, lumped-mass model
Figure 27.6 Simulated electric frequency: (a) two-mass model and (b) lumped-mass model Part
(a) reproduced Reprinted from the International Journal of Electrical Power and Energy Systems,
volume 22, issue 6, V. Akhmatov, H. Knudsen and A. H. Nielsen, ‘Advanced Simu lation of Wind-
mills in the Electrical Power Supply’, pp. 421–434 copyright 2000, with permission from Elsevier
614 Full-scale Verification of Dynamic Wind Turbine Models

//INTEGRAS/KCG/P AGIN ATION/ WILEY /WPS /FINALS_1 4-12- 04/0470855088_ 28_CHA27 .3D – 615 – [603–628/26]
17.12.2004 10:55PM
reference was set to þ3.7
, and at the time t ¼30 s, the pitch reference was reset to 0
.Itcan
be seen that the measured torque shows noticeable overshoots during the pitching.
Figures 27.7(b )–27.7(d) give the simulated curves of the wind turbine’s mechanical
torque. The following observations can be made:
.
The model that uses c
P
curves does not produce any overshoot during pitching.
The reason is that this model describes the wind turbine rotor in equilibrium, whereas
overshoot corresponds to the transition between the two states of equilibrium. When
applying c
P
curves, the transition process is neglected and the wind turbine
passes immediately from one state of equilibrium to another. Consequently, the
c
P
curves give stationary operational points of the wind turbi ne.
.
The model with unsteady inflow phenomena produces a sufficiently accurate represen-
tation of the behaviour of the mechanical torque, including overshoots during pitching.
In terms of the engineering model suggested by Øye (1986), such overshoots are
explained by lags in the induced velocities around the wind turbine blades. The
characteristic time constant of such lags,
v
,isintheorderof2R/V,whereR is blade
length and V is the incoming wind velocity. According to Øye (1986), such lags describe
unsteady inflow phenomena occurring around the wind turbine – the transition process.
This model is often called the Øye model and it is applied in this computation.
.
Finally, the reduced AEC predicts overshooting and also oscillations in the mechan-
ical torque. These oscillations are caused by oscillations of the wind turbine blades
due to the pitching. The AEC takes into account the effect of the blades moving in the
same direction as the incoming wind or in the direction opposite to the relative wind
velocity acting on the blades. This and other phenomena, which are not described
here, produce the feedback between the blade oscillations and the mechanical torque.
The behaviour that was simulated with the model with unsteady inflow phenomena and
with the reduced AEC both agree with the measurements. This also indicates a suffi-
ciently accurate implementation of these models into the dynamic simulation tool.
The aerodynamic rotor model that uses c
P
curves predicts accurately the
stationary operational points of the wind turbine rotor. However, this model does not
seem to provide an entirely accurate representation of the transition between stationary
operational points during pitching. The dynamic wind turbine model will be applied to
analyse transient voltage stability rather than for aerodynamic simulations, though. In a
number of other situations, it may nevertheless be acceptable to use reasonable simpli-
fications to represent the aerodynamics of the rotor.
The model with unsteady inflow phenomena does not require more data than the
model that uses c
P
curves. However, the model with unsteady inflow phenomena
is more complex and requires more computational resources than does the model that
uses (precalculated) c
P
curves. The reduced AEC requires both more data and
significantly more computational resources than do the other two models.
The reduced AEC model is the most accurate among the aerodynamic rotor models
that we have compared. The discrepancies between this model and the model with
unsteady inflow phenomena are only marginal when studying transient voltage stability.
Therefore, we do not include the reduced AEC into the final discussion below on how
detailed the representation of the aerodynamic rotor model has to be for the analysis of
short-term voltage stability.
Wind Power in Power Systems 615
//INTEGRAS/KCG/P AGIN ATION/ WILEY /WPS /FINALS_1 4-12- 04/0470855088_ 28_CHA27 .3D – 616 – [603–628/26]
17.12.2004 10:55PM
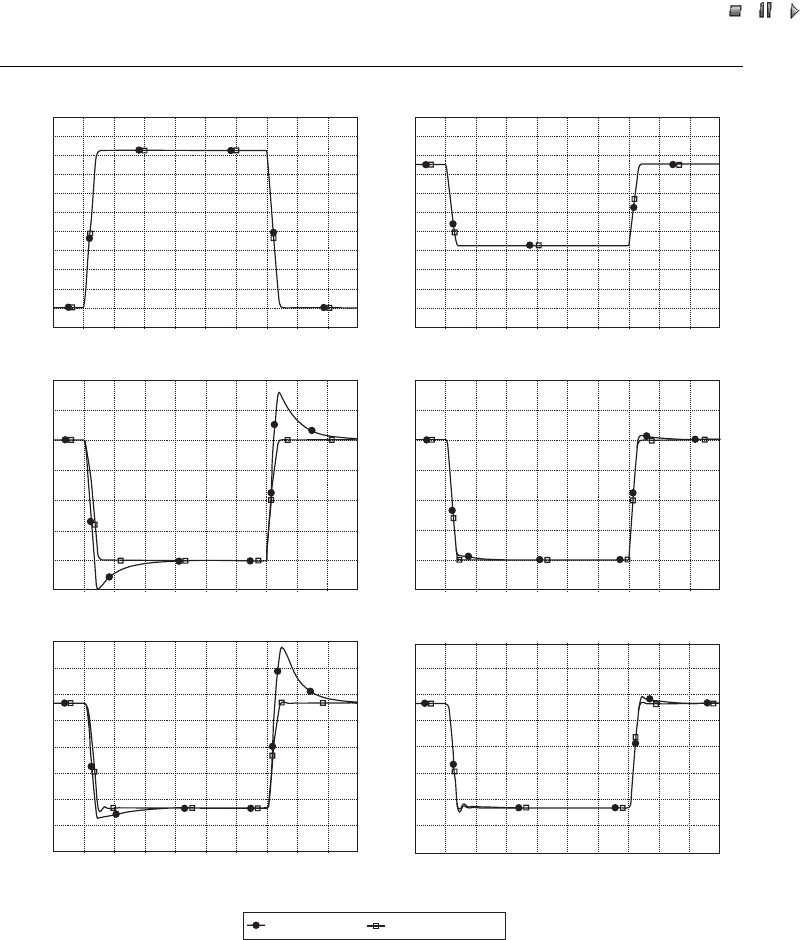
It is also possible to apply the power ramp (reduction of wind farm power output of up to
20 % of the rated power in less than 2 s) in order to stabilise a large wind farm during grid
faults (Eltra, 2000). The power ramp can be carried out using either pitch or active-stall
control modes. Before the power ramp is set to 20 % o f the rated power, the wind turbine is
at rated operation. Figure 27.8 shows the simulation results for both control modes.
Also, this can be used to validate the wind turbine model that uses c
P
curves. In
this case, the model is validated against simulations that use the already validated aero-
dynamic rotor model – the model with unsteady inflow phenomena. In pitch control mode
there is a noticeable discrepancy due to overshoots in the mechanical torque predicted by
the model with unsteady inflow phenomena. In the pitch control mode, the blades are
pitched away from the incoming wind, which leads to a relatively significant change of wind
profile around the turbine rotor. Consequently, the unsteady inflow phenomena become
significant. The presence of overshoots in the mechanical torque of the wind turbine rotor
during pitching has been confirmed by measurements (Øye, 1986; Snel and Shepers, 1995).
In active-stall control mode, overshoots in the mechanical torque are almost eliminated.
The reason is that the blades are pitched across the incoming wind and the wind profile
(a)
(c) (d)
(b)
350
300
250
200
150
135
Time (s)
257
Mechanical torque (kNm)
365
215
400
100
10 15 20 25 30 35 40 45 50 55 6005
350
300
250
200
150
Time (s)
257
Mechanical torque (kNm)
215
400
100
10 15 20 25 30 35 40 45 50 55 60 65 7005
145
Time (s)
257
Mechanical torque (kNm)
215
365
350
300
250
200
150
400
100
10 15 20 25 30 35 40 45 50 55 60 65 7005
135
Time (s)
257
Mechanical torque (kNm)
215
375
350
300
250
200
150
400
100
10 15 20 25 30 35 40 45 50 55 60 65 7005
Measured
Computed with c
P
–λ–β Curves
Computed with reduced AEC
Computed with the ∅ye model
Figure 27.7 Wind turbine torque during pitching: (a) measured, (b) computed with use of
c
P
curves, (c) computed with use of the Oye (1986) model with unsteady inflow phenomena,
and (d) computed with the reduced aeroelastic code (AEC). Part (a) reproduced from H. Snel and
J. G. Schepers (Eds), 1995, ‘Joint Investigation of Dynamic Inflow Effects and Implementation of
an Engineering Method’, by permission of the Netherlands Energy Research Foundation ECN.
Part (d) reproduced from V. Akhmatov, 2003, ‘On Mechanical Excitation of Electricity-producing
Wind Turbines at Grid Faults’, Wind Engineering, volume 27, issue 4, pp. 257–272, by permission
of Multi-Science Publishing Co. Ltd
616 Full-scale Verification of Dynamic Wind Turbine Models
//INTEGRAS/KCG/P AGIN ATION/ WILEY /WPS /FINALS_1 4-12- 04/0470855088_ 28_CHA27 .3D – 617 – [603–628/26]
17.12.2004 10:55PM
(a) (b)
20
18
16
14
12
10
8
6
4
2
0
–2
Time (s)
0
5
10
15
20
25
30 35
40
45
50
Pitch angle (degrees)
2
0
–2
–4
–6
–8
–10
–12
–14
–16
–18
–20
Pitch angle (degrees)
Time (s)
0
5
10
15
20
25
30 35
40
45
50
The ∅ye model
Use of c
P
–λ–β curves
(e) (f)
1.4
1.6
1.2
1.0
0.8
0.6
0.4
0.2
0
Time (s)
0
5
10
15
20
25
30 35
40
45
50
1.4
1.6
1.2
1.0
0.8
0.6
0.4
0.2
0
Time (s)
0 5 10 15 20 25 30 35 40 45 50
Machine current (p.u.)
Mechanical torque (p.u.)
(c)
(d)
1.2
1.4
1.0
0.8
0.6
0.4
0.2
0
Time (s)
0
5
10
15
20
25
30 35
40
45
50
1.4
1.2
1.0
0.8
0.6
0.4
0.2
0
Time (s)
0
5
10
15
20
25
30 35
40
45
50
Mechanical torque (p.u.)
Mechanical torque (p.u.)
Figure 27.8 Computed power ramp using blade-angle control: Comparison between the Øye model
(Øye, 1986) and the model that uses c
P
curves. Computed pitch angle for (a) pitch control and
(b) active stall. Computed mechanical torque for (c) pitch control and (d) active-stall. Computed
machine current for (e) pitch control and (f) active-stall. Reprinted from Akhmatov, V. Analysis of
Dynamic Behaviour of Electric Power Systems with Large Amount of Wind Power, Ph.D. thesis,
Technical University of Denmark, Kgs. Lyngby, Denmark, copyright 2003, with permission from
the copyright holder
Wind Power in Power Systems 617

//INTEGRAS/KCG/P AGIN ATION/ WILEY /WPS /FINALS_1 4-12- 04/0470855088_ 28_CHA27 .3D – 618 – [603–628/26]
17.12.2004 10:55PM
formed around the rotor does not change significantly. So far, the following can be stated
regarding the aerodynamic rotor modelling for the analysis of transient voltage stability:
.
Fixed-pitch and active-stall controlled wind turbines can always be modelled with the
use of their c
P
curves and c
P
curves, respectively, without reducing accu-
racy, because blade pitching does not produce any significant overshoots in the
mechanical torque in this case.
.
Pitch-controlled wind turbines should be modelled with use of the aerodynamic model
with unsteady inflow phenomena (i.e. the Øye model), because there are overshoots in
the mechanical torque during (relatively fast) pitching (for a detailed review of several
aerodynamic rotor models with unsteady inflow phenomena, see Snel and Schepers,
1995). The simplified model with the c
P
curves does not predict such overshoots.
.
The behaviour shown in Figure 27.8 is computed at the rated operation, that is, at a
wind speed of 15 m/s and for a wind turbine with a rotor diameter of 61 m. However,
the overshoo ts will be stronger for lower wind speeds and larger diameters of wind
turbine rotors (Akhmatov, 2003a). Current wind turbines have rotor diameters of
around 80–90 m and there is a tendency towards even larger diameters.
.
Pitch-controlled wind turbines can be represented by using c
P
curves in situa-
tions where the accuracy of the mechanical torque computation is not critical to the
results of the investigation.
.
During sufficiently slow pitching, the overshoots are eliminated and the wind turbine
model that uses c
P
curves can be applied in any case without losing accuracy.
I have demonstrated that this applies for pitch rates in the range of 2
per second or
below for the given wind turbine (Akhmatov, 2003a).
Why should overshoots in the mechanical torque during pitching be taken into
account? First, this indicates that the rate of the pitch control is restricted in order
to reduce overshoots in the torque applied to the low-speed shaft of the wind turbine.
Excessive overshoots may affect the gearbox of the shaft system. Second, the over-
shoot will transfer to the electrical and mechanical parameters of the wind turbine. In
the case of Type A wind turbines, overshoots in the mechanical torque lead to similar
behaviour in the generator current, the electric power and the reactive consumption
and may affect terminal voltage. It is important to be aware of this when applying
simplified models that use c
P
curves to represent pitch-controlled wind turbines.
Similarly, there are restrictions on the rate of active stall control. However, such
restrictions are caused by the stronger sensitivity of the mechanical torque to the blade
angle position. The simulated curves in Figure 27.8 illustrate this. When using pitch
control, the pitch angle has to be changed by 16.5
(positive) in order to reduce power
output to 20 % of the rated power. When using active stall control, the pitch angle is
changed by around 8
(negative) in order to reach the same power level.
27.2.4 Summary of partial validation
The parts of the dynamic model of Type A wind turbines have been validated; that is,
the model of induction generators, the shaft system model and the aerodynamic rotor
618 Full-scale Verification of Dynamic Wind Turbine Models

//INTEGRAS/KCG/P AGIN ATION/ WILEY /WPS /FINALS_1 4-12- 04/0470855088_ 28_CHA27 .3D – 619 – [603–628/26]
17.12.2004 10:55PM
model. The models representing the parts of the dyn amic model of fixed-speed wind
turbines are in agreement with the measurements and with the results of other validated
models. Thereby, the dynamic wind turbine model is also validated and can be con-
sidered sufficiently accurate for an analysis of transient voltage stability.
27.3 Full-scale Validation
Full-scale validation is necessary to ensure that the links betw een several component
models are also sufficiently accurate. We will use an example to illustrate the full-scale
validation of the dynamic wind turbine model. For this, we take measurements from a
tripping–reconnection experiment executed at the Danish wind farm at Nøjsomheds
Odde (Raben et al., 2003). The experiment was planned and carried out by the Danish
power distribution company SEAS in order to clarify details regarding the complexity of
the dynamic wind turbine model. The wind farm consists of 24 fixed-speed, active stall
controlled wind turbines equipped with induction generators (Raben et al., 2003). The
results of this work have practical implications:
.
The dynamic wind turbine model is applied in the analysis of the transient voltage
stability regarding the incorporation of a large amount of wind power into the East-
ern Danish power system (Akhmatov, Knudsen and Nielsen, 2000).
.
The wind turbines at the Nøjsomheds Odde wind farm are of the same wind turbine
concept and delivered from the same manufacturer, Bonus Energy, as for the Rød-
sand offshore wind farm (Raben et al., 2003), except they are 1 MW wind turbines.
The experiment was a cooperation between the consulting company Hansen-Henneberg
(Copenhagen, Denmark), which carried out the measurements; the manufacturer Bonus
Energy, which contributed its expertise regarding wind turbines and provided exact
data; and the power company NESA, which planned the experiment and did the
simulations and validation (Raben et al., 2003).
27.3.1 Experiment outline
The internal power network of the wind farm consists of four sections with six wind
turbines in each section (Raben et al., 2003). Through 0.7/10 kV transformers, the wind
turbines are connected to the internal power network of the wind farm. The wind farm is
connected to the local 50 kV distribution power system through a 10/50 kV transformer
and through a 50/132 kV transformer to the transmission power network. The short-
circuit capacity at the connection point of the transmission power network (132 kV
voltage level) is 350 MVA (Raben et al., 2003).
In the selected section, five wind turbine generators were temporarily disconnected
from the internal power netwo rk and stopped. The induction motors (IMs) of these five
disconnected wind turbine generators were still in operation for maintaining cooling of
the disconnected generators. The reason is that the experiment took a very limit ed time.
These five wind turbine generators were disconnected just before the experiment started
and were to be reconnected again after the experiment was finished (Raben et al., 2003).
Wind Power in Power Systems 619
//INTEGRAS/KCG/P AGIN ATION/ WILEY /WPS /FINALS_1 4-12- 04/0470855088_ 28_CHA27 .3D – 620 – [603–628/26]
17.12.2004 10:55PM
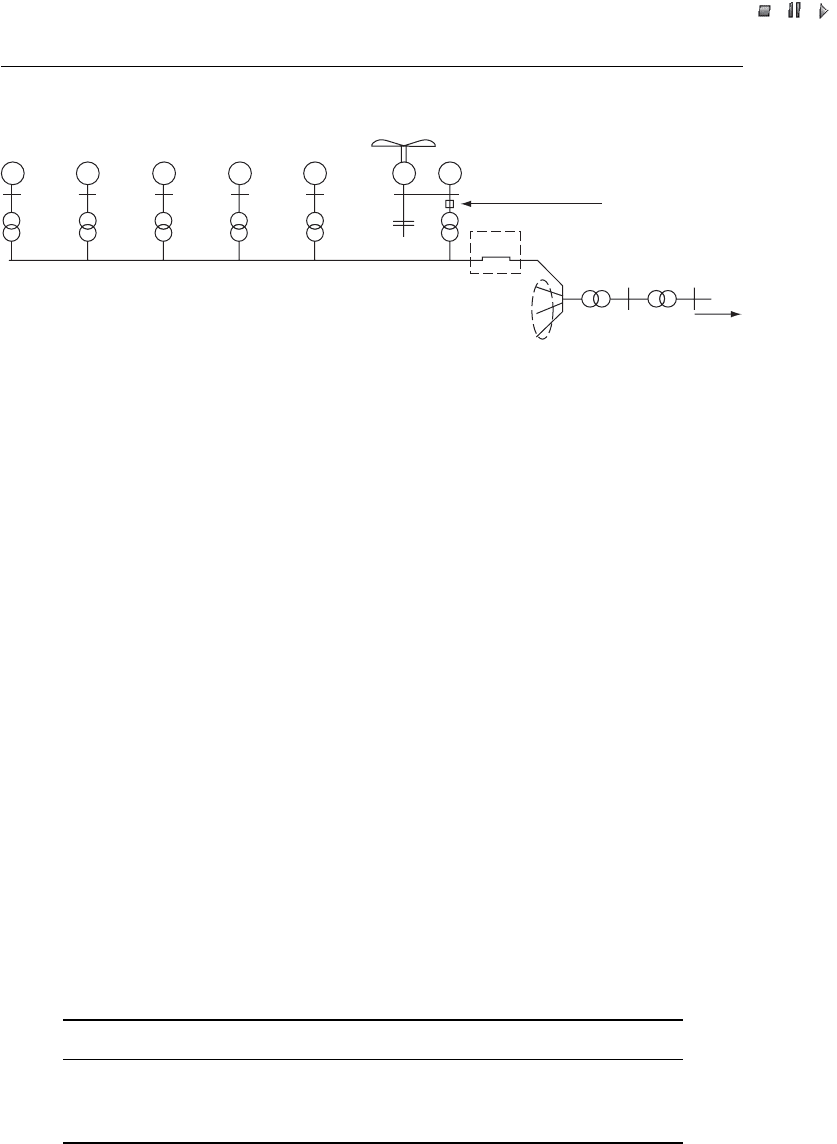
Figure 27.9 represents the selected section schematically, including the wind turbine WT 01
and the induction motors of the five disconnected wind turbine generators.
The tripping–reconnection experiment was carried out in moderate winds (Raben et al.,
2003). These conditions were chosen in order successfully to reconnect the wind turbine
generators and provide measurements for the validation. In high winds (i.e. close to 70–
80 % of rated power) the wind turbine was tripped shortly after the reconnection was
attempted. In this case, no measurements were available for the validation. Computations
showed that the machine current transients would be around 10 times the rated current if
reconnection were attempted at rated operation. Such excessive current transients should be
the reason of disconnection. Therefore, the experiments were carried out in moderate winds.
Table 27.2 includes the main data of the wind turbine that was studied. The wind
turbine operates with a 200 kW generator in moderate winds and shifts to a 1 MW
generator in high winds.
At the time of tripping, T
1
, switch SW 01 was opened and wind turbine WT 01 was in
islanded operation with the induction motors of section 1 and the internal power
network of this section given by the impedance of the transformers and the cable
charging. The islanded operation lasted about 500 ms (Akhmatov, 2003a).
Tripped wind turbines: WT 02, ...., WT 06
IM
Section 1
Opened at t = T
1
Cables to sections 2, 3 and 4
Closed at t = T
2
IM IM
IM
IM
WT 01
C
SW 01
Current and voltage
Measuring
10 kV/50 kV
50 kV/132 kV
S
K
= 350 MVA
IM
IG
Figure 27.9 Schematic representation of the selected section with grid-connected wind turbine
WT 01 during the experiment. Note:IM¼induction motor; IG ¼induction generator; WT ¼wind
turbine; SW ¼switch; t ¼time; S
k
¼short-circuit power Reproduced from N. Raben, M. H.
Donovan, E. Jørgensen, J. Thirsted and V. Akhmatov, 2003, ‘Grid Tripping and Re-connection:
Full-scale Experimental Validation of a Dynamic Wind Turbine Model’, Wind Engineering,
volume 27, issue 3, pp. 205–213, by permission of Multi-Science Publishing Co. Ltd
Table 27.2 Main wind turbine data.
Parameter Value Parameter Value
Rated Power 1 MW/200 kW Gear ratio 1:69
Synchronous rotor speed 22 rpm/15 rpm Rated voltage 690 V
Rotor Diameter 54.2 m Rated frequency 50 Hz
Source:Rabenet al., 2003. (Reproduced by permission of Multi-Science
Publishing Co. Ltd.)
620 Full-scale Verification of Dynamic Wind Turbine Models