Ahsan A. (ed.) Evaporation, Condensation and Heat transfer
Подождите немного. Документ загружается.

14
Metal Foam Effective Transport Properties
Jean-Michel Hugo
1,2
, Emmanuel Brun
3
and Frédéric Topin
1
1
IUSTI Laboratory CNRS UMR 6595, Université de Provence,
2
MOTA S.A. Cooling System, Z.I. les Paluds,
3
European Synchrotron Radiation Facility,
France
1. Introduction
Solid foams are a relatively new class of multifunctional materials that present attractive
thermal, mechanical, electrical and acoustic properties. Moreover, they also promote
mixing and have excellent specific mechanical properties. They are widely quoted to
present a random topology, high open porosity, low relative density and high thermal
conductivity of the cell edges, large accessible surface area per unit volume (Ashby et al.,
2000). Usually, geometric properties such as high tortuosity and high specific surface are
proposed to explain their properties, although fluid tortuosity is close to 1 and specific
surface is usually smaller than 10000m²/m
3
. They are nowadays proposed for their use in
numerous applications such as compact heat exchangers, reformers, biphasic cooling
systems and spreaders. They are also used in high-power batteries for lightweight
cordless electronics, and catalytic field application such as fuel cells systems (Catillon et
al., 2004; Dukhan et al., 2005; Mahjoob & Vafai, 2008; Tadrist et al., 2004). In this chapter,
we expose experimental and numerical tools to determine effective transport properties of
metal foam for mono-and-biphasic flow.
2. Representative volume element
Definitions of a continuous medium equivalent to the real porous structure, as well as the
definition of the applicability level of the macroscopic model, constitutes a tricky problem
that has long been debated (Auriault, 1991; Baveye & Sposito, 1984; Marle, 1982; Quintard &
Whitaker, 1991) among others. The forms of the used phenomenological laws have been
obtained from correlations resulting from experiments and not from physical laws. The
valuable expressions are much diversified and the choice for one or the other is only
justified when compared with specific experiments. We thus consider, classically, that the
foam could be assimilated to a homogeneous equivalent medium (Dullien, 1992). Thus, each
measured quantities will not describe the foam sample itself, but rather a homogeneous
media which has the same properties. There is yet no theoretical evidence to justify this
assumption. Thus, we only consider that this condition is satisfied when the considered
phenomenon occurs on a sufficient distance. Determination of a Rve is thus evaluation of
the relevant distance for the considered observation.

Evaporation, Condensation and Heat Transfer
280
2.1 Rve determination procedure
A definition of the Rve was proposed by (Drugan & Willis, 1996) : ‘‘It is the smallest
material volume element of the composite for which the usual spatially constant (overall
modulus) macroscopic constitutive representation is a sufficiently accurate model to
represent mean constitutive response’’. We propose to qualitatively identify Rve associated
to both geometrical and physical macroscopic properties using a pragmatic statistical
approach (Kanit et al., 2003).
The property considered is calculated for a large number of fixed-size boxes (n=100 to 1000)
randomly located in the sample. We obtain a distribution of mean values for a given size of
box. We then studied the influence of the box size on the standard deviation of these
distributions. The size of the Rve is defined as the volume for which the distribution of the
mean values present a standard deviation below a given threshold. We could also define the
size of the Rve as the volume for which the maximum difference is below a given threshold;
it would be a much robust criteria since Standard statistics could hide a Maximum
Difference (MD) far greater than standard deviation (Std Dev). In our case both quantities
vary similarly and thus Std. Dev threshold is sufficient.
For all studied quantities, the standard deviation decrease roughly exponentially with the
box size. For a Std Dev of 10 % we observe that maximum differences (MD) between two
realizations could exceed 25%. At 5% Std Dev, MD stay around 15%. This value is indeed
rather important but the available samples do not permit to be more precise.
To compare the different foams, the size of the box was normalized by the pore diameter.
Moreover the standard deviation and the maximum difference are normalized with the
mean value of the property studied for the considered foam.
2.2 Geometrical Rve
Porosity and specific surface are estimated from the 3D density images obtained with X-ray
tomography. Porosity is trivially obtained by counting the voxels of the different phase. The
"Marching Cubes" algorithm uses the 3D density images to obtain the mesh of solid surface
(Lorensen & Cline, 1987). The mesh data triangles are ordered so that each triangle is
included into a unique cubic mesh composing the 3D sample. Once the mesh has been
generated for the sample, it is then easy to calculate a specific surface area within a small
volume taken in the sample: the cubes composing the volume are retrieved and the surface
area of the triangles contained in these cubes is summed.
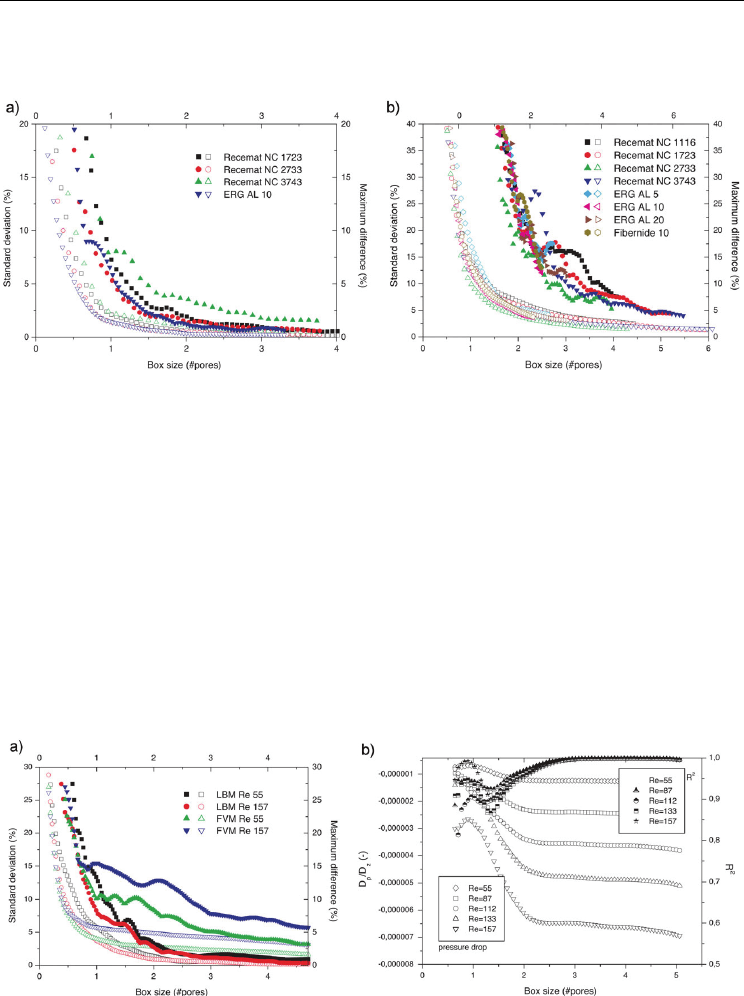
Figure 1 shows the influence of the box size on standard deviation and on the maximum
difference of both porosity (a) and specific surface (b) area distribution. For porosity we can
define a unique Rve for these samples. We observe similar standard deviation variations for
several manufacturers. According our 5% criteria the Rve of porosity is a cube of 0.7 pore
diameter side.
Similar behavior in standard deviation variation is observed for the Rve of specific surface.
A single size of Rve can be defined for all these samples: similar standard deviation
variations are also observed for the foams from different manufacturers. According to our
5% criteria, the Rve for specific surface is a cube roughly 3 dp in side length.
The absence of differences between foams from different manufacturer can be explained by
the fact that the manufacturing processes are roughly similar (replication of polymer foam)
and lead to the same solid volume fraction (porosity around 90 % is a manufacturer goal).
Plateau law gives globally struts shape but local variations in the cells organization induce
different shapes of struts inter-connection and strut cross section (roughly curved triangle).
Metal Foam Effective Transport Properties
281
These perturbations may be due to several effects (gravity, drainage, deposition, casting…)
during manufacturing process. This gives insight on the fact that specific surface Rve size is
far greater than porosity one, but further investigation needed to clarify this point.
Fig. 1. Geometrical REV determination. (a) porosity. (b) specific surface. Hollow symbol:
Std. dev.; Filled ones: max. difference.
2.3 Physical Rve
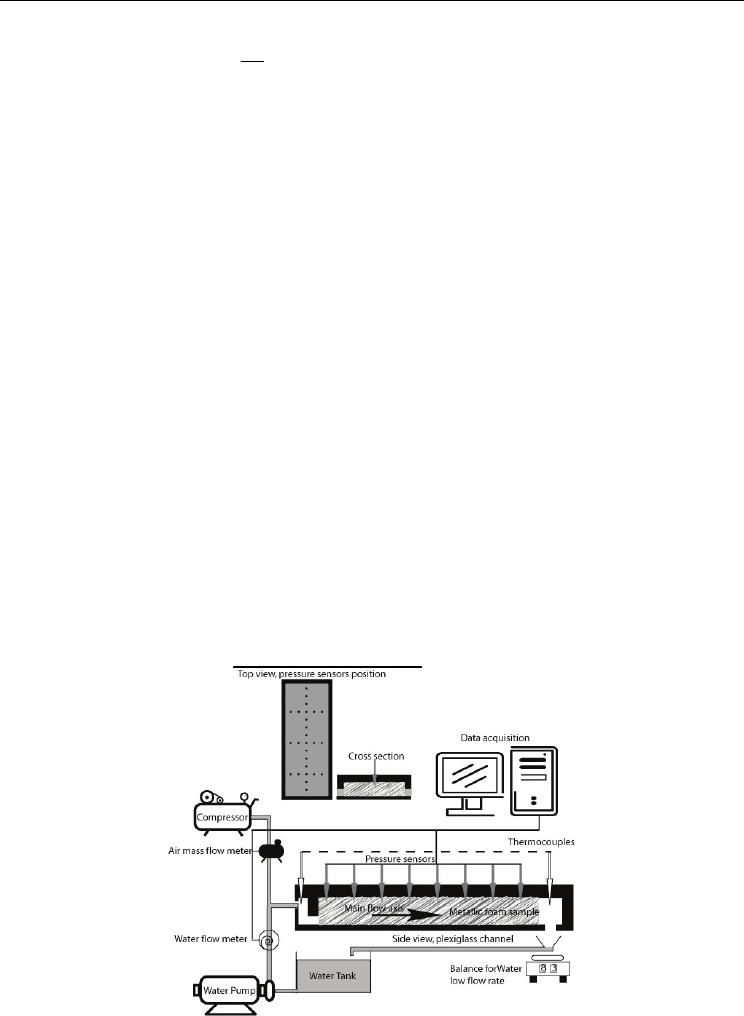
Concerning velocity, the method for obtaining Rve is the same as for geometrical properties.
But determining the local averaged pressure gradient from the pressure field is more
difficult (Barrere, 1990; Renard et al., 2001). Even if local pressure gradient are not fully
perpendicular to main flow direction (Figure 2), this effect is small and we consider that
macroscopic pressure is constant on planes perpendicular to the main flow direction
(established flow in an isotropic medium). Thus, we calculate mean pressure on planes
perpendicular to the main flow direction at several locations, and we estimate the slope of
the mean pressure variation by linear regression. We have chosen the coefficient of
determination R
2
of the linear regression as a pertinent parameter and we keep our 5%
criteria to establish the Rve size. We made these calculations for different sizes of a
randomly located box in the medium and we studied the influence of the box volume on the
coefficient of determination R
2
of the linear regression.
Fig. 2. Physical RVE determination. (a) velocity. Hollow symbols: standard deviation; Filled
one: Maximum error. (b) Hollow symbol: pressure gradient; filled ones: regression
coefficient. Calculations using either Finite Volume or Lattice Botzmann approach.

Evaporation, Condensation and Heat Transfer
282
Figure 2.a shows the influence of the box size on standard deviation and on the maximum
difference of mean velocity. To establish Rve for the mean velocity value, we used the
velocity field obtained from the computations (§3.3). No clear influence of the Reynolds
number on RVE size can be identified for both methods on the studied range. We observe
that for simulation, a box of 3 dp side seems to be sufficient to define the mean velocity for
these Reynolds numbers.
Figure 2.b presents the estimation of the pressure gradient by a linear regression and its
coefficient of determination R
2
, for different volumes and different Reynolds numbers.
The estimate of the pressure gradient is quite constant for a box 3 pore diameters in size and
the associated coefficient of regression R
2
is good (> 0.99). As a result, 3 pore diameters are
sufficient to establish pressure drop Rve.
3. Single-phase flow
3.1 Flow law
It is well known that flows at very low flow rates through a porous medium are governed
by Darcy’s law (Darcy, 1856).
dP μ
-=u
dz K
(1)
Where dP/dz is the pressure gradient along the main flow z-direction, µ the dynamic
viscosity, u is Darcy’s or the seepage velocity and K (m²) is the permeability (or Darcy’s
permeability) of the medium.
For homogeneous porous media, a nonlinear relationship between the pressure drop and
the flow rate characterize “high-velocity” flows. At high Reynolds number (strong inertia
regime), the empirical Forchheimer equation is used to account for the deviation from
Darcy’s law (incompressible fluid) (Eq.2) or extended to compressible fluid and expressed as
a function of mass flow rate (Eq.3).
2
dP(z) μ
-=u+βρu
dz K
⎛⎞
⎜⎟
⎝⎠
(2)
2
dρ(z)P(z) μ
-=η + βη
dz K
⎛⎞
⎜⎟
⎝⎠
(3)
Where
ρ (kg.m
-3
) is the fluid density, η (kg.m
-2
.s
-1
) the mass flow rate and β (m
−1
) the inertia
factor or the non-Darcy flow coefficient. In this formulation the Brinkman correction is
neglected. That means that the pressure drop is considered as the sum of two terms: viscous
(u, Darcy law) and inertia (u
2
) terms.
Several authors have shown that the onset of the non-linear behavior (that is sometime
called the weak inertia regime) may be described by a cubic law (Firdaous et al., 1997; Mei &
Auriault, 1993; Wodie & Levy, 1991):
2
3
dP μρ
-=u+ u
dz K μ
γ⋅
(4)
Metal Foam Effective Transport Properties
283
Where γ is a dimensionless parameter for the non-linear term. Comparing equations (4) and
(2) shows up that
()
γρ
β u= u
μ
could be described as a velocity dependant inertial
coefficient.
This expression is proposed to describe flow in porous media at intermediate Reynolds
number (typically 10<Re<10000). This equation was obtained by numerical simulations in a
two-dimensional periodic porous medium, and by using the homogenization technique for an
isotropic homogeneous 3D porous medium. In spite of the numerous attempts to clarify the
physical reasons for the non-linear behavior described above, neither Forchheimer equation (2)
nor the weak inertia equation (4) have received any physical justification (Fourar et al., 2004).
The pressure gradient across the foam is thus a function of system geometry (porosity, pore
and ligament size...), as well as physical properties of the fluid phase (viscosity, density).
On the other hand, for all three formulations of pressure gradient through the porous
media, K,
β and γ are intrinsic characteristic of the solid matrix alone and are, thus,
independent of the fluid nature.
3.2 Experimental set up
The experimental approach is based on stationary pressure profile measurement in a
channel filled with metallic foam of various grade or material and crossed by controlled
flow rates. Several foam samples with different characteristics (grade from 5 up to 100 PPI)
of copper, nickel, or allied nickel are studied. This experimental set-up is designed, to study
the impact of the solid matrix on flow phenomena in the foam in both single-phase and
adiabatic two-phase flow conditions. This apparatus consists of three main parts: test
section, fluid loop and data acquisition system as shown on Figure 3. Because of the
manufacturing methods, many types of foam are produced as flat sheets. Thus, the
thickness of samples, about 5 up to 10 pores here, may not be sufficient to insure validity of
the hypothesis that an equivalent homogeneous material could describe them. However, our
results show nothing that could invalidate this assumption and all available literature data
use this hypothesis. For tested cases, sample thickness along the main flow axis is not lower
than 2.5mm for the 100PPI (Dp=500µm) and 2.5cm for the 10 PPI samples (Dp=5000µm).
Fig. 3. Experimental set-up for single-phase and adiabatic two-phase flow laws
characterization (Bonnet et al., 2008).
Evaporation, Condensation and Heat Transfer
284
The test section (250 mm length, 50 mm wide and adjustable height) is instrumented with
12 pressure sensors (Sensym®, sensitivity 2.6 µV per Pa) placed every centimetre along
the main flow axis. Additional pressure sensors are placed along 3 lines perpendicular to
the flow direction to assess the one-dimensional nature of the flow. Foam samples (whose
lengths vary from 130 up to 200 mm) are placed in the central part of the channel in order
to keep a tranquilization zone upstream and downstream of the sample. Test section is
placed horizontally in order to avoid uncertainties due to hydrostatic effects (Madani et
al., 2007).
The liquid fluid loop is constituted by a storage tank (50 l capacity) and a variable velocity gear
pump which can give a constant flow rate in the range of 0–10
-4
m
3
s
-1
independently of pump
downstream conditions. Constant air flow (range 0-4 10
-3
Nm3 s
-1
) is obtained by using a
compressor and a pressure regulation valve. The test section is connected, downstream, to a
separator which is installed for the two-phase flow experiments. The liquid flows by gravity
down the storage tank while the air is simply released to atmosphere. A weighted tank could
be inserted in the liquid loop to assess the mass flow rate. Liquid flow rate is monitored
(upstream of the test section) using two turbine flow meters (Mac-Millan
®
) for optimal
accuracy over the full range of experiments. The first one works in the range of 3.33 10
-5
- 8.10
-5
m
3
s
-1
and the other one in the range 1.6 10
-6
- 3.33 10
-5
m
3
s
-1
. The weighting device arranged in
downstream of the test section has a sensitivity of about 1 g and a capacity of 3 l. Air flow is
monitored upstream of the test section using three mass- flow meters (Aalborg®) respective
operating range: 0-50, 0-100 and 0-250 Nl/min. An accuracy of about 0.1 % overall flow rate
range is thus obtained. Pressures, temperature and inlet flow rate of both fluid (air and water)
are continuously monitored.
The same experimental procedure is used for all tests. Before each series of measurement,
the foam sample was flooded a long time ensuring initial wetting (water) or drying (air),
and established flow. The fluid is then, maintained on circulation for about half an hour
after system has reached a stationary regime. Hydrodynamic (null flow) profile is checked
before experiment in order to eliminate all offset between pressure sensors. For each
measurement, an averaging procedure (averaging time 1minute, data acquisition 500 Hz) is
used to reduce measurement noise, after checking stationary behavior of pressure and flow
rate signal. Accuracy of pressure measurement is better than 5 Pa (Madani et al., 2007).
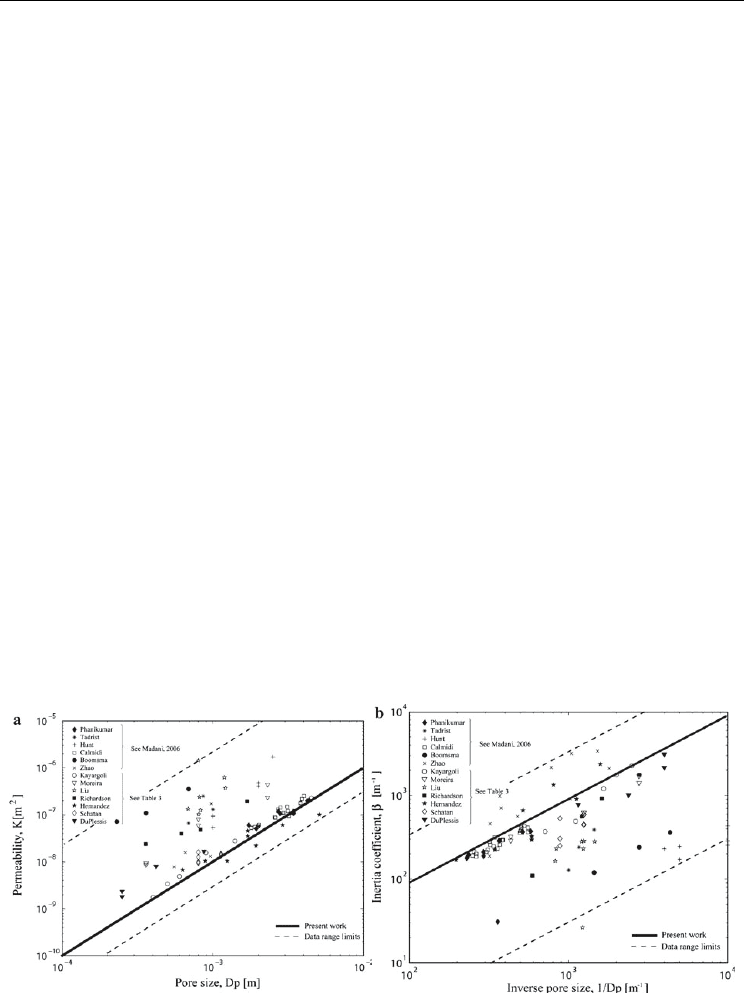
Fig. 4. a. Variation of permeability versus pore diameter. Dashed lines bracket extreme
values. K = k .Dp². b. Variation of inertia coefficient versus inverse pore diameter. Dashed
lines bracket extreme values. β = b . Dp
−1
. From (Bonnet et al., 2008).
Metal Foam Effective Transport Properties
285
After each measurement series, the flow is stopped and the hydrostatic pressure profile is
measured anew and compared to the previous hydrostatic one. In this way we could ensure
that pressure sensors bias has not changed with the time.
Gravity and capillarity driven flow through cell edges during the manufacture of metallic
foams induce material property gradients (tortuosity, cell size…) and cells themselves are
not spherical (Brun et al., 2009). Slight anisotropy of geometrical parameters is observed for
ours sample. Nevertheless at this stage of the study we neglect these effects. Measurement
of full permeability and inertial coefficient tensor is, yet, difficult and the precision of our
set-up in the studied configuration doesn’t allow measurement of transverse pressure
gradient with an accuracy compatible with the objectives of this work (Renard et al., 2001).
3.3 Numerical simulation
Foam meshes have been obtained by reconstruction of tomographic images. We imaged
cylindrical samples of 40 mm diameter and 15 mm thickness. High-resolution
microtomography acquisition was performed on the ID19 beam line of the ESRF. Sample
size was maximized while respecting the data-volume constraint and X-ray image
resolution. We thus acquired a large number of cells while efficiently detecting struts (E.
Brun et al., 2009). We have measured several useful morphological parameters such as
specific surface, porosity, pore diameter distribution and cells orientations from 3D images
analysis using iMorph (Brun et al., 2009; Brun et al., 2008).
The sample size (15 mm in all directions) is sufficient (i.e. greater than Rve) to define
macroscopic parameters. The computational domain is divided in three parts: Inlet zone, test
section and outlet zone to avoid bias product by back conduction and fluid recirculation.
Volume mesh (~1 million cells with a mean size of about 0.2 mm and a minimal one of 0.05
mm) is generated from actual solid surface using StarCCM4+ mesher. It is composed from
core polyhedral meshes in both solid and fluid phases with additional prism layers mesh in
fluid phase in the vicinity of solid surfaces. Boundary conditions are: imposed temperature
on one lateral wall and adiabatic on the others. Inlet temperature and pressure are imposed.
Other walls are symmetry planes.
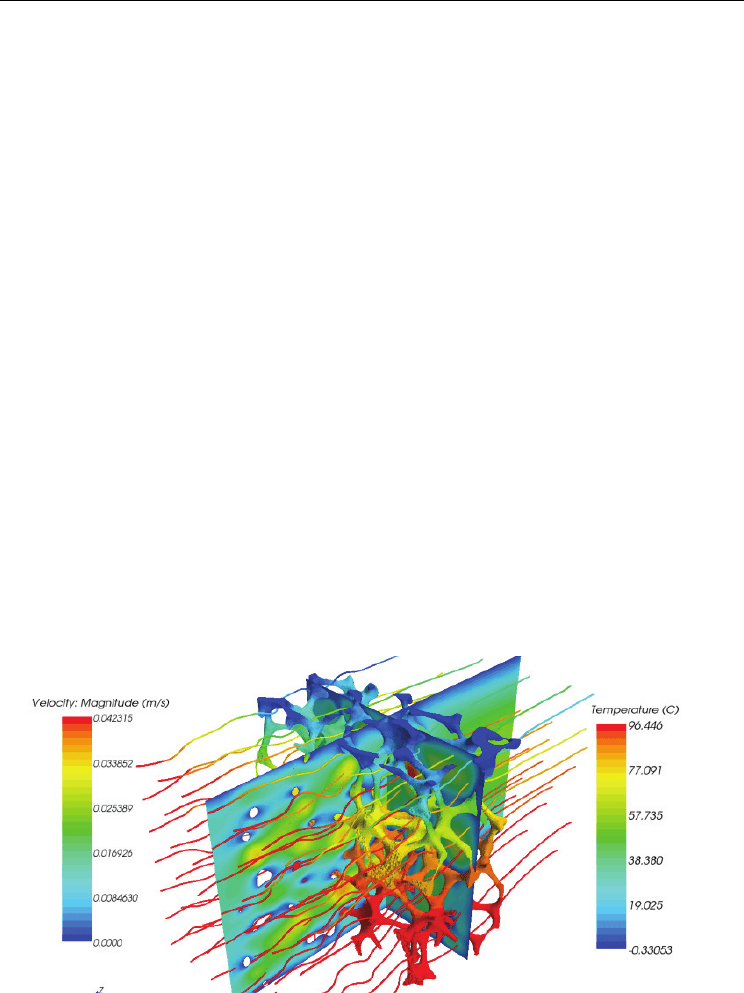
Fig. 5. Simulation of heat and mass transfer in a real metal foam : Both plane sections show
velocity magnitude. Solid matrix surface and streamlines are colored by respectively solid
and fluid temperature. ERG 20PPI. (Hugo et al., 2010)

Evaporation, Condensation and Heat Transfer
286
The Navier-Stokes equations and energy balance equation are solved using a finite volume
method (StarCCM+). These equations are solved at the pore scale and give access to velocity
and pressure fields in the fluid phase and temperature in both, solid and fluid phases. Local
heat fluxes across the solid matrix surface are also determined. Numerical simulations are
performed for a wide Reynolds number range (10
-2
– 10
4
). On Figure 5 the two plane
sections show velocity magnitude. Important velocity gradient could be observed locally
while a constant averaged value is obtained in a cross section normal to principal fluid flow
direction. Solid surface is colored with its temperature. A sharp gradient exists near the
cooled wall while near the other side; fluid and solid temperature are roughly identical. This
indicates that solid matrix allows heat conduction to take place between the heated wall and
the fluid core like a classical fin. Finally, we can observe that the fluid flow is not very
tortuous but struts lead to a local deformation of the thermal boundary layer. This indicates
that boundary layers will not develop near wall channel. Also, some eddies could be located
in the wake of struts. These phenomena govern heat transfer enhancement and pressure
drop increase.
To establish parameters K and
β numerically, simulations must be performed for several
values of Reynolds. K and
β are then computed by fitting pressure gradient versus
superficial velocity data with the Forchheimer model. Results are then compared to those
obtained experimentally. (Kim et al., 2001; Tadrist et al., 2004) give experimental data for
pressure losses in similar metal foam (ERG) for liquid and gas flows (Table 1 and Figure 6).
For clarity, data are shown by a friction factor, defined by (5), versus the Reynolds number.
2
2
ΔPDp 2Dp
f= = +2βDp
LK.Re
0.5ρU
(5)
At macroscopic scale, mean velocities are indeed representative of global fluid behavior.
Nevertheless, according to Reynolds number values, velocity gradients and preferential
paths may appear. For Reynolds near unity, velocity field is very homogeneous, and struts
wakes are very small (Similar to Stokes regimes around cylinders). For higher Reynolds,
large eddies and recirculations are observed in the struts wakes. The flow may become un-
stationary and wake interactions between struts may appear. A strut in the wake of the
previous will exhibit poor heat performance. Preferential high velocity path will cause
rather important pressure gradient. Some high velocity vectors exist just upstream of struts.
This is a typical 3D effect, the flow get around the struts in the third dimension. Global heat
exchange limitation and strong inertia effects intensity at high Reynolds can be explained by
these phenomena. On the other hand, low tortuosity of pore space associated to the
relatively small specific surface of the solid matrix could not explain heat transfer
performance and inertia effect intensity.
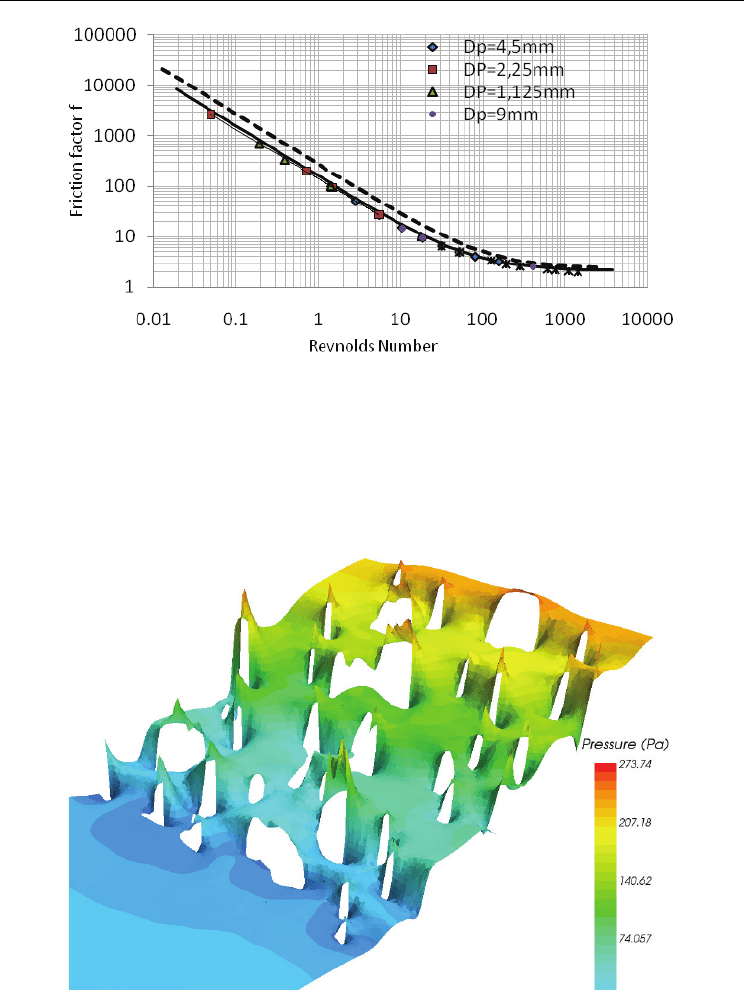
On Figure 6, experimental data from (Tadrist et al., 2004) for two pores diameters (3 and
4.5mm) are compared to numerical results with a good agreement. For all pore diameters,
friction factor is described by a unique curve. Equation (2) associated to these results
demonstrates that both permeability and inertia coefficient evolve with the pore diameter
only for these structurally similar foam samples. For a given Reynolds, to conserve a
constant friction factor, permeability should be proportional to the squared pore diameter
and
β to the inverse of the pore diameter as (Bonnet et al., 2008) has shown experimentally
on several metal foams. Virtual Samples (VS) were created to verify this behaviour (Table1).
Metal Foam Effective Transport Properties
287
Fig. 6. Friction Factor versus Reynolds. Characteristic length: Pore diameter. Good
agreement with experiments from Tadrist et al. (dashed line) is obtained.
Figure 7 shows a 3D representation of the pressure field on a plane section along the main
flow axis for incompressible fluid. Sharp pressure gradient are observed locally near each
struts and in their wake and near each throats. However on a plane section, a mean pressure
gradient can be observed at the sample scale. This shows that the global pressure drop is
due to two phenomena: Viscous effect on the solid surface and in the path of each throat;
inertial effect in the wake of each strut due to eddies formation.
Fig. 7. 3D representation of pressure filed on a plane section along the main flow axis. Local
sharp variations of pressure at throat vicinity are observed, but the averaged pressure
gradient is constant. ERG 20PPI

Evaporation, Condensation and Heat Transfer
288
Sample
Pore
diameter
Strut
Diameter
Porosity
Specific
surface
Permeability
Inertia
coefficient
Dp [µm] ds [µm]
ε
Sp
[m
2
/m
3
]
K [m
2
] β [m
-1
]
Ni 100 500 1.38E-09 1686
Ni10 4429 409 0.92 680 7.63E-08 248
NC 4753 400 0.9 5600 2.01E-09 2175
NC 3743 569 88 0.87 5303 2.11E-09 1329
NC 2733 831 120 0.91 3614 4.79E-09 1088
NC 1723 1840 255 0.88 1658 1.14E-08 446
NC 1116 2452 337 0.89 1295 3.62E-08 364
Cu 40 1500 224 0.95 2000 7.20E-08 1107
Cu 10 4055 152 0.94 758 8.95E-08 180
ERG10 4449 366 0.86 668 1.30E-06 111
ERG20 3720 232 0.89 791 2.97E-07 266
ERG40 2380 189 0.9 1120 6.60E-08 389
Kelvin Cell 14200 1775 0.87 250 2.00E-06 350
CTIF stoch. 4200 * 0.75 800 6.83E-08 2100
VS 5 14880 928 0.89 198 4.80E-06 53
VS 10 7440 464 0.89 396 1.30E-06 111
VS 40 1860 116 0.89 1582 7.48E-08 612
VS 80 930 58 0.89 3164 1.89E-08 1208
Table 1. Summary of various metal foam sample morphological and flow law properties.
Greyed values: Pore scale direct numerical simulation. *Stochastic CTIF foam is not
composed of a struts network (Dairon & Gaillard, 2009). VS samples are Virtual Samples
created by homothetic transform of ERG 20PPI.
The friction factor versus Reynolds curve exhibits two behaviors separated by a transition
zone. For Reynolds smaller than 50, viscous effects are predominant. Pressure drop
increases linearly with the velocity. For high Reynolds (greater than 2000) inertia effects
dominate the flow behavior. The pressure drop increases as the square of velocity. For
Reynolds between 50 and 2000, there is a transition zone where, both, viscous and inertial
effects govern pressure losses. Overall Friction law is well described by the Forchheimer
model. Inertia coefficients and permeability obtained from numerical simulations are
summarized in Table 1. and compared to experimental data. Foam pore diameters in
(Tadrist et al., 2004) study have been determined latter by (Brun, 2009). (Kim et al., 2001)
only gives foam grade; pore diameter are not exactly determined. However, flow law
parameters for 40PPI foam given in both experimental studies are quite close. This
indicates that the grade is clearly not relevant as pore size estimator. Moreover, both
numerical and experimental data lead to the same dependence of
β in function of K.
Several authors have proposed to use squareroot of
K
as pore size estimator but K is
usually difficult to measure accurately. This is particularly true in case of high pore size
foam (> 5 mm).