Amaro A., Reed D., Soares P. (editors) Modelling Forest Systems
Подождите немного. Документ загружается.

15Amaro Forests - Chap 13 1/8/03 11:53 am Page 156

16Amaro Forests - Chap 14 25/7/03 11:06 am Page 157
14 An Allometric-Weibull Model for
Interpreting and Predicting the
Dynamics of Foliage Biomass on
Scots Pine Branches
Richard A. Fleming
1
and Tim R. Burns
1
Abstract
The foliar biomass dynamics on the branches of young, open-grown, Scots pine (Pinus
sylvestris L.) are modelled as functions of branch length and age. These dynamics are rooted in
a biological foundation by assuming that foliage production depends allometrically on branch
length and that foliage survival on a branch follows an age-dependent Weibull distribution.
Like previously constructed descriptive models, the more process-based model developed here
fitted the data well. In contrast to these purely descriptive models, however, this more process-
based model demonstrated some predictive ability when extrapolated, and produced biologi-
cally meaningful parameter estimates.
Introduction
There are a number of motivations for modelling the foliage biomass dynamics of
trees and of even individual branches. Most motivations derive from an interest in
ecophysiology, growth and yield, and the recognition that foliage constitutes the
photosynthetic engine driving plant growth.
Studies of the impact of different treatments (e.g. partial defoliation, fertiliza-
tion, incr
eased atmospheric CO
2
, spacing) on the foliage complement are typically
conducted by comparing a ‘control’ or untreated group of trees with corresponding
treated groups (e.g. Ericsson et al., 1985; Långström et al., 1990; Piene and Fleming,
1996; Skre and Nes, 1996; Lyytikäinen-Saarenmaa, 1999). It is often a logistical chal-
lenge, however, to acquire sample sizes large enough to provide such studies with
much statistical power. As big organisms with complex rooting and branching sys-
tems, each individual sampling unit (of one or more trees) requires ample space.
A possible solution is suggested by the observation that trees have a modular
str
ucture where branches may function as more or less independent units. This
offers the possibility of using branches as experimental units instead of whole trees
(Långström et al., 1990; Sprugel et al., 1991, and references therein). By applying
1
Canadian Forest Service, Great Lakes Forest Research Centre, Canada
Correspondence to: rfleming@nrcan.gc.ca
© CAB International 2003. Modelling Forest Systems (eds A. Amaro, D. Reed and P. Soares) 157

16Amaro Forests - Chap 14 25/7/03 11:06 am Page 158
158 R.A. Fleming and T.R. Burns
treatments to individual branches, the impact on the foliage development of indi-
vidual branches could be studied with less effort than studying the impact on the
foliage development of whole trees. By comparing the development of treated (e.g.
artificially defoliated) branches on trees with only a few selected branches receiving
treatment with the development of whole trees receiving a whole-tree treatment, the
suitability of individual branches as substitutes for completely treated trees could be
evaluated (Långström et al., 1998).
Measuring treatment effects on the foliage development of a branch requires
accurate estimates of pr
e-treatment foliage biomass. This poses a problem because
accurate estimates of foliage biomass typically require that foliage be removed from
its branch and oven-dried. This precludes measuring pre-treatment (and conse-
quently the change in) foliage dry weight directly, because foliage removal affects
the sample branches and trees and thus confounds the treatment. In addition,
foliage drying is typically very inconvenient and time-consuming.
State of the Art
One approach to getting accurate estimates of pre-treatment foliage biomass is to
use other variables which can be measured non-destructively. For instance, Piene
(1983) estimated the total foliage biomass per branch of 25- to 30-year-old balsam fir
(Abies balsamea (L.) Mill.) using an algorithm that required as input the number of
shoots on the branch, and for each age class of shoot it required the average shoot
and needle lengths and the percentage litter fall. Although much more efficient than
previous methods, Piene’s procedure still relied on detailed information about each
foliage age class on each branch and he found that the predicted foliage biomass
consistently underestimated the actual foliage biomass.
While working with Scots pine (Pinus sylvestris L.), Långström et al. (1998) tried
to further str
eamline the estimation of foliar biomass per branch by using only vari-
ables relevant to the branch as a whole and excluding variables associated with indi-
vidual age classes of foliage. (This use of whole-branch characteristics may be
reliable within the range of the data for conifer species such as balsam fir and Scots
pine, which have regular, orderly branching patterns; it is probably less accurate on
species such as jack pine (Pinus banksiana Lamb.) which branch irregularly.)
Långström et al. (1998) began by assuming an allometric relationship between foliar
biomass and the length of the branch. Recognizing that branch age was also likely to
be a factor, since few Scots pine needles remain longer than 3 years on their branch,
these authors expanded the allometric relationship by incorporating branch age
along with additional powers of branch length to produce a polynomial relationship
with interactions. Accordingly, they expressed the mean foliar biomass, measured as
total needle dry weight (g), on a branch A growing seasons old and of length L (cm) as
(
,YA L
)
= exp
{
b + b L + b A + b
L2
L
2
+ b
AL
AL + b A
2
}
(1)
0 L A A2
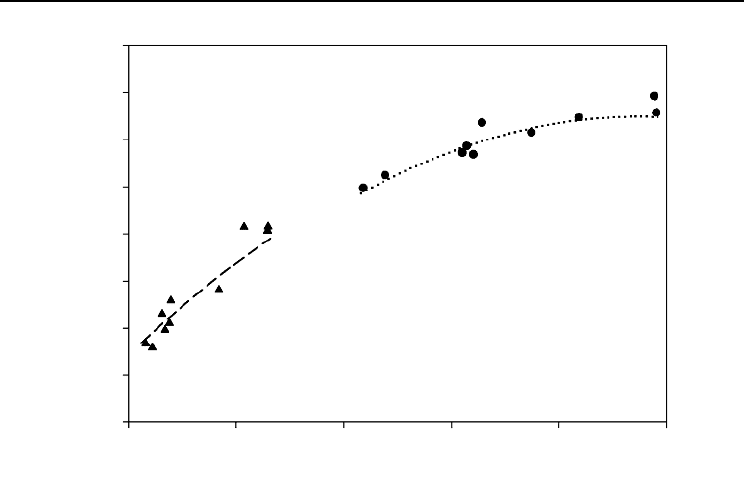
This equation was logarithmically transformed to produce a second-order polyno-
mial model which was then fitted by linear regression (Fig. 14.1). The data were
from the undefoliated or ‘control’ trees in their (Långström et al., 1998) study of the
effects of artificial defoliation on the foliage dynamics of Scots pine (see section on
Data below for more detail). Parameter b
A
was eliminated because it was not signifi-
cantly (α = 0.05) different from zero. The resulting five-parameter (transformed)
model fitted the data well: r
2
= 92.5% and standard error of estimate (SEE) = 0.341.
When the model was extrapolated, however, to estimate the foliage biomass of
unusually lar
ge branches, which are important because they often bear much
16Amaro Forests - Chap 14 25/7/03 11:06 am Page 159
159 Allometric-Weibull Model for Foliage Biomass
expansion of the allometric model (Equation 1) when fitted to only the 77 shortest
potential for extrapolation.
Methodology
The model is developed by thinking of changes in foliage biomass as being the
n
(triangles, A A
6
5
4
3
2
1
0
–1
–2
In (foliar biomass (g))
0 25 50 75 100 125
Branch length (cm)
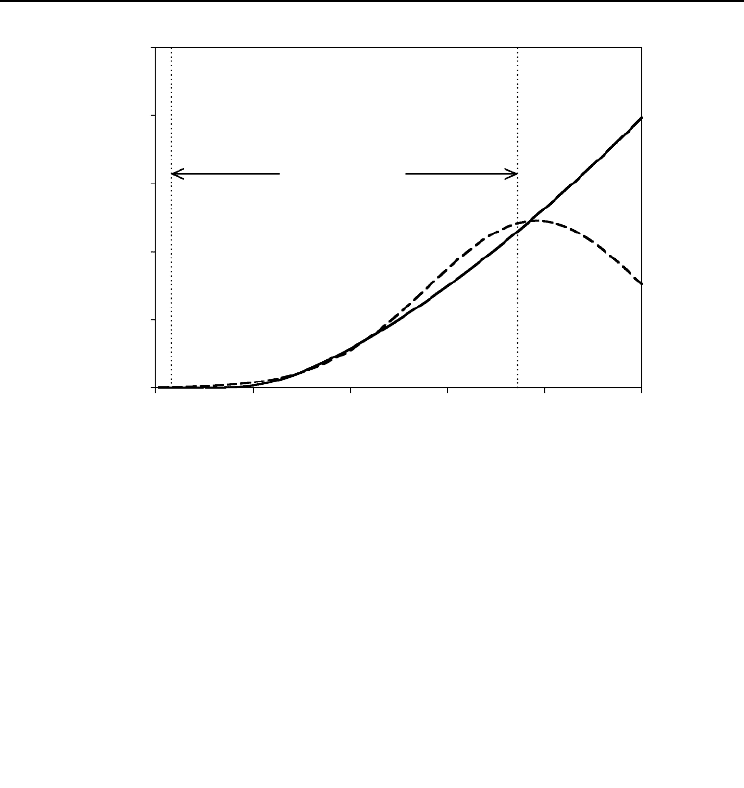
foliage, predictions contradicted biologically based expectations. For instance, the
dashed line in Fig. 14.2 shows the predictions of the second-order polynomial
branches. These predictions deviate from the biological expectation of continued
allometric growth for longer branches (see Fig. 14.1). That this dashed line also rep-
resents the corresponding third-order expansion shows that higher order models are
not necessarily better. This long-recognized difficulty with polynomial models is
important whenever predictions are needed near the edges of the data or beyond,
and Scots pine branches can exceed 150 cm in length. In what follows, modelling the
foliage biomass of Scots pine branches is pursued with a more process-oriented
approach than used earlier, in the hope of fitting the data well and improving on the
This chapter refines previous exploratory work (Fleming, 2001) in developing another
approach to modelling relationships between a branch’s length, age and foliar bio-
mass for conifers with regular branching patterns. Ideally such a model will be based
on biological relationships so that its mathematical structure will produce both good
fits to the data and realistic extrapolations beyond the range of the data set. This
approach is applied to the same data used to fit Equation 1.
net result of different demographic processes (Harper and Bell, 1979). Assuming for
the moment that changes in the biomass of individual needles make relatively
minor contributions to changes in foliar biomass, changes in the latter represent the
difference between the biomass of new needles produced each year by the new
Fig. 14.1. Natural logarithm (ln) of foliar biomass (dry weight) plotted against branch length. The dashed
and dotted curves show the fit of Equation 1 to cross-sections of all ( = 97) data for branches in their first
= 0) and fifth (solid circles, = 4) growing seasons, respectively.
16Amaro Forests - Chap 14 25/7/03 11:06 am Page 160
160 R.A. Fleming and T.R. Burns
shoots on the branch and the mortality of needles as they age. Hence, following
Långström et al
tion of branch length, and following Fleming and Piene (1992a,b), it is assumed that
an age-dependent population survival model can describe needle survival on the
branch. Putting these two assumptions into mathematical form and adopting the
independent, the foliar biomass (g) on a branch of age A
length L cm can be written:
(2)
The factor P(L
branch. P(L) is assumed to be an allometric function of L, the length (cm) of the
branch, so that
(3)
w = P(1) > 0 (P(1) = P(L) when L = 1) and c
the specific rate of change in P(L
specific rate of change of length: dP(L)/P(L) = (c+1) dL/L
if c
length, branch age, A
of similar length (Fig. 14.3).
PL
c
()
=
+1
,
( )
=
()( )
range of
observations
Branch length (cm)
50 75 100 125250
125
100
75
50
25
0
Foliar biomass (g)
A
. (1998), it is assumed that needle production is an allometric func-
simplifying assumption that the processes of needle production and survival are
growing seasons and
) represents the dry weight of needles produced over the years on the
where represents a constant. This equa-
tion satisfies the definition for allometric growth (Pienaar and Turnbull, 1973) in that
) bears a constant proportional relationship to the
where d represents the dif-
ferential operator. (The ‘+1’ in the exponent is convenient for parameter estimation:
is not significantly different from 0 then the corresponding exponent can be con-
sidered equal to 1 and dropped.)
When comparing the foliage productivity of different branches of the same
, becomes an additional consideration. Younger branches have
less time than older branches to build networks of side branches. Side branches pro-
vide extra surface area for growing foliage, so young branches of a given length
tend to have less branch surface area on which to grow foliage than older branches
wL
YA L P L S A
Fig. 14.2. Predictions of the models when fitted to the 77 shortest branches. Branch age is fixed at its mean,
= 4.12 years. The dashed curve represents the second- (Equation 1) and third-order polynomial
expansions of the allometric model. The solid curve illustrates the corresponding basic allometric growth.
16Amaro Forests - Chap 14 25/7/03 11:06 am Page 161
161 Allometric-Weibull Model for Foliage Biomass
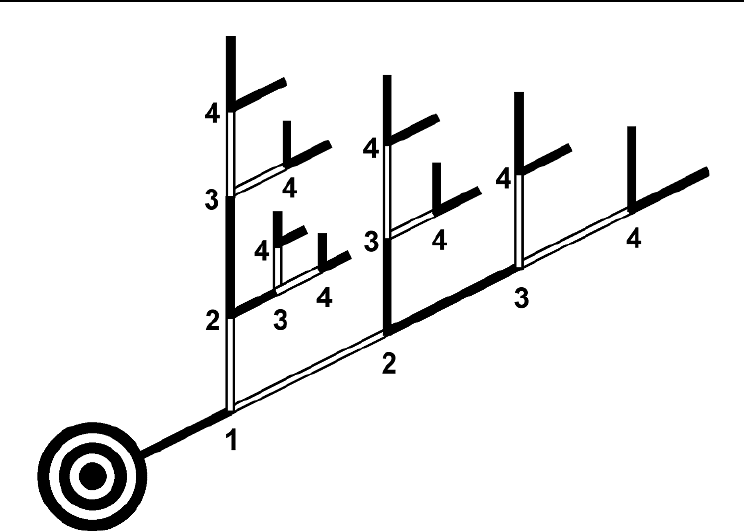
Fig. 14.3. Schematic of a 5-year-old Scots pine branch (after Flower-Ellis et al., 1976; Långström, 1980).
Numbers 1–4 at forks indicate cumulative growth along the main and side axes over each of the branch’s
first four growing seasons. The final increments beyond the last (A = 4) forks were added in the fifth growing
season and represent the youngest shoots.
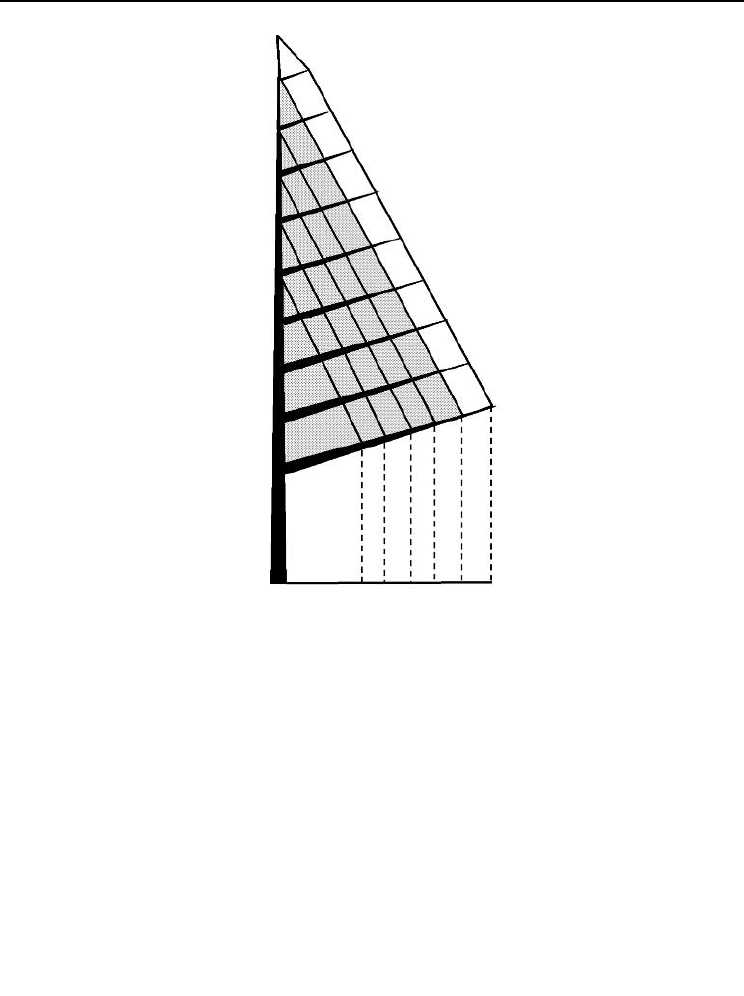
In contrast, although the very oldest branches may have extensive networks of
side branches, they occur at the base of the crown (Fig. 14.4) where light is more lim-
ited. Under limited light, a decline in foliage production rates (per unit branch sur-
face area) is conceivable. For these reasons, the expression for foliage productivity
was expanded beyond its basic allometric form to
cA+1
PAL
)
= wAL
(
,
()
()
(4)
where w
(A) = P(A,1) > 0 (P(A,1) = P(A, L) when L=1) and c(A) now represents
unspecified functions of branch age. The biology of foliage development on growing
branches restricts the range of the allometric function, c(A). Branches tend to grow
side branches as they age (Fig. 14.3), so long branches tend to have disproportion-
ately more available surface area than short branches for growing foliage.
Accordingly, c(A) > 0.
In Equation 2, S(A) represents the proportion of the foliage surviving on
branches of age
A. The Weibull model was adopted to approximate S(A) because:
(i) it is relatively simple and flexible when compared with other survivorship mod-
els (Kalbfleisch and Pr
entice, 1980), and (ii) it has been successfully applied to
foliage survivorship in other conifers (Fleming and Piene, 1992a,b; Piene and
Fleming, 1996). Therefore, we model the proportion of the original foliage biomass
surviving on a branch of age A as
/
v+1
}
SA
()
= exp
{
−
(
A u
)
(5)
where u > 0 and
v > 1 represent constants.
16Amaro Forests - Chap 14 25/7/03 11:06 am Page 162
162 R.A. Fleming and T.R. Burns
branch length, with the uppermost branches being particularly vulnerable.
weight of foliage on a branch of age A and length L:
(6)
w(A) and c(A
After explicitly writing in the linear functions, Equation 6 was
cA
v
, exp /
( )
=
()
−
( )
{ }
()
+
+
1
1
Shoot age
54321
1
2
3
4
5
6
7
8
9
Branch age
et al.
the bottom.
Branch length has been considered a factor when comparing foliage survival on
branches produced in the same year. Fleming (2001) noted that foliage on the
longest branches, especially on the outer extremities of those branches, is exposed to
foliar mortality agents such as freezing rain and high winds. However, for open-
grown trees, branch height is thought to be more important in this regard than
Therefore, since a branch’s height (crown position) is closely related to its age (Fig.
14.4), it is reasonable to initially and tentatively assume that foliage survival can be
largely explained by branch age alone. (An added benefit of this assumption is that
it simplifies model fitting.) Consequently, Equations 4 and 5 were substituted into
Equation 2 to produce an allometric-Weibull model to approximate the total dry
For simplicity, we assume that ) are linear. (More complex rela-
tionships can be entertained later if this simple approach does not prove satisfac-
tory.)
log-transformed to produce homogeneity of variance in the dependent variable
and symmetry of the residuals. Non-linear regression was used to fit the resulting
log-transformed equation. This process involved recursive model building and the
application of a pseudo Gauss–Newton algorithm for non-linear least squares esti-
YAL wAL A u
>5
Fig. 14.4. Schematic of a 10-year-old Scots pine (after Ericsson , 1980). Branch ages in completed
growing seasons are shown vertically on the right. Ages of shoots on the main branch axis are shown along

16Amaro Forests - Chap 14 25/7/03 11:06 am Page 163
163 Allometric-Weibull Model for Foliage Biomass
mation (Ralston, 1992) of each model constructed. At each stage in this recursive
process, parameters with estimates not significantly different from zero (α = 0.05)
according to the partial F-test (Draper and Smith, 1981) were removed and the
reduced model refitted. This procedure was continued until only parameters with
statistically significant estimates remained. Residual distributions and residuals
plotted against predictions and predictor variables were examined to verify rea-
sonable compliance with the assumptions of regression.
Predicted values resulting from fitting the log-transformation of Equation 6 are
not dir
ectly useful because they represent geometric means and it is arithmetic
means that are needed. To get arithmetic predicted means, the fitted equation must
be back-transformed and the right side multiplied by the correction factor (Sprugel,
1983), exp{
SEE
2
/2}. Then the (arithmetic) mean foliar biomass (g dry weight) for a
branch L cm long and A years of age can be predicted by substituting the parameter
estimates and
SEE (standard error of estimate) from fitting the log-transformation of
Equation 6 into the general expression,
L1
v+1
YA L
)
= exp ln
(
w + w
A
A
)
+
(
c + + c
A
A
)
ln
()
−
(
A / u
)
+
SEE
2
/ 2
}
(7)
(
,
{
0 0
Test of extrapolation reliability
It was suggested above, in the context of Fig. 14.2, that the two fitted polynomial
expansions of allometric gr
owth appeared less biologically plausible than the more
process-oriented, allometric-Weibull model when extrapolated to large branches. To
test this notion more thoroughly, these three models were each fitted to the observa-
tions from the 77 shortest (L < 93 cm) branches as described above. By inputting
appropriate combinations of A and L, predictions were obtained from each model
for the 20 longest branches (93 cm < L < 125 cm) in the data set. This amounted to
extrapolating each model up to 34.4% beyond the range of the data used for fitting.
The extrapolated predictions were compared with the observed foliar biomass
of the 20 longest branches to estimate the r
elative reliability of each model for
extrapolation. Three options for estimating bias were considered (Zar, 1996). The
paired t-test was applied if the deviations (observations corresponding predic-
tions from extrapolation) had approximately normal distributions. Otherwise, if the
variance of the extrapolated predictions did not differ substantially from the vari-
ance of the observations, the Mann–Whitney test (Mann and Whitney, 1947) was
applied. Failing that, a two-sample t-test without pooled variances was applied.
Data
The data were produced in an artificial defoliation study (Långström et al., 1998)
conducted at Ivantjärnsheden, Jädraås, in central Sweden, about 200 km north-west
of Stockholm (61° N, 16° E, 185 m above sea level). The site was in a heath Scots pine
forest, of dry dwarf shrub type, with a podzolic soil profile. (Axelsson and
Bråkenhielm (1980) provide a detailed description of the area.) The site had been
clearcut in 1971, and planted in 1972 with Scots pine seedlings of local provenance
at 2000 seedlings per hectare. Naturally regenerated pine seedlings had developed
in gaps following seedling mortality. The stand was cleaned in 1985 to about 1500
stems per hectare, and by spring 1991, was a pure pine stand with some open
patches.

16Amaro Forests - Chap 14 25/7/03 11:06 am Page 164
164 R.A. Fleming and T.R. Burns
The 97 observations used in this chapter were made on open-grown, untreated
(i.e. ‘control’) Scots pines in August 1991, at the end of the growing season that year.
The data consist of branch lengths and corr
esponding foliage biomasses for
branches which had experienced 1–10 full growing seasons (i.e. ages A = 1–10).
These data were supplemented by observations taken in June 1991, before the 1991
growing season, on branches initiated in 1990. These supplementary observations
provide information on new branches (age A = 0) but their use requires the assump-
tion that foliage losses from these new branches were minimal in the winter of
1990/91.
Results
Fitting the allometric-Weibull model, Equation 6, after log-transformation, to all 97
observations resulted in
SEE = 0.343 and a pseudo r
2
(Ralston, 1992) of 92.4%. The
estimates of the statistically significant parameters, their
SEs (standard errors) and
their P values were w
0
= 0.0799 (SE = 0.0246, P = 0.0016), c
0
= 0.279 (SE = 0.1060, P =
0.01), c
A
= 0.237 (SE = 0.0327, P < 0.0001), u = 1.57 (SE = 0.226, P < 0.0001) and v =
0.312 (
SE = 0.0638, P < 0.0001). According to these results, foliage biomass is pre-
dicted to increase allometrically with branch length on branches of all ages and the
rate of this allometric increase depends on branch age (Fleming, 2001; Fig. 14.3). It is
slow on old branches, presumably because of high foliage losses. It is also slow on
very young branches, presumably because such branches have had little time to
develop extensive networks of lower order side branches which provide much addi-
tional surface for growing foliage (Långström et al., 1998). The youngest branches
also occupy some of the most exposed parts of the crown where their foliage may be
especially vulnerable to mortality from freezing rain or high winds. The low foliar
biomass on very short branches may be because these branches are very young, are
shaded by overhanging branches or were broken off before the data were collected,
and much foliage was lost when this happened.
To gauge the adequacy of Equation 7, a predicted arithmetic mean was calcu-
lated using the values of
A and L corresponding to each observation. The r
2
value
(i.e. the square of the Pearson correlation coefficient between the observations) and
these pr
edictions was 85.4%. The 97 paired differences were not normally distrib-
uted (P < 0.0005) and the variances of the distributions of observations and predic-
tions differed little (P = 0.909), so the Mann–Whitney test was applied to reveal bias.
The high P value (0.810) of this test is consistent with the practical absence of statis-
tically significant bias. The solid curve in Fig. 14.2 shows the allometric growth pre-
dicted by fixing A at its average, 4.12 growing seasons, and substituting the
estimated parameter values into Equation 7.
Extrapolation reliability
In fitting both the second- (Equation 1) and third-order polynomial expansions of
allometric gr
owth to the 77 shortest branches, six parameters were statistically sig-
nificant, and hence were retained. Only parameters w
0
, c
0
, u and v were retained in
fitting the allometric-Weibull model. Characteristics (
SEE, r
2
) of fitting log-transfor-
mations of these models were: second-order polynomial (Equation 1) (0.349 g,
91.8%), third-order polynomial (0.340 g, 92.2%) and allometric-Weibull model (0.374
g, 90.3%). Table 14.1 gives the results of comparing extrapolations of these fits to the
20 longest branches.

16Amaro Forests - Chap 14 25/7/03 11:06 am Page 165
165 Allometric-Weibull Model for Foliage Biomass
Table 14.1. Performance of model fits to the 77 shortest (L
≤ 93 cm) branches when extrapolated to the
20 longest (93 cm ≤ L ≤ 125 cm) branches.
Deviations Extrapolations
(observation extrapolated
prediction)
Model Standard Equal Two-sample Pearson
mean error Normal?
a
variances?
b
t-test
c
correlation
2nd-order polynomial 13.4 g 6.43 g P = 0.012 P = 0.062 P = 0.041 r =0.102 P =0.670
expansion
3rd-order polynomial 13.2 g 6.86 g P = 0.055 P = 0.053 P = 0.066 r =0.004 P =0.986
expansion
Allometric-Weibull 2.96 g 4.87 g P = 0.045 P = 0.084 P = 0.639 r =0.533 P =0.015
model
a
Anderson–Darling test (Anderson and Darling, 1954).
b
Levene’s test (Levene, 1960).
c
Without pooled variances.
Discussion and Conclusions
Table 14.1 shows that the allometric-Weibull model provides a more reliable basis
for extrapolating to large branches than using polynomial expansions of allometric
relationships such as Equation 1. Together, the mean deviations and the results of
the two-sample t-tests show tendencies for the polynomial expansions to underesti-
mate the foliage biomass of long branches. In contrast, for the allometric-Weibull
model, the relatively high P value of its two-sample t-test and its relatively low
mean deviation provide no indication of bias. The correlation coefficients and their
associated P values show that: (i) the extrapolated polynomial expansions provide
little information about trends in foliage biomass for long branches, while (ii) the
allometric-Weibull still explains a statistically significant part of the variation in
foliage biomass when extrapolated to the 20 longest branches. Clearly, the allomet-
ric-Weibull model is an improvement on the polynomial approach, but these results
also indicate the dangers of extrapolating: the model’s r
2
is 84.2% when fitted to the
77 shortest branches but falls to 28.4% when extrapolated to the 20 longest.
One advantage of using well-studied models for constructing subcomponents
of lar
ger models is that it can simplify the interpretation of results. In developing the
model presented in Equation 6, the Weibull distribution model was used to describe
the process of foliage mortality/survival on a branch (Equation 5). Because changes
to v and u, respectively, do and do not affect the distribution’s shape, they have
become known as the ‘shape’ and ‘scale’ parameters.
In our case, v > 0 (P < 0.0001), so the age-specific mortality rate increases monot-
onically and asymptotically with age towar
ds its maximum. This situation occurs in
many ageing populations in which individuals suffer ‘wear-out’ or ‘old age’ effects.
Since it was branch age, not foliage age, that was recorded, inferences about the dis-
tribution of foliage longevities must be made in terms of branch age. For instance,
v > 0 indicates that rates of branch age-specific foliage survivorship decreased with
branch age.
Finally, that c
A
was significantly greater than zero suggests that foliar produc-
tion increased with branch age. This implies that the tendency for very young
branches to have relatively restricted networks of lower order side branches (and
thus relatively little potential branch surface on which to grow foliage per unit