Anderson D.R., Sweeney D.J., Williams T.A. Essentials of Statistics for Business and Economics
Подождите немного. Документ загружается.

Statistics in Practice 305
Founded in 1957 as Food Town, Food Lion is one of the
largest supermarket chains in the United States, with 1300
stores in 11 Southeastern and Mid-Atlantic states. The com-
pany sells more than 24,000 different products and offers
nationally and regionally advertised brand-name merchan-
dise, as well as a growing number of high-quality private
label products manufactured especially for Food Lion. The
company maintains its low price leadership and quality
assurance through operating efficiencies such as standard
store formats, innovative warehouse design, energy-
efficient facilities, and data synchronization with suppliers.
Food Lion looks to a future of continued innovation,
growth, price leadership, and service to its customers.
Being in an inventory-intense business, Food Lion
made the decision to adopt the LIFO (last-in, first-out)
method of inventory valuation. This method matches cur-
rent costs against current revenues, which minimizes the
effect of radical price changes on profit and loss results.
In addition, the LIFO method reduces net income thereby
reducing income taxes during periods of inflation.
Food Lion establishes a LIFO index for each of seven
inventory pools: Grocery, Paper/Household, Pet Supplies,
Health & Beauty Aids, Dairy, Cigarette/Tobacco, and
Beer/Wine. For example, a LIFO index of 1.008 for the
Grocery pool would indicate that the company’s grocery
inventory value at current costs reflects a .8% increase due
to inflation over the most recent one-year period.
A LIFO index for each inventory pool requires that
the year-end inventory count for each product be valued
at the current year-end cost and at the preceding year-end
cost. To avoid excessive time and expense associated
with counting the inventory in all 1200 store locations,
Food Lion selects a random sample of 50 stores. Year-
end physical inventories are taken in each of the sample
stores. The current-year and preceding-year costs for
each item are then used to construct the required LIFO
indexes for each inventory pool.
For a recent year, the sample estimate of the LIFO
index for the Health & Beauty Aids inventory pool was
1.015. Using a 95% confidence level, Food Lion com-
puted a margin of error of .006 for the sample estimate.
Thus, the interval from 1.009 to 1.021 provided a 95%
confidence interval estimate of the population LIFO
index. This level of precision was judged to be very good.
In this chapter you will learn how to compute the
margin of error associated with sample estimates. You
will also learn how to use this information to construct
and interpret interval estimates of a population mean
and a population proportion.
Fresh bread arriving at a Food Lion Store.
FOOD LION*
SALISBURY, NORTH CAROLINA
STATISTICS in PRACTICE
*The authors are indebted to Keith Cunningham, Tax Director, and Bobby
Harkey, Staff Tax Accountant, at Food Lion for providing this Statistics in
Practice.
In Chapter 7, we stated that a point estimator is a sample statistic used to estimate a popula-
tion parameter. For instance, the sample mean is a point estimator of the population mean
μ and the sample proportion is a point estimator of the population proportion p. Because
a point estimator cannot be expected to provide the exact value of the population parameter,
an interval estimate is often computed by adding and subtracting a value, called the mar-
gin of error, to the point estimate. The general form of an interval estimate is as follows:
Point estimate
⫾
Margin of error
p¯
x¯
© Jeff Greenberg/PhotoEdit
CH008.qxd 8/16/10 6:38 PM Page 305
Copyright 2010 Cengage Learning. All Rights Reserved. May not be copied, scanned, or duplicated, in whole or in part. Due to electronic rights, some third party content may be suppressed from the eBook and/or eChapter(s).
Editorial review has deemed that any suppressed content does not materially affect the overall learning experience. Cengage Learning reserves the right to remove additional content at any time if subsequent rights restrictions require it.

The purpose of an interval estimate is to provide information about how close the point
estimate, provided by the sample, is to the value of the population parameter.
In this chapter we show how to compute interval estimates of a population mean μ and
a population proportion p. The general form of an interval estimate of a population mean is
Similarly, the general form of an interval estimate of a population proportion is
The sampling distributions of and play key roles in computing these interval estimates.
8.1 Population Mean: σ Known
In order to develop an interval estimate of a population mean, either the population stan-
dard deviation σ or the sample standard deviation s must be used to compute the margin of
error. In most applications σ is not known, and s is used to compute the margin of error. In
some applications, however, large amounts of relevant historical data are available and can
be used to estimate the population standard deviation prior to sampling. Also, in quality con-
trol applications where a process is assumed to be operating correctly, or “in control,” it is
appropriate to treat the population standard deviation as known. We refer to such cases as
the σ known case. In this section we introduce an example in which it is reasonable to treat
σ as known and show how to construct an interval estimate for this case.
Each week Lloyd’s Department Store selects a simple random sample of 100 customers
in order to learn about the amount spent per shopping trip. With x representing the amount
spent per shopping trip, the sample mean provides a point estimate of μ, the mean amount
spent per shopping trip for the population of all Lloyd’s customers. Lloyd’s has been using
the weekly survey for several years. Based on the historical data, Lloyd’s now assumes a
known value of σ ⫽ $20 for the population standard deviation. The historical data also in-
dicate that the population follows a normal distribution.
During the most recent week, Lloyd’s surveyed 100 customers (n⫽ 100) and obtained
a sample mean of ⫽ $82. The sample mean amount spent provides a point estimate of the
population mean amount spent per shopping trip, μ. In the discussion that follows, we show
how to compute the margin of error for this estimate and develop an interval estimate of the
population mean.
Margin of Error and the Interval Estimate
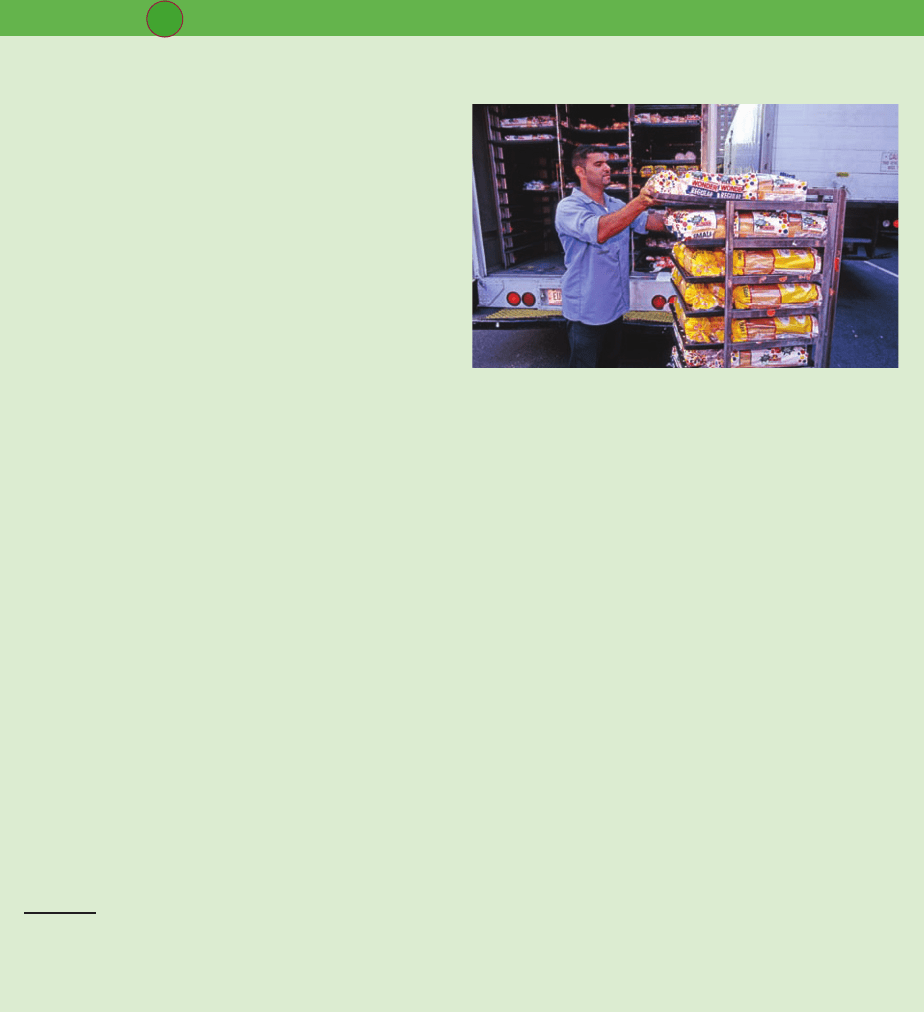
In Chapter 7 we showed that the sampling distribution of can be used to compute the
probability that will be within a given distance of μ. In the Lloyd’s example, the his-
torical data show that the population of amounts spent is normally distributed with a
standard deviation of σ ⫽ 20. So, using what we learned in Chapter 7, we can conclude
that the sampling distribution of follows a normal distribution with a standard error of
⫽⫽ ⫽2. This sampling distribution is shown in Figure 8.1.
1
Because20兾
兹
100σ兾
兹
nσ
x
¯
x¯
x¯
x¯
x¯
x¯
p¯x¯
p¯
⫾
Margin of error
x¯
⫾
Margin of error
306 Chapter 8 Interval Estimation
1
We use the fact that the population of amounts spent has a normal distribution to conclude that the sampling distribution of
x
_
has a normal distribution. If the population did not have a normal distribution, we could rely on the central limit theorem
and the sample size of
n
⫽ 100 to conclude that the sampling distribution of
x
_
is approximately normal. In either case, the
sampling distribution of
x
_
would appear as shown in Figure 8.1.
file
WEB
Lloyd’s
CH008.qxd 8/16/10 6:38 PM Page 306
Copyright 2010 Cengage Learning. All Rights Reserved. May not be copied, scanned, or duplicated, in whole or in part. Due to electronic rights, some third party content may be suppressed from the eBook and/or eChapter(s).
Editorial review has deemed that any suppressed content does not materially affect the overall learning experience. Cengage Learning reserves the right to remove additional content at any time if subsequent rights restrictions require it.
8.1 Population Mean: Known 307
x
Sampling distribution
of x
μ
3.92 3.92
= 2
σ
x
1.96
σ
x
1.96
95% of all
x values
σ
x
x
Sampling distribution
of x
μ
σ
x
=
σ
n
=
20
100
= 2
FIGURE 8.1 SAMPLING DISTRIBUTION OF THE SAMPLE MEAN AMOUNT
SPENT FROM SIMPLE RANDOM SAMPLES OF 100 CUSTOMERS
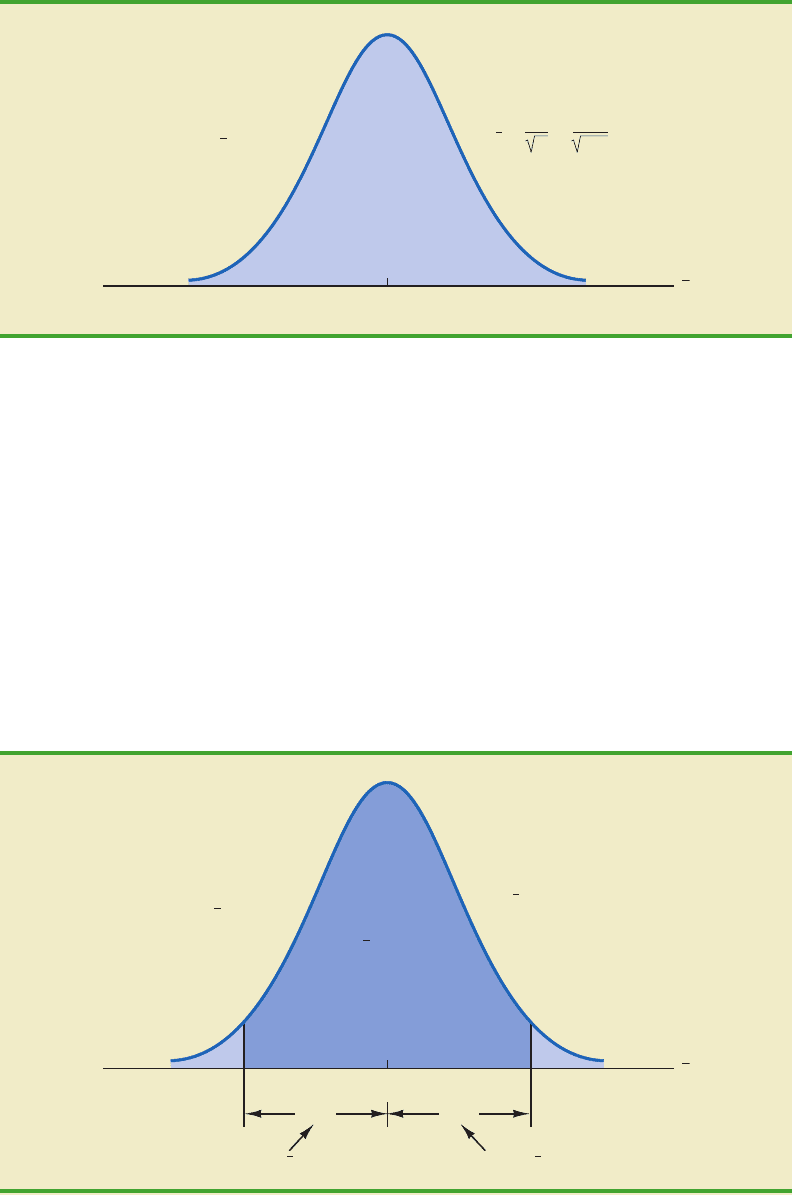
FIGURE 8.2 SAMPLING DISTRIBUTION OF SHOWING THE LOCATION OF SAMPLE
MEANS THATARE WITHIN 3.92 OF μ
x¯
the sampling distribution shows how values of are distributed around the population mean
μ, the sampling distribution of provides information about the possible differences between
and μ.
Using the standard normal probability table, we find that 95% of the values of any nor-
mally distributed random variable are within ⫾1.96 standard deviations of the mean. Thus,
when the sampling distribution of is normally distributed, 95% of the values must be
within ⫾1.96 of the mean μ. In the Lloyd’s example we know that the sampling distribu-
σ
x
¯
x¯x¯
x¯
x¯
x¯
tion of is normally distributed with a standard error of ⫽ 2. Because ⫾1.96 ⫽σ
x
¯
σ
x
¯
x¯
1.96(2) ⫽ 3.92, we can conclude that 95% of all values obtained using a sample size
of n ⫽ 100 will be within ⫾3.92 of the population mean μ. See Figure 8.2.
x¯
CH008.qxd 8/16/10 6:38 PM Page 307
Copyright 2010 Cengage Learning. All Rights Reserved. May not be copied, scanned, or duplicated, in whole or in part. Due to electronic rights, some third party content may be suppressed from the eBook and/or eChapter(s).
Editorial review has deemed that any suppressed content does not materially affect the overall learning experience. Cengage Learning reserves the right to remove additional content at any time if subsequent rights restrictions require it.
308 Chapter 8 Interval Estimation
Sampling distribution
of x
3.92 3.92
x
1
Interval based on
x
1
± 3.92
x
95% of all
x values
x
2
x
3
Interval based on
x
3
± 3.92
(note that this interval
does not include )
The population
mean
μ
μ
μ
Interval based on
x
2
± 3.92
x
= 2
σ
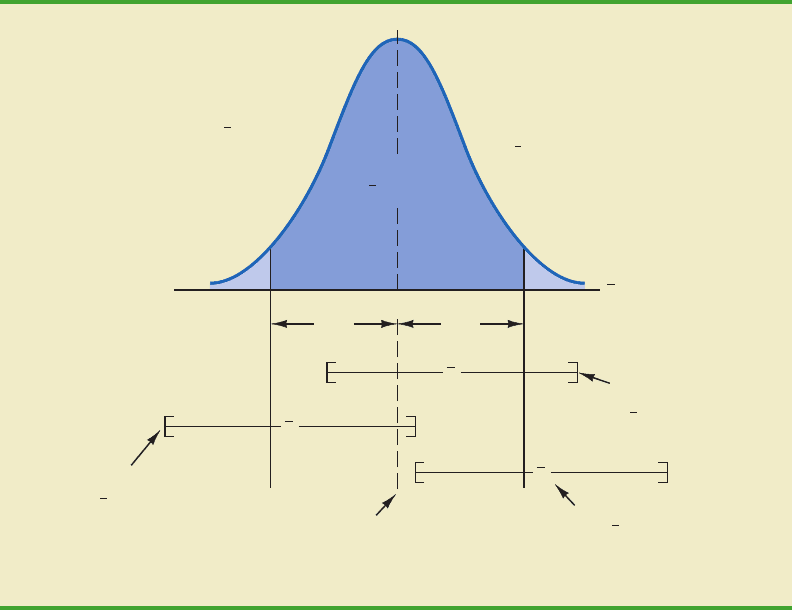
FIGURE 8.3 INTERVALS FORMED FROM SELECTED SAMPLE MEANS
AT LOCATIONS
1
,
2
, AND
3
x¯x¯x¯
In the introduction to this chapter we said that the general form of an interval estimate of
the population mean μ is ⫾ margin of error. For the Lloyd’s example, suppose we set the
margin of error equal to 3.92 and compute the interval estimate of μ using ⫾ 3.92. To pro-
vide an interpretation for this interval estimate, let us consider the values of that could be
obtained if we took three different simple random samples, each consisting of 100 Lloyd’s cus-
tomers. The first sample mean might turn out to have the value shown as
1
in Figure 8.3. In
this case, Figure 8.3 shows that the interval formed by subtracting 3.92 from
1
and adding
3.92 to
1
includes the population mean μ. Now consider what happens if the second sample
mean turns out to have the value shown as
2
in Figure 8.3. Although this sample mean dif-
fers from the first sample mean, we see that the interval formed by subtracting 3.92 from
2
and adding 3.92 to
2
also includes the population mean μ. However, consider what happens
if the third sample mean turns out to have the value shown as
3
in Figure 8.3. In this case, the
interval formed by subtracting 3.92 from
3
and adding 3.92 to
3
does not include the popu-
lation mean μ. Because
3
falls in the upper tail of the sampling distribution and is farther than
3.92 from μ, subtracting and adding 3.92 to
3
forms an interval that does not include μ.
Any sample mean that is within the darkly shaded region of Figure 8.3 will provide
an interval that contains the population mean μ. Because 95% of all possible sample means
are in the darkly shaded region, 95% of all intervals formed by subtracting 3.92 from and
adding 3.92 to will include the population mean μ.
Recall that during the most recent week, the quality assurance team at Lloyd’s surveyed
100 customers and obtained a sample mean amount spent of ⫽ 82. Using ⫾ 3.92 tox¯x¯
x¯
x¯
x¯
x¯
x¯
x¯x¯
x¯
x¯
x¯
x¯
x¯
x¯
x¯
x¯
x¯
x¯
CH008.qxd 8/16/10 6:38 PM Page 308
Copyright 2010 Cengage Learning. All Rights Reserved. May not be copied, scanned, or duplicated, in whole or in part. Due to electronic rights, some third party content may be suppressed from the eBook and/or eChapter(s).
Editorial review has deemed that any suppressed content does not materially affect the overall learning experience. Cengage Learning reserves the right to remove additional content at any time if subsequent rights restrictions require it.

8.1 Population Mean: σ Known 309
construct the interval estimate, we obtain 82 ⫾ 3.92. Thus, the specific interval estimate of
μ based on the data from the most recent week is 82 ⫺ 3.92 ⫽ 78.08 to 82 ⫹ 3.92 ⫽ 85.92.
Because 95% of all the intervals constructed using ⫾ 3.92 will contain the population
mean, we say that we are 95% confident that the interval 78.08 to 85.92 includes the popu-
lation mean μ. We say that this interval has been established at the 95% confidence level.
The value .95 is referred to as the confidence coefficient, and the interval 78.08 to 85.92
is called the 95% confidence interval.
With the margin of error given by z
α/2
( ), the general form of an interval estimate
of a population mean for the σ known case follows.
σ兾
兹
n
x¯
Confidence Level αα/2 z
α/2
90% .10 .05 1.645
95% .05 .025 1.960
99% .01 .005 2.576
TABLE 8.1
VALUES OF z
α/2
FOR THE MOST COMMONLY USED CONFIDENCE LEVELS
This discussion provides
insight as to why the
interval is called a 95%
confidence interval.
INTERVAL ESTIMATE OF A POPULATION MEAN: σ KNOWN
(8.1)
where (1 ⫺ α) is the confidence coefficient and z
α/2
is the z value providing an area
of α/2 in the upper tail of the standard normal probability distribution.
x¯
⫾
z
α/2
σ
兹
n
Let us use expression (8.1) to construct a 95% confidence interval for the Lloyd’s ex-
ample. For a 95% confidence interval, the confidence coefficient is (1 ⫺ α) ⫽ .95 and thus,
α ⫽ .05. Using the standard normal probability table, an area of α/2 ⫽ .05/2 ⫽ .025 in the
upper tail provides z
.025
⫽ 1.96. With the Lloyd’s sample mean ⫽ 82, σ ⫽ 20, and a sam-
ple size n ⫽ 100, we obtain
Thus, using expression (8.1), the margin of error is 3.92 and the 95% confidence interval is
82 ⫺ 3.92 ⫽ 78.08 to 82 ⫹ 3.92 ⫽ 85.92.
Although a 95% confidence level is frequently used, other confidence levels such as
90% and 99% may be considered. Values of z
α/2
for the most commonly used confidence
levels are shown in Table 8.1. Using these values and expression (8.1), the 90% confidence
interval for the Lloyd’s example is
82
⫾
3.29
82
⫾
1.645
20
兹
100
82
⫾
3.92
82
⫾
1.96
20
兹
100
x¯
CH008.qxd 8/16/10 6:38 PM Page 309
Copyright 2010 Cengage Learning. All Rights Reserved. May not be copied, scanned, or duplicated, in whole or in part. Due to electronic rights, some third party content may be suppressed from the eBook and/or eChapter(s).
Editorial review has deemed that any suppressed content does not materially affect the overall learning experience. Cengage Learning reserves the right to remove additional content at any time if subsequent rights restrictions require it.

310 Chapter 8 Interval Estimation
Thus, at 90% confidence, the margin of error is 3.29 and the confidence interval is
82 ⫺ 3.29 ⫽ 78.71 to 82 ⫹ 3.29 ⫽ 85.29. Similarly, the 99% confidence interval is
Thus, at 99% confidence, the margin of error is 5.15 and the confidence interval is
82 ⫺ 5.15 ⫽ 76.85 to 82 ⫹ 5.15 ⫽ 87.15.
Comparing the results for the 90%, 95%, and 99% confidence levels, we see that in
order to have a higher degree of confidence, the margin of error and thus the width of the
confidence interval must be larger.
Practical Advice
If the population follows a normal distribution, the confidence interval provided by ex-
pression (8.1) is exact. In other words, if expression (8.1) were used repeatedly to generate
95% confidence intervals, exactly 95% of the intervals generated would contain the popu-
lation mean. If the population does not follow a normal distribution, the confidence inter-
val provided by expression (8.1) will be approximate. In this case, the quality of the
approximation depends on both the distribution of the population and the sample size.
In most applications, a sample size of n ⱖ 30 is adequate when using expression (8.1)
to develop an interval estimate of a population mean. If the population is not normally dis-
tributed but is roughly symmetric, sample sizes as small as 15 can be expected to provide
good approximate confidence intervals. With smaller sample sizes, expression (8.1) should
only be used if the analyst believes, or is willing to assume, that the population distribution
is at least approximately normal.
82
⫾
5.15
82
⫾
2.576
20
兹
100
NOTES AND COMMENTS
1. The interval estimation procedure discussed in
this section is based on the assumption that the
population standard deviation σ is known. By σ
known we mean that historical data or other in-
formation are available that permit us to obtain a
good estimate of the population standard devia-
tion prior to taking the sample that will be used
to develop an estimate of the population mean.
So technically we don’t mean that σ is actually
known with certainty. We just mean that we ob-
tained a good estimate of the standard deviation
prior to sampling and thus we won’t be using the
same sample to estimate both the population
mean and the population standard deviation.
2. The sample size nappears in the denominator of the
interval estimation expression (8.1). Thus, if a par-
ticular sample size provides too wide an interval to
be of any practical use, we may want to consider in-
creasing the sample size. With n in the denomina-
tor, a larger sample size will provide a smaller
margin of error, a narrower interval, and greater
precision. The procedure for determining the size
of a simple random sample necessary to obtain a
desired precision is discussed in Section 8.3.
Exercises
Methods
1. Asimple random sample of 40 items resulted in a sample mean of 25. The population stan-
dard deviation is σ ⫽ 5.
a. What is the standard error of the mean, ?
b. At 95% confidence, what is the margin of error?
σ
x
¯
CH008.qxd 8/16/10 6:38 PM Page 310
Copyright 2010 Cengage Learning. All Rights Reserved. May not be copied, scanned, or duplicated, in whole or in part. Due to electronic rights, some third party content may be suppressed from the eBook and/or eChapter(s).
Editorial review has deemed that any suppressed content does not materially affect the overall learning experience. Cengage Learning reserves the right to remove additional content at any time if subsequent rights restrictions require it.

8.1 Population Mean: σ Known 311
2. A simple random sample of 50 items from a population with σ ⫽ 6 resulted in a sample
mean of 32.
a. Provide a 90% confidence interval for the population mean.
b. Provide a 95% confidence interval for the population mean.
c. Provide a 99% confidence interval for the population mean.
3. A simple random sample of 60 items resulted in a sample mean of 80. The population
standard deviation is σ ⫽ 15.
a. Compute the 95% confidence interval for the population mean.
b. Assume that the same sample mean was obtained from a sample of 120 items. Provide
a 95% confidence interval for the population mean.
c. What is the effect of a larger sample size on the interval estimate?
4. A95% confidence interval for a population mean was reported to be 152 to 160. If σ ⫽ 15,
what sample size was used in this study?
Applications
5. In an effort to estimate the mean amount spent per customer for dinner at a major Atlanta
restaurant, data were collected for a sample of 49 customers. Assume a population stan-
dard deviation of $5.
a. At 95% confidence, what is the margin of error?
b. If the sample mean is $24.80, what is the 95% confidence interval for the population mean?
6. Nielsen Media Research conducted a study of household television viewing times during
the 8 p.m. to 11 p.m. time period. The data contained in the file named Nielsen are consis-
tent with the findings reported (The World Almanac, 2003). Based upon past studies, the
population standard deviation is assumed known with σ ⫽ 3.5 hours. Develop a 95% con-
fidence interval estimate of the mean television viewing time per week during the 8 p.m.
to 11 p.m. time period.
7. The Wall Street Journalreported that automobile crashes cost theUnited States $162 billion
annually (The Wall Street Journal, March 5, 2008). The average cost per person for crashes
in the Tampa, Florida, area was reported to be $1599. Suppose this average cost was based
ona sample of 50 personswhohadbeen involved in carcrashesandthat the population stan-
darddeviationis σ ⫽ $600. What is the margin of error for a 95% confidence interval? What
would you recommend if the study required a margin of error of $150 or less?
8. The National Quality Research Center at the University of Michigan provides a quar-
terly measure of consumer opinions about products and services (The Wall Street Journal,
February 18, 2003). A survey of 10 restaurants in the Fast Food/Pizza group showed a
sample mean customer satisfaction index of 71. Past data indicate that the population stan-
dard deviation of the index has been relatively stable with σ ⫽ 5.
a. What assumption should the researcher be willing to make if a margin of error is desired?
b. Using 95% confidence, what is the margin of error?
c. What is the margin of error if 99% confidence is desired?
9. AARPreported ona study conductedto learnhow long ittakes individuals toprepare theirfed-
eral income tax return (AARP Bulletin, April 2008). The data contained in the file named
TaxReturnareconsistentwiththestudyresults.Thesedataprovidethetimeinhoursrequiredfor
40 individuals to complete their federal income tax returns. Using past years’data, the popula-
tion standard deviation can be assumed known with σ ⫽ 9 hours. What is the 95% confidence
intervalestimateof the meantimeittakesan individual tocompleteafederalincometax return?
10. Playbill magazine reported that the mean annual household income of its readers is
$119,155 (Playbill, January 2006). Assume this estimate of the mean annual household in-
come is based on a sample of 80 households, and, based on past studies, the population
standard deviation is known to be σ ⫽ $30,000.
test
SELF
test
SELF
file
WEB
Nielsen
file
WEB
TaxReturn
CH008.qxd 8/16/10 6:38 PM Page 311
Copyright 2010 Cengage Learning. All Rights Reserved. May not be copied, scanned, or duplicated, in whole or in part. Due to electronic rights, some third party content may be suppressed from the eBook and/or eChapter(s).
Editorial review has deemed that any suppressed content does not materially affect the overall learning experience. Cengage Learning reserves the right to remove additional content at any time if subsequent rights restrictions require it.
a. Develop a 90% confidence interval estimate of the population mean.
b. Develop a 95% confidence interval estimate of the population mean.
c. Develop a 99% confidence interval estimate of the population mean.
d. Discuss what happens to the width of the confidence interval as the confidence level
is increased. Does this result seem reasonable? Explain.
8.2 Population Mean: σ Unknown
When developing an interval estimate of a population mean, we usually do not have a good
estimate of the population standard deviation either. In these cases, we must use the same
sample to estimate both μ and σ. This situation represents the σ unknown case. When s is
used to estimate σ, the margin of error and the interval estimate for the population mean are
based on a probability distribution known as the t distribution. Although the mathematical
development of the t distribution is based on the assumption of a normal distribution for the
population we are sampling from, research shows that the t distribution can be successfully
applied in many situations where the population deviates significantly from normal. Later
in this section we provide guidelines for using the t distribution if the population is not nor-
mally distributed.
The t distribution is a family of similar probability distributions, with a specific t dis-
tribution depending on a parameter known as the degrees of freedom. The t distribution
with one degree of freedom is unique, as is the t distribution with two degrees of free-
dom, with three degrees of freedom, and so on. As the number of degrees of freedom in-
creases, the difference between the t distribution and the standard normal distribution
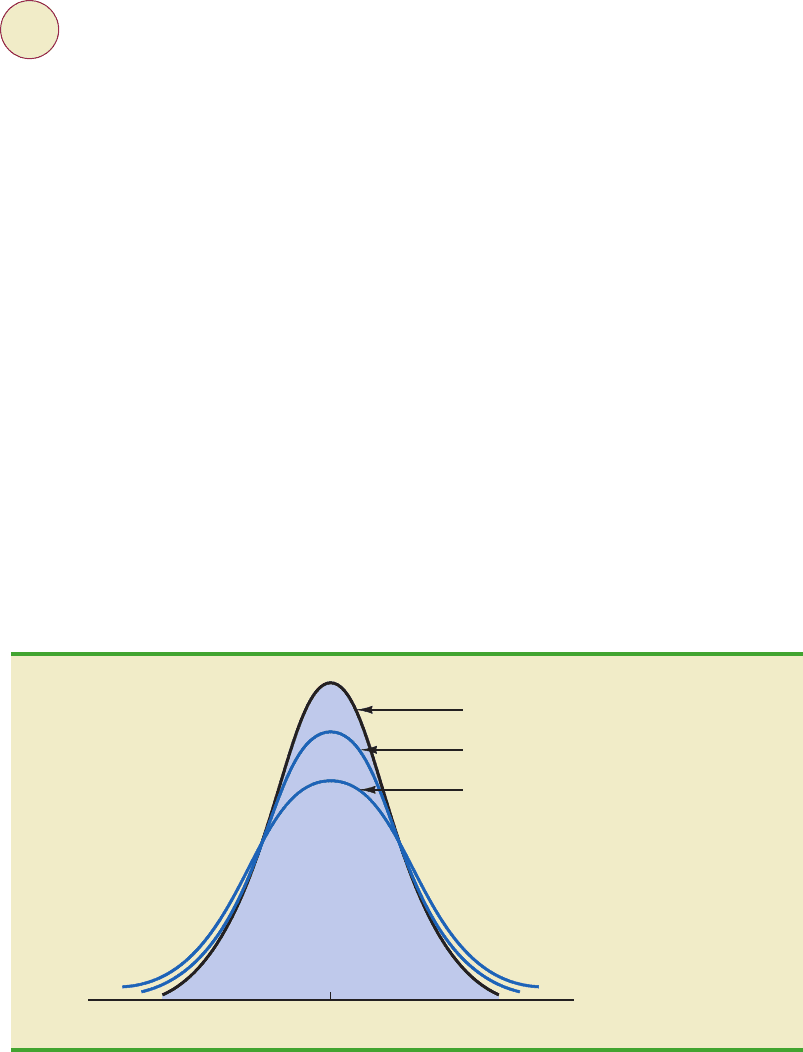
becomes smaller and smaller. Figure 8.4 shows t distributions with 10 and 20 degrees
of freedom and their relationship to the standard normal probability distribution. Note
that a t distribution with more degrees of freedom exhibits less variability and more
312 Chapter 8 Interval Estimation
William Sealy Gosset,
writing under the name
“Student,” is the founder of
the t distribution. Gosset,
an Oxford graduate in
mathematics, worked for
the Guinness Brewery in
Dublin, Ireland. He
developed the t distribution
while working on small-
scale materials and
temperature experiments.
0
z, t
Standard normal distribution
t distribution (20 degrees of freedom)
t distribution (10 degrees of freedom)
FIGURE 8.4 COMPARISON OF THE STANDARD NORMAL DISTRIBUTION
WITH t DISTRIBUTIONS HAVING 10 AND 20 DEGREES
OF FREEDOM
CH008.qxd 8/16/10 6:38 PM Page 312
Copyright 2010 Cengage Learning. All Rights Reserved. May not be copied, scanned, or duplicated, in whole or in part. Due to electronic rights, some third party content may be suppressed from the eBook and/or eChapter(s).
Editorial review has deemed that any suppressed content does not materially affect the overall learning experience. Cengage Learning reserves the right to remove additional content at any time if subsequent rights restrictions require it.
8.2 Population Mean: σ Unknown 313
t
α
/2
0
t
α
/2
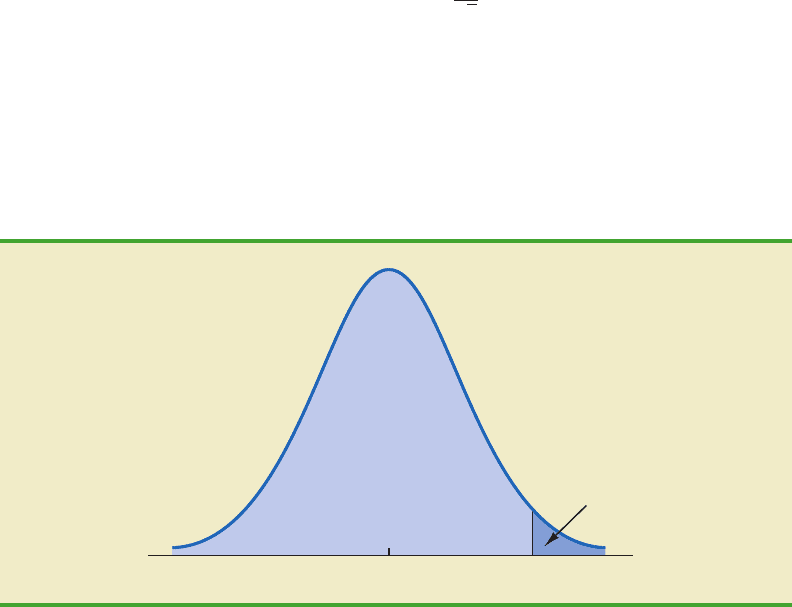
FIGURE 8.5 t DISTRIBUTION WITH α/2 AREA OR PROBABILITY IN THE UPPER TAIL
closely resembles the standard normal distribution. Note also that the mean of the t dis-
tribution is zero.
We place a subscript on t to indicate the area in the upper tail of the t distribution. For
example, just as we used z
.025
to indicate the z value providing a .025 area in the upper tail
of a standard normal distribution, we will use t
.025
to indicate a .025 area in the upper tail of
a t distribution. In general, we will use the notation t
α/2
to represent a t value with an area
of α/2 in the upper tail of the t distribution. See Figure 8.5.
Table 2 in Appendix B contains a table for the t distribution. A portion of this table is
shown in Table 8.2. Each row in the table corresponds to a separate t distribution with the
degrees of freedom shown. For example, for a t distribution with 9 degrees of freedom,
t
.025
⫽ 2.262. Similarly, for a t distribution with 60 degrees of freedom, t
.025
⫽ 2.000. As the
degrees of freedom continue to increase, t
.025
approaches z
.025
⫽ 1.96. In fact, the standard
normal distribution z values can be found in the infinite degrees of freedom row (labeled ⬁)
of the t distribution table. If the degrees of freedom exceed 100, the infinite degrees of free-
dom row can be used to approximate the actual t value; in other words, for more than 100
degrees of freedom, the standard normal z value provides a good approximation to the
t value.
Margin of Error and the Interval Estimate
In Section 8.1 we showed that an interval estimate of a population mean for the σ known
case is
To compute an interval estimate of μ for the σ unknown case, the sample standard devia-
tion s is used to estimate σ, and z
α/2
is replaced by the t distribution value t
α/2
. The margin
x¯
⫾
z
α/2
σ
兹
n
As the degrees of freedom
increase, the t distribution
approaches the standard
normal distribution.
CH008.qxd 8/16/10 6:38 PM Page 313
Copyright 2010 Cengage Learning. All Rights Reserved. May not be copied, scanned, or duplicated, in whole or in part. Due to electronic rights, some third party content may be suppressed from the eBook and/or eChapter(s).
Editorial review has deemed that any suppressed content does not materially affect the overall learning experience. Cengage Learning reserves the right to remove additional content at any time if subsequent rights restrictions require it.
314 Chapter 8 Interval Estimation
Degrees
Area in Upper Tail
of Freedom .20 .10 .05 .025 .01 .005
1 1.376 3.078 6.314 12.706 31.821 63.656
2 1.061 1.886 2.920 4.303 6.965 9.925
3 .978 1.638 2.353 3.182 4.541 5.841
4 .941 1.533 2.132 2.776 3.747 4.604
5 .920 1.476 2.015 2.571 3.365 4.032
6 .906 1.440 1.943 2.447 3.143 3.707
7 .896 1.415 1.895 2.365 2.998 3.499
8 .889 1.397 1.860 2.306 2.896 3.355
9 .883 1.383 1.833 2.262 2.821 3.250
60 .848 1.296 1.671 2.000 2.390 2.660
61 .848 1.296 1.670 2.000 2.389 2.659
62 .847 1.295 1.670 1.999 2.388 2.657
63 .847 1.295 1.669 1.998 2.387 2.656
64 .847 1.295 1.669 1.998 2.386 2.655
65 .847 1.295 1.669 1.997 2.385 2.654
66 .847 1.295 1.668 1.997 2.384 2.652
67 .847 1.294 1.668 1.996 2.383 2.651
68 .847 1.294 1.668 1.995 2.382 2.650
69 .847 1.294 1.667 1.995 2.382 2.649
90 .846 1.291 1.662 1.987 2.368 2.632
91 .846 1.291 1.662 1.986 2.368 2.631
92 .846 1.291 1.662 1.986 2.368 2.630
93 .846 1.291 1.661 1.986 2.367 2.630
94 .845 1.291 1.661 1.986 2.367 2.629
95 .845 1.291 1.661 1.985 2.366 2.629
96 .845 1.290 1.661 1.985 2.366 2.628
97 .845 1.290 1.661 1.985 2.365 2.627
98 .845 1.290 1.661 1.984 2.365 2.627
99 .845 1.290 1.660 1.984 2.364 2.626
100 .845 1.290 1.660 1.984 2.364 2.626
⬁ .842 1.282 1.645 1.960 2.326 2.576
TABLE 8.2
SELECTED VALUES FROM THE t DISTRIBUTION TABLE*
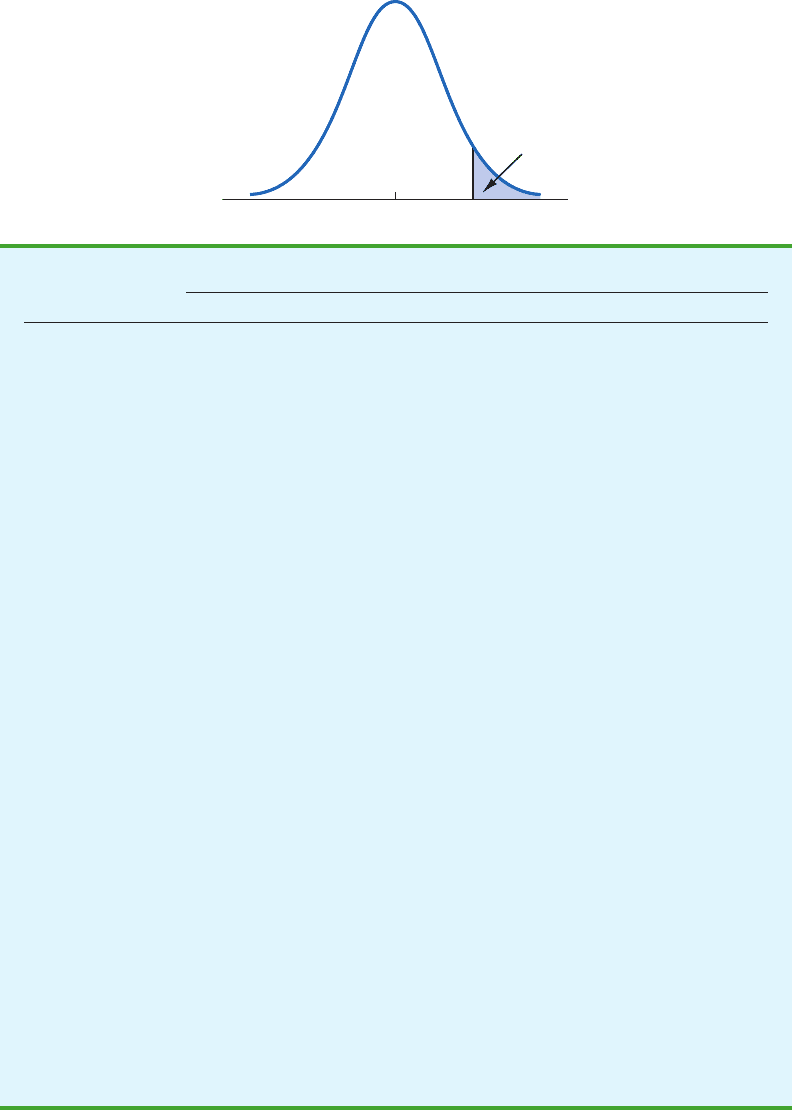
0
t
Area or
probability
*Note: A more extensive table is provided as Table 2 of Appendix B.
···
···
···
···
···
···
···
···
···
···
···
···
···
···
CH008.qxd 8/16/10 6:38 PM Page 314
Copyright 2010 Cengage Learning. All Rights Reserved. May not be copied, scanned, or duplicated, in whole or in part. Due to electronic rights, some third party content may be suppressed from the eBook and/or eChapter(s).
Editorial review has deemed that any suppressed content does not materially affect the overall learning experience. Cengage Learning reserves the right to remove additional content at any time if subsequent rights restrictions require it.