Anderson D.R., Sweeney D.J., Williams T.A. Essentials of Statistics for Business and Economics
Подождите немного. Документ загружается.


8.2 Population Mean: σ Unknown 315
of error is then given by t
α/2
. With this margin of error, the general expression for an
interval estimate of a population mean when σ is unknown follows.
s兾
兹
n
The reason the number of degrees of freedom associated with the t value in expression
(8.2) is n ⫺ 1 concerns the use of s as an estimate of the population standard deviation σ.
The expression for the sample standard deviation is
Degrees of freedom refer to the number of independent pieces of information that go into the
computation of 兺(x
i
⫺ )
2
. The n pieces of information involved in computing 兺(x
i
⫺ )
2
are as follows: x
1
⫺ , x
2
⫺ ,..., x
n
⫺ . In Section 3.2 we indicated that 兺(x
i
⫺ ) ⫽ 0
for any data set. Thus, only n ⫺ 1 of the x
i
⫺ values are independent; that is, if we know
n ⫺ 1 of the values, the remaining value can be determined exactly by using the condition
that the sum of the x
i
⫺ values must be 0. Thus, n ⫺ 1 is the number of degrees of freedom
associated with 兺(x
i
⫺ )
2
and hence the number of degrees of freedom for the t distribution
in expression (8.2).
To illustrate the interval estimation procedure for the σ unknown case, we will consider
a study designed to estimate the mean credit card debt for the population of U.S. households.
A sample of n ⫽ 70 households provided the credit card balances shown in Table 8.3. For
this situation, no previous estimate of the population standard deviation σ is available. Thus,
the sample data must be used to estimate both the population mean and the population stan-
dard deviation. Using the data in Table 8.3, we compute the sample mean ⫽ $9312 and the
sample standard deviation s ⫽ $4007. With 95% confidence and n ⫺ 1 ⫽ 69 degrees of
x¯
x¯
x¯
x¯
x¯x¯x¯x¯
x¯x¯
s ⫽
冑
兺(x
i
⫺ x¯)
2
n ⫺ 1
INTERVAL ESTIMATE OF A POPULATION MEAN: σ UNKNOWN
(8.2)
where s is the sample standard deviation, (1 ⫺ α) is the confidence coefficient, and
t
α/2
is the t value providing an area of α/2 in the upper tail of the t distribution with
n ⫺ 1 degrees of freedom.
x¯
⫾
t
α/2
s
兹
n
TABLE 8.3 CREDIT CARD BALANCES FOR A SAMPLE OF 70 HOUSEHOLDS ($)
9430
7535
4078
5604
5179
4416
10676
1627
10112
6567
13627
18719
14661
12195
10544
13659
7061
6245
13021
9719
2200
10746
12744
5742
7159
8137
9467
12595
7917
11346
12806
4972
11356
7117
9465
19263
9071
3603
16804
13479
14044
6817
6845
10493
615
13627
12557
6232
9691
11448
8279
5649
11298
4353
3467
6191
12851
5337
8372
7445
11032
6525
5239
6195
12584
15415
15917
12591
9743
10324
file
W
EB
NewBalance
CH008.qxd 8/16/10 6:38 PM Page 315
Copyright 2010 Cengage Learning. All Rights Reserved. May not be copied, scanned, or duplicated, in whole or in part. Due to electronic rights, some third party content may be suppressed from the eBook and/or eChapter(s).
Editorial review has deemed that any suppressed content does not materially affect the overall learning experience. Cengage Learning reserves the right to remove additional content at any time if subsequent rights restrictions require it.

316 Chapter 8 Interval Estimation
freedom, Table 8.2 can be used to obtain the appropriate value for t
.025
. We want the tvalue
in the row with 69 degrees of freedom, and the column corresponding to .025 in the upper
tail. The value shown is t
.025
⫽ 1.995.
We use expression (8.2) to compute an interval estimate of the population mean credit
card balance.
The point estimate of the population mean is $9312, the margin of error is $955, and the
95% confidence interval is 9312 ⫺ 955 ⫽ $8357 to 9312 ⫹ 955 ⫽ $10,267. Thus, we are
95% confident that the mean credit card balance for the population of all households is
between $8357 and $10,267.
The procedures used by Minitab, Excel, and StatTools to develop confidence intervals
for a population mean are described in Appendixes 8.1, 8.2, and 8.3. For the household
credit card balances study, the results of the Minitab interval estimation procedure are
shown in Figure 8.6. The sample of 70 households provides a sample mean credit card bal-
ance of $9312, a sample standard deviation of $4007, a standard error of the mean of $479,
and a 95% confidence interval of $8357 to $10,267.
Practical Advice
If the population follows a normal distribution, the confidence interval provided by ex-
pression (8.2) is exact and can be used for any sample size. If the population does not fol-
low a normal distribution, the confidence interval provided by expression (8.2) will be
approximate. In this case, the quality of the approximation depends on both the distribution
of the population and the sample size.
In most applications, a sample size of n ⱖ 30 is adequate when using expression (8.2)
to develop an interval estimate of a population mean. However, if the population distribu-
tion is highly skewed or contains outliers, most statisticians would recommend increasing
the sample size to 50 or more. If the population is not normally distributed but is roughly
symmetric, sample sizes as small as 15 can be expected to provide good approximate con-
fidence intervals. With smaller sample sizes, expression (8.2) should be used only if the
analyst believes, or is willing to assume, that the population distribution is at least approxi-
mately normal.
Using a Small Sample
In the following example we develop an interval estimate for a population mean when the
sample size is small. As we already noted, an understanding of the distribution of the popu-
lation becomes a factor in deciding whether the interval estimation procedure provides
acceptable results.
Scheer Industries is considering a new computer-assisted program to train maintenance
employees to do machine repairs. In order to fully evaluate the program, the director of
9312
⫾
955
9312
⫾
1.995
4007
兹
70
Larger sample sizes are
needed if the distribution of
the population is highly
skewed or includes outliers.
Variable N Mean StDev SE Mean 95% CI
NewBalance 70 9312 4007 479 (8357, 10267)
FIGURE 8.6 MINITAB CONFIDENCE INTERVALFOR THE CREDITCARD BALANCE SURVEY
CH008.qxd 8/16/10 6:38 PM Page 316
Copyright 2010 Cengage Learning. All Rights Reserved. May not be copied, scanned, or duplicated, in whole or in part. Due to electronic rights, some third party content may be suppressed from the eBook and/or eChapter(s).
Editorial review has deemed that any suppressed content does not materially affect the overall learning experience. Cengage Learning reserves the right to remove additional content at any time if subsequent rights restrictions require it.
8.2 Population Mean: σ Unknown 317
manufacturing requested an estimate of the population mean time required for maintenance
employees to complete the computer-assisted training.
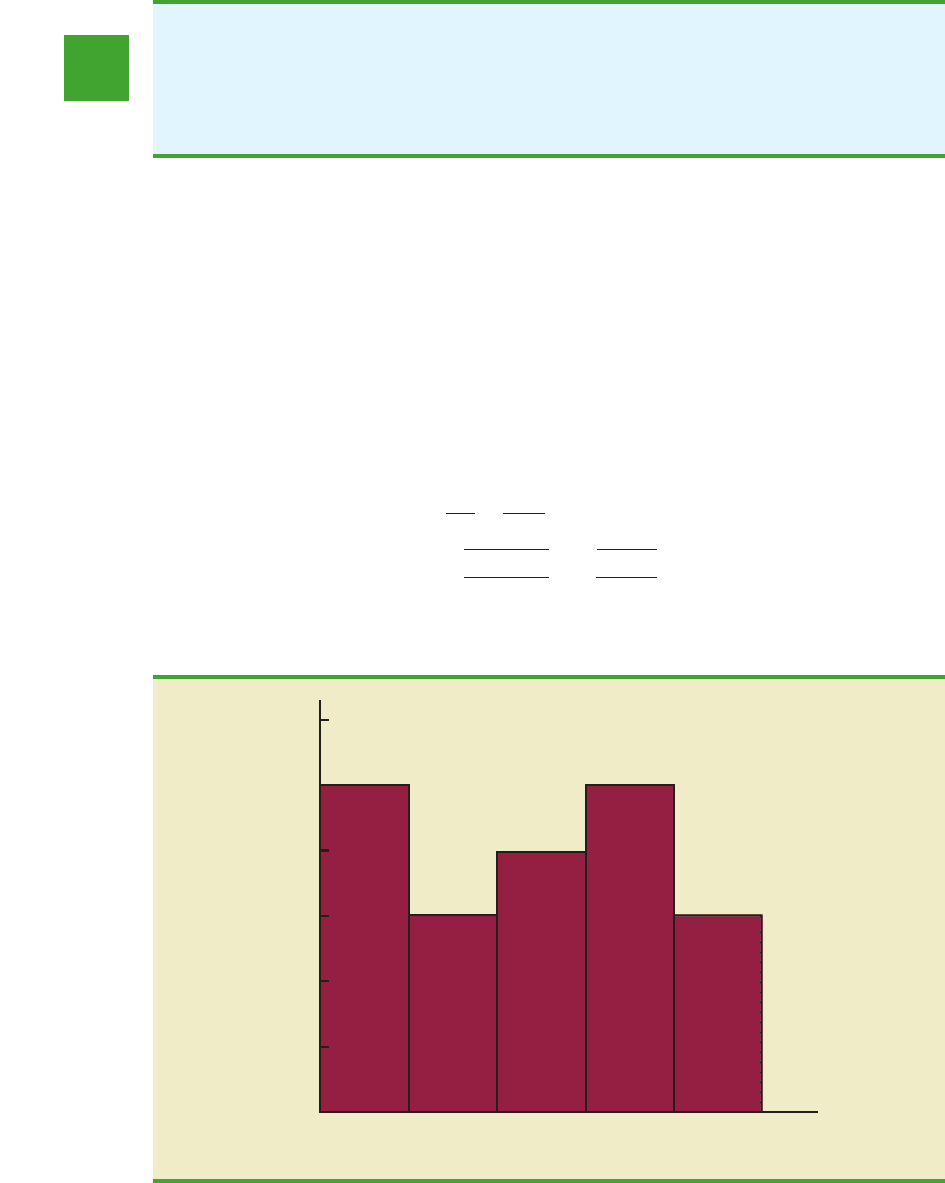
A sample of 20 employees is selected, with each employee in the sample completing
the training program. Data on the training time in days for the 20 employees are shown in
Table 8.4. Ahistogram of the sample data appears in Figure 8.7. What can we say about the
distribution of the population based on this histogram? First, the sample data do not sup-
port the conclusion that the distribution of the population is normal, yet we do not see any
evidence of skewness or outliers. Therefore, using the guidelines in the previous subsection,
we conclude that an interval estimate based on the t distribution appears acceptable for the
sample of 20 employees.
We continue by computing the sample mean and sample standard deviation as follows.
s ⫽
冑
兺(x
i
⫺ x¯)
2
n ⫺ 1
⫽
冑
889
20 ⫺ 1
⫽ 6.84 days
x¯ ⫽
兺x
i
n
⫽
1030
20
⫽ 51.5 days
52 59 54 42
44 50 42 48
55 54 60 55
44 62 62 57
45 46 43 56
TABLE 8.4
TRAINING TIME IN DAYS FOR A SAMPLE OF 20 SCHEER
INDUSTRIES EMPLOYEES
5
4
3
2
1
0
Frequency
Training Time (days)
40
45 50 55 60 65
6
FIGURE 8.7 HISTOGRAM OF TRAINING TIMES FOR THE SCHEER INDUSTRIES SAMPLE
file
WEB
Scheer
CH008.qxd 8/16/10 6:38 PM Page 317
Copyright 2010 Cengage Learning. All Rights Reserved. May not be copied, scanned, or duplicated, in whole or in part. Due to electronic rights, some third party content may be suppressed from the eBook and/or eChapter(s).
Editorial review has deemed that any suppressed content does not materially affect the overall learning experience. Cengage Learning reserves the right to remove additional content at any time if subsequent rights restrictions require it.
318 Chapter 8 Interval Estimation
For a 95% confidence interval, we use Table 2 of Appendix B and n ⫺ 1 ⫽ 19 degrees of
freedom to obtain t
.025
⫽ 2.093. Expression (8.2) provides the interval estimate of the pop-
ulation mean.
The point estimate of the population mean is 51.5 days. The margin of error is 3.2 days and
the 95% confidence interval is 51.5 ⫺ 3.2 ⫽ 48.3 days to 51.5 ⫹ 3.2 ⫽ 54.7 days.
Using a histogram of the sample data to learn about the distribution of a population is
not always conclusive, but in many cases it provides the only information available. The
histogram, along with judgment on the part of the analyst, can often be used to decide
whether expression (8.2) can be used to develop the interval estimate.
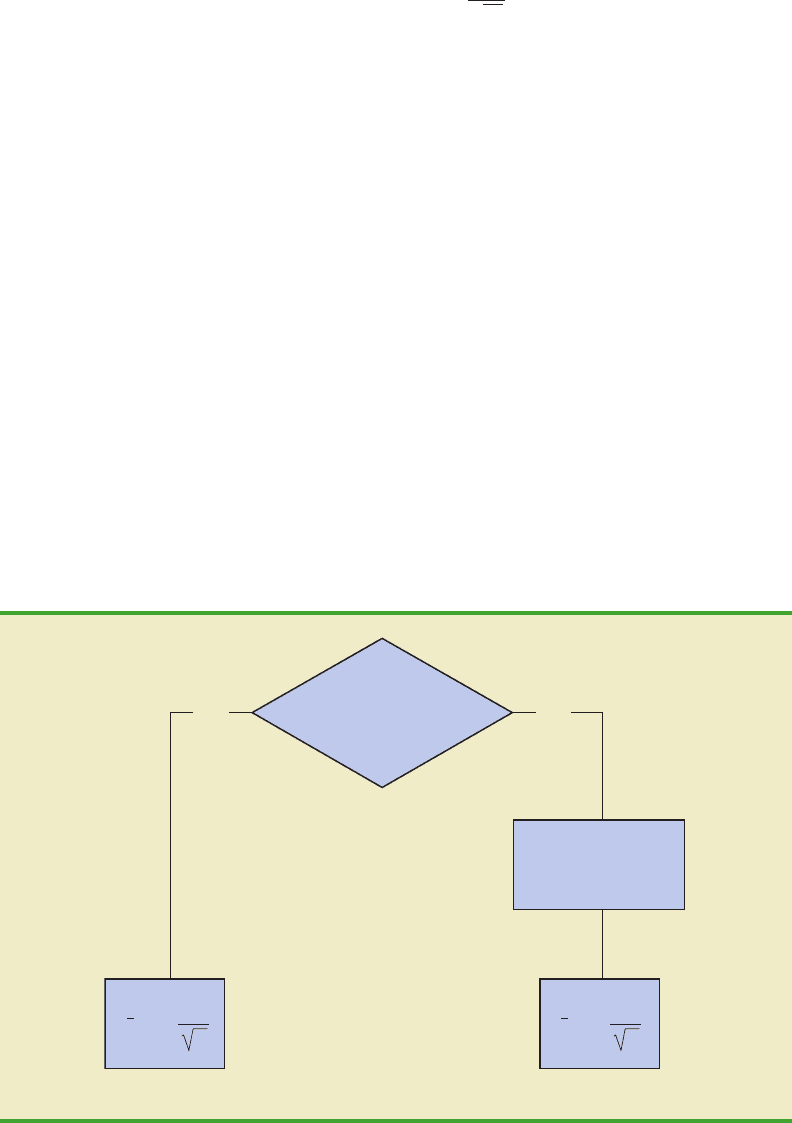
Summary of Interval Estimation Procedures
We provided two approaches to developing an interval estimate of a population mean. For
the σ known case, σ and the standard normal distribution are used in expression (8.1) to
compute the margin of error and to develop the interval estimate. For the σ unknown case,
the sample standard deviation s and the t distribution are used in expression (8.2) to com-
pute the margin of error and to develop the interval estimate.
A summary of the interval estimation procedures for the two cases is shown in
Figure 8.8. In most applications, a sample size of n ⱖ 30 is adequate. If the population has
a normal or approximately normal distribution, however, smaller sample sizes may be used.
51.5
⫾
3.2
51.5
⫾
2.093
冢
6.84
兹
20
冣
Can the population
standard deviation
be assumed known?
Use the sample
standard deviation
s to estimate
Use
±
n
x
z
α
/2
Use
±
n
x
t
s
α
/2
Yes No
σ
σ
σ
σ
σ
Known Case
σ
Unknown Case
FIGURE 8.8 SUMMARY OF INTERVAL ESTIMATION PROCEDURES
FOR A POPULATION MEAN
CH008.qxd 8/16/10 6:38 PM Page 318
Copyright 2010 Cengage Learning. All Rights Reserved. May not be copied, scanned, or duplicated, in whole or in part. Due to electronic rights, some third party content may be suppressed from the eBook and/or eChapter(s).
Editorial review has deemed that any suppressed content does not materially affect the overall learning experience. Cengage Learning reserves the right to remove additional content at any time if subsequent rights restrictions require it.

8.2 Population Mean: σ Unknown 319
test
SELF
Exercises
Methods
11. For a t distribution with 16 degrees of freedom, find the area, or probability, in each region.
a. To the right of 2.120
b. To the left of 1.337
c. To the left of ⫺1.746
d. To the right of 2.583
e. Between ⫺2.120 and 2.120
f. Between ⫺1.746 and 1.746
12. Find the t value(s) for each of the following cases.
a. Upper tail area of .025 with 12 degrees of freedom
b. Lower tail area of .05 with 50 degrees of freedom
c. Upper tail area of .01 with 30 degrees of freedom
d. Where 90% of the area falls between these two t values with 25 degrees of freedom
e. Where 95% of the area falls between these two t values with 45 degrees of freedom
13. The following sample data are from a normal population: 10, 8, 12, 15, 13, 11, 6, 5.
a. What is the point estimate of the population mean?
b. What is the point estimate of the population standard deviation?
c. With 95% confidence, what is the margin of error for the estimation of the population
mean?
d. What is the 95% confidence interval for the population mean?
14. A simple random sample with n ⫽ 54 provided a sample mean of 22.5 and a sample stan-
dard deviation of 4.4.
a. Develop a 90% confidence interval for the population mean.
b. Develop a 95% confidence interval for the population mean.
For the σ unknown case, a sample size of n ⱖ 50 is recommended if the population dis-
tribution is believed to be highly skewed or has outliers.
NOTES AND COMMENTS
1. When σ is known, the margin of error, z
α/2
(),
is fixed and is the same for all samples of
size n. When σ is unknown, the margin of error,
t
α/2
( ), varies from sample to sample. This
variation occurs because the sample standard
deviation s varies depending upon the sample
selected. A large value for s provides a larger
margin of error, while a small value for s pro-
vides a smaller margin of error.
2. What happens to confidence interval estimates
when the population is skewed? Consider a
population that is skewed to the right with large
data values stretching the distribution to the
right. When such skewness exists, the sample
mean and the sample standard deviation s are
positively correlated. Larger values of s tend to
x¯
s兾
兹
n
σ兾
兹
n
be associated with larger values of . Thus,
when is larger than the population mean, s
tends to be larger than σ. This skewness causes
the margin of error, t
α/2
( ), to be larger than
it would be with σ known. The confidence in-
terval with the larger margin of error tends to
include the population mean μ more often than
it would if the true value of σ were used. But
when is smaller than the population mean, the
correlation between and s causes the margin
of error to be small. In this case, the confidence
interval with the smaller margin of error tends
to miss the population mean more than it would
if we knew σ and used it. For this reason, we
recommend using larger sample sizes with
highly skewed population distributions.
x¯
x¯
s兾
兹
n
x¯
x¯
CH008.qxd 8/16/10 6:38 PM Page 319
Copyright 2010 Cengage Learning. All Rights Reserved. May not be copied, scanned, or duplicated, in whole or in part. Due to electronic rights, some third party content may be suppressed from the eBook and/or eChapter(s).
Editorial review has deemed that any suppressed content does not materially affect the overall learning experience. Cengage Learning reserves the right to remove additional content at any time if subsequent rights restrictions require it.

320 Chapter 8 Interval Estimation
c. Develop a 99% confidence interval for the population mean.
d. What happens to the margin of error and the confidence interval as the confidence
level is increased?
Applications
15. Sales personnel for Skillings Distributors submit weekly reports listing the customer con-
tacts made during the week. Asample of 65 weekly reports showed a sample mean of 19.5
customer contacts per week. The sample standard deviation was 5.2. Provide 90% and 95%
confidence intervals for the population mean number of weekly customer contacts for the
sales personnel.
16. The mean number of hours of flying time for pilots at Continental Airlines is 49 hours per
month (The Wall Street Journal, February 25, 2003). Assume that this mean was based on
actual flying times for a sample of 100 Continental pilots and that the sample standard
deviation was 8.5 hours.
a. At 95% confidence, what is the margin of error?
b. What is the 95% confidence interval estimate of the population mean flying time for
the pilots?
c. The mean number of hours of flying time for pilots at United Airlines is 36 hours
per month. Use your results from part (b) to discuss differences between the flying
times for the pilots at the two airlines. The Wall Street Journal reported United Air-
lines as having the highest labor cost among all airlines. Does the information in
this exercise provide insight as to why United Airlines might expect higher labor
costs?
17. The International Air Transport Association surveys business travelers to develop quality
ratings for transatlantic gateway airports. The maximum possible rating is 10. Suppose a
simple random sample of 50 business travelers is selected and each traveler is asked to pro-
vide a rating for the Miami International Airport. The ratings obtained from the sample of
50 business travelers follow.
6 4 6 8 7 7 6 3 3 8 10 4 8
7 8 7 5 9 5 8 4 3 8 5 5 4
4 4 8 4 5 6 2 5 9 9 8 4 8
9 9 5 9 7 8 3 10 8 9 6
Develop a 95% confidence interval estimate of the population mean rating for Miami.
18. Older people often have a hard time finding work. AARPreported on the number of weeks
it takes a worker aged 55 plus to find a job. The data on number of weeks spent searching
for a job contained in the file JobSearch are consistent with the AARP findings (AARP
Bulletin, April 2008).
a. Provide a point estimate of the population mean number of weeks it takes a worker aged
55 plus to find a job.
b. At 95% confidence, what is the margin of error?
c. What is the 95% confidence interval estimate of the mean?
d. Discuss the degree of skewness found in the sample data. What suggestion would you
make for a repeat of this study?
19. The average cost per night of a hotel room in New York City is $273(SmartMoney, March
2009).Assumethis estimate is based on a sample of 45 hotels and that the sample standard
deviation is $65.
a. With 95% confidence, what is the margin of error?
b. What is the 95% confidence interval estimate of the population mean?
c. Two years ago the average cost of a hotel room in New York City was $229. Discuss
the change in cost over the two-year period.
test
SELF
file
WEB
Miami
file
WEB
JobSearch
CH008.qxd 8/16/10 6:38 PM Page 320
Copyright 2010 Cengage Learning. All Rights Reserved. May not be copied, scanned, or duplicated, in whole or in part. Due to electronic rights, some third party content may be suppressed from the eBook and/or eChapter(s).
Editorial review has deemed that any suppressed content does not materially affect the overall learning experience. Cengage Learning reserves the right to remove additional content at any time if subsequent rights restrictions require it.

8.3 Determining the Sample Size 321
20. Is your favorite TV program often interrupted by advertising? CNBC presented statistics
on the average number of programming minutes in a half-hour sitcom (CNBC, February
23, 2006). The following data (in minutes) are representative of its findings.
21.06 22.24 20.62
21.66 21.23 23.86
23.82 20.30 21.52
21.52 21.91 23.14
20.02 22.20 21.20
22.37 22.19 22.34
23.36 23.44
Assume the population is approximately normal. Provide a point estimate and a 95% con-
fidence interval for the mean number of programming minutes during a half-hour televi-
sion sitcom.
21. Consumption of alcoholic beverages by young women of drinking age has been increas-
ing in the United Kingdom, the United States, and Europe (The Wall Street Journal, Feb-
ruary 15, 2006). Data (annual consumption in liters) consistent with the findings reported
in The Wall Street Journal article are shown for a sample of 20 European young women.
266 82 199 174 97
170 222 115 130 169
164 102 113 171 0
93 0 93 110 130
Assuming the population is roughly symmetric, construct a 95% confidence interval for
the mean annual consumption of alcoholic beverages by European young women.
22. Disney’s Hannah Montana: The Movie opened on Easter weekend in April 2009. Over the
three-day weekend, the movie became the number-one box office attraction (The Wall
Street Journal, April 13, 2009). The ticket sales revenue in dollars for a sample of 25
theaters is as follows.
20,200 10,150 13,000 11,320 9,700
8,350 7,300 14,000 9,940 11,200
10,750 6,240 12,700 7,430 13,500
13,900 4,200 6,750 6,700 9,330
13,185 9,200 21,400 11,380 10,800
a. What is the 95% confidence interval estimate for the mean ticket sales revenue per
theater? Interpret this result.
b. Using the movie ticket price of $7.16 per ticket, what is the estimate of the mean num-
ber of customers per theater?
c. The movie was shown in 3118 theaters. Estimate the total number of customers who
saw Hannah Montana: The Movie and the total box office ticket sales for the three-
day weekend.
8.3 Determining the Sample Size
In providing practical advice in the two preceding sections, we commented on the role of
the sample size in providing good approximate confidence intervals when the population is
not normally distributed. In this section, we focus on another aspect of the sample size issue.
We describe how to choose a sample size large enough to provide a desired margin of error.
To understand how this process works, we return to the σ known case presented in Section
8.1. Using expression (8.1), the interval estimate is
x¯
⫾
z
α/2
σ
兹
n
If a desired margin of error
is selected prior to
sampling, the procedures in
this section can be used to
determine the sample size
necessary to satisfy the
margin of error
requirement.
file
WEB
Program
file
WEB
Alcohol
file
WEB
TicketSales
CH008.qxd 8/16/10 6:38 PM Page 321
Copyright 2010 Cengage Learning. All Rights Reserved. May not be copied, scanned, or duplicated, in whole or in part. Due to electronic rights, some third party content may be suppressed from the eBook and/or eChapter(s).
Editorial review has deemed that any suppressed content does not materially affect the overall learning experience. Cengage Learning reserves the right to remove additional content at any time if subsequent rights restrictions require it.

The quantity z
α/2
( ) is the margin of error. Thus, we see that z
α/2
, the population stan-
dard deviation σ, and the sample size n combine to determine the margin of error. Once we
select a confidence coefficient, 1 ⫺ α, z
α/2
can be determined. Then, if we have a value for
σ, we can determine the sample size n needed to provide any desired margin of error.
Development of the formula used to compute the required sample size n follows.
Let E ⫽ the desired margin of error:
Solving for , we have
Squaring both sides ofthis equation,we obtainthe following expression for thesample size.
兹
n ⫽
z
α/2
σ
E
兹
n
E ⫽ z
α/2
σ
兹
n
σ兾
兹
n
322 Chapter 8 Interval Estimation
This sample size provides the desired margin of error at the chosen confidence level.
In equation (8.3), E is the margin of error that the user is willing to accept, and the value
of z
α/2
follows directly from the confidence level to be used in developing the interval esti-
mate. Although user preference must be considered, 95% confidence is the most frequently
chosen value (z
.025
⫽ 1.96).
Finally, use of equation (8.3) requires a value for the population standard deviation σ.
However, even if σ is unknown, we can use equation (8.3) provided we have a preliminary
or planning value for σ. In practice, one of the following procedures can be chosen.
1. Use the estimate of the population standard deviation computed from data of previ-
ous studies as the planning value for σ.
2. Use a pilot study to select a preliminary sample. The sample standard deviation from
the preliminary sample can be used as the planning value for σ.
3. Use judgment or a “best guess” for the value of σ. For example, we might begin by
estimating the largest and smallest data values in the population. The difference be-
tween the largest and smallest values provides an estimate of the range for the data.
Finally, the range divided by 4 is often suggested as a rough approximation of the
standard deviation and thus an acceptable planning value for σ.
Let us demonstrate the use of equation (8.3) to determine the sample size by consider-
ing the following example. A previous study that investigated the cost of renting automo-
biles in the United States found a mean cost of approximately $55 per day for renting a
midsize automobile. Suppose that the organization that conducted this study would like to
conduct a new study in order to estimate the population mean daily rental cost for a midsize
automobile in the United States. In designing the new study, the project director specifies
that the population mean daily rental cost be estimated with a margin of error of $2 and a
95% level of confidence.
The project director specified a desired margin of error of E ⫽ 2, and the 95% level of
confidence indicates z
.025
⫽ 1.96. Thus, we need only a planning value for the population
standard deviation σ in order to compute the required sample size.At this point, an analyst
reviewed thesample data fromthe previous studyand found that the sample standard devia-
tion for the daily rental cost was $9.65. Using 9.65 as the planning value for σ, we obtain
SAMPLE SIZE FOR AN INTERVAL ESTIMATE OF A POPULATION MEAN
(8.3)
n ⫽
(z
α/2
)
2
σ
2
E
2
Equation (8.3) can be used
to provide a good sample
size recommendation.
However, judgment on the
part of the analyst should
be used to determine
whether the final sample
size should be adjusted
upward.
A planning value for the
population standard
deviation σ must be
specified before the sample
size can be determined.
Three methods of obtaining
a planning value for σ are
discussed here.
CH008.qxd 8/16/10 6:38 PM Page 322
Copyright 2010 Cengage Learning. All Rights Reserved. May not be copied, scanned, or duplicated, in whole or in part. Due to electronic rights, some third party content may be suppressed from the eBook and/or eChapter(s).
Editorial review has deemed that any suppressed content does not materially affect the overall learning experience. Cengage Learning reserves the right to remove additional content at any time if subsequent rights restrictions require it.

8.3 Determining the Sample Size 323
Thus, the sample size for the new study needs to be at least 89.43 midsize automobile rentals
in order to satisfy the project director’s $2 margin-of-error requirement. In cases where the
computed n is not an integer, we round up to the next integer value; hence, the recom-
mended sample size is 90 midsize automobile rentals.
Exercises
Methods
23. How large a sample should be selected to provide a 95% confidence interval with a mar-
gin of error of 10? Assume that the population standard deviation is 40.
24. The range for a set of data is estimated to be 36.
a. What is the planning value for the population standard deviation?
b. At 95% confidence, how large a sample would provide a margin of error of 3?
c. At 95% confidence, how large a sample would provide a margin of error of 2?
Applications
25. Refer to the Scheer Industries example in Section 8.2. Use 6.84 days as a planning value
for the population standard deviation.
a. Assuming 95% confidence, what sample size would be required to obtain a margin of
error of 1.5 days?
b. If the precision statement was made with 90% confidence, what sample size would be
required to obtain a margin of error of 2 days?
26. The average cost of a gallon of unleaded gasoline in Greater Cincinnati was reported to be
$2.41 (The Cincinnati Enquirer, February 3, 2006). During periods of rapidly changing
prices, the newspaper samples service stations and prepares reports on gasoline prices fre-
quently. Assume the standard deviation is $.15 for the price of a gallon of unleaded regu-
lar gasoline, and recommend the appropriate sample size for the newspaper to use if it
wishes to report a margin of error at 95% confidence.
a. Suppose the desired margin of error is $.07.
b. Suppose the desired margin of error is $.05.
c. Suppose the desired margin of error is $.03.
27. Annual starting salaries for college graduates with degrees in business administration are
generally expected to be between $30,000 and $45,000. Assume that a 95% confidence in-
terval estimate of the population mean annual starting salary is desired. What is the plan-
ning value for the population standard deviation? How large a sample should be taken if
the desired margin of error is
a. $500?
b. $200?
c. $100?
d. Would you recommend trying to obtain the $100 margin of error? Explain.
28. An online survey by ShareBuilder, a retirement plan provider, and Harris Interactive re-
ported that 60% of female business owners are not confident they are saving enough for
retirement (SmallBiz, Winter 2006). Suppose we would like to do a follow-up study to de-
termine how much female business owners are saving each year toward retirement and
want to use $100 as the desired margin of error for an interval estimate of the population
mean. Use $1100 as a planning value for the standard deviation and recommend a sample
size for each of the following situations.
a. A 90% confidence interval is desired for the mean amount saved.
b. A 95% confidence interval is desired for the mean amount saved.
n ⫽
(z
α/2
)
2
σ
2
E
2
⫽
(1.96)
2
(9.65)
2
2
2
⫽ 89.43
Equation (8.3) provides the
minimum sample size
needed to satisfy the
desired margin of error
requirement. If the
computed sample size is not
an integer, rounding up to
the next integer value will
provide a margin of error
slightly smaller than
required.
test
SELF
test
SELF
CH008.qxd 8/16/10 6:38 PM Page 323
Copyright 2010 Cengage Learning. All Rights Reserved. May not be copied, scanned, or duplicated, in whole or in part. Due to electronic rights, some third party content may be suppressed from the eBook and/or eChapter(s).
Editorial review has deemed that any suppressed content does not materially affect the overall learning experience. Cengage Learning reserves the right to remove additional content at any time if subsequent rights restrictions require it.
324 Chapter 8 Interval Estimation
c. A 99% confidence interval is desired for the mean amount saved.
d. When the desired margin of error is set, what happens to the sample size as the confi-
dence level is increased? Would you recommend using a 99% confidence interval in
this case? Discuss.
29. The travel-to-work time for residents of the 15 largest cities in the United States is reported
in the 2003 Information Please Almanac. Suppose that a preliminary simple random
sample of residents of San Francisco is used to develop a planning value of 6.25 minutes
for the population standard deviation.
a. If we want to estimate the population mean travel-to-work time for San Francisco resi-
dents with a margin of error of 2 minutes, what sample size should be used? Assume
95% confidence.
b. If we want to estimate the population mean travel-to-work time for San Francisco resi-
dents with a margin of error of 1 minute, what sample size should be used? Assume
95% confidence.
30. During the first quarter of 2003, the price/earnings (
P/E) ratio for stocks listed on the New
York Stock Exchange generally ranged from 5 to 60 (The Wall Street Journal, March 7,
2003). Assume that we want to estimate the population mean
P/E ratio for all stocks listed
on the exchange. How many stocks should be included in the sample if we want a margin
of error of 3? Use 95% confidence.
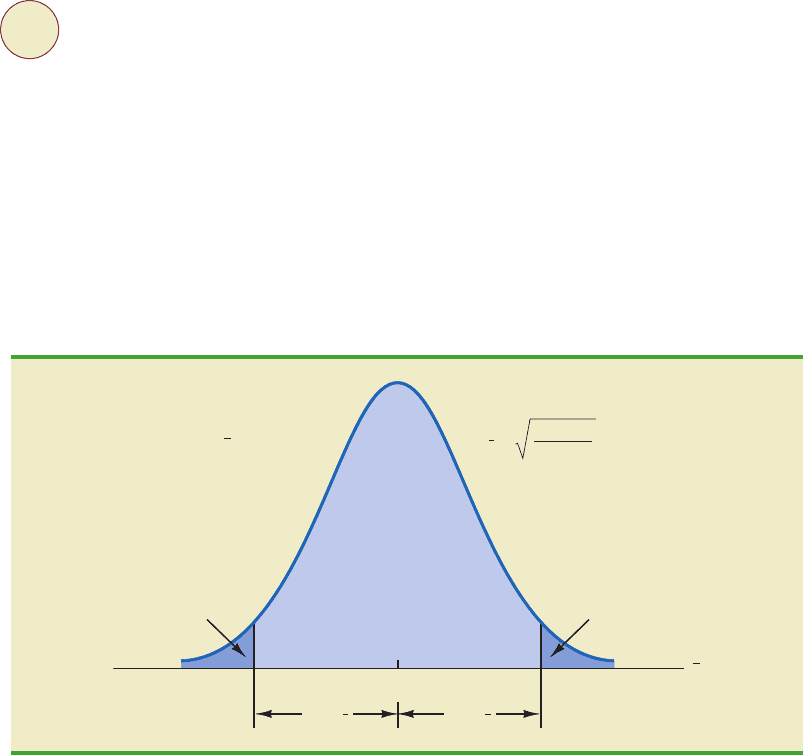
8.4 Population Proportion
In the introduction to this chapter we said that the general form of an interval estimate of a
population proportion p is
The sampling distribution of plays a key role in computing the margin of error for this in-
terval estimate.
In Chapter 7 we said that the sampling distribution of can be approximated by a normal
distribution whenever np ⱖ 5 and n(1 ⫺ p) ⱖ 5. Figure 8.9 shows the normal approximation
p¯
p¯
p¯
⫾
Margin of error
p
Sampling distribution
of p
p
σ
p
=
p(1 – p)
n
α
/2
z
α
/2
α
/2
σ
p
z
α
/2
σ
p
FIGURE 8.9 NORMALAPPROXIMATION OF THE SAMPLING DISTRIBUTION OF p¯
CH008.qxd 8/16/10 6:38 PM Page 324
Copyright 2010 Cengage Learning. All Rights Reserved. May not be copied, scanned, or duplicated, in whole or in part. Due to electronic rights, some third party content may be suppressed from the eBook and/or eChapter(s).
Editorial review has deemed that any suppressed content does not materially affect the overall learning experience. Cengage Learning reserves the right to remove additional content at any time if subsequent rights restrictions require it.