API RP 2A-WSD-2007 Recommended Practice for Planning, Designing and Constructing Fixed Offshore Platforms-Working Stress Design
Подождите немного. Документ загружается.

RECOMMENDED PRACTICE FOR PLANNING, DESIGNING AND CONSTRUCTING FIXED OFFSHORE PLATFORMS—WORKING STRESS DESIGN 209
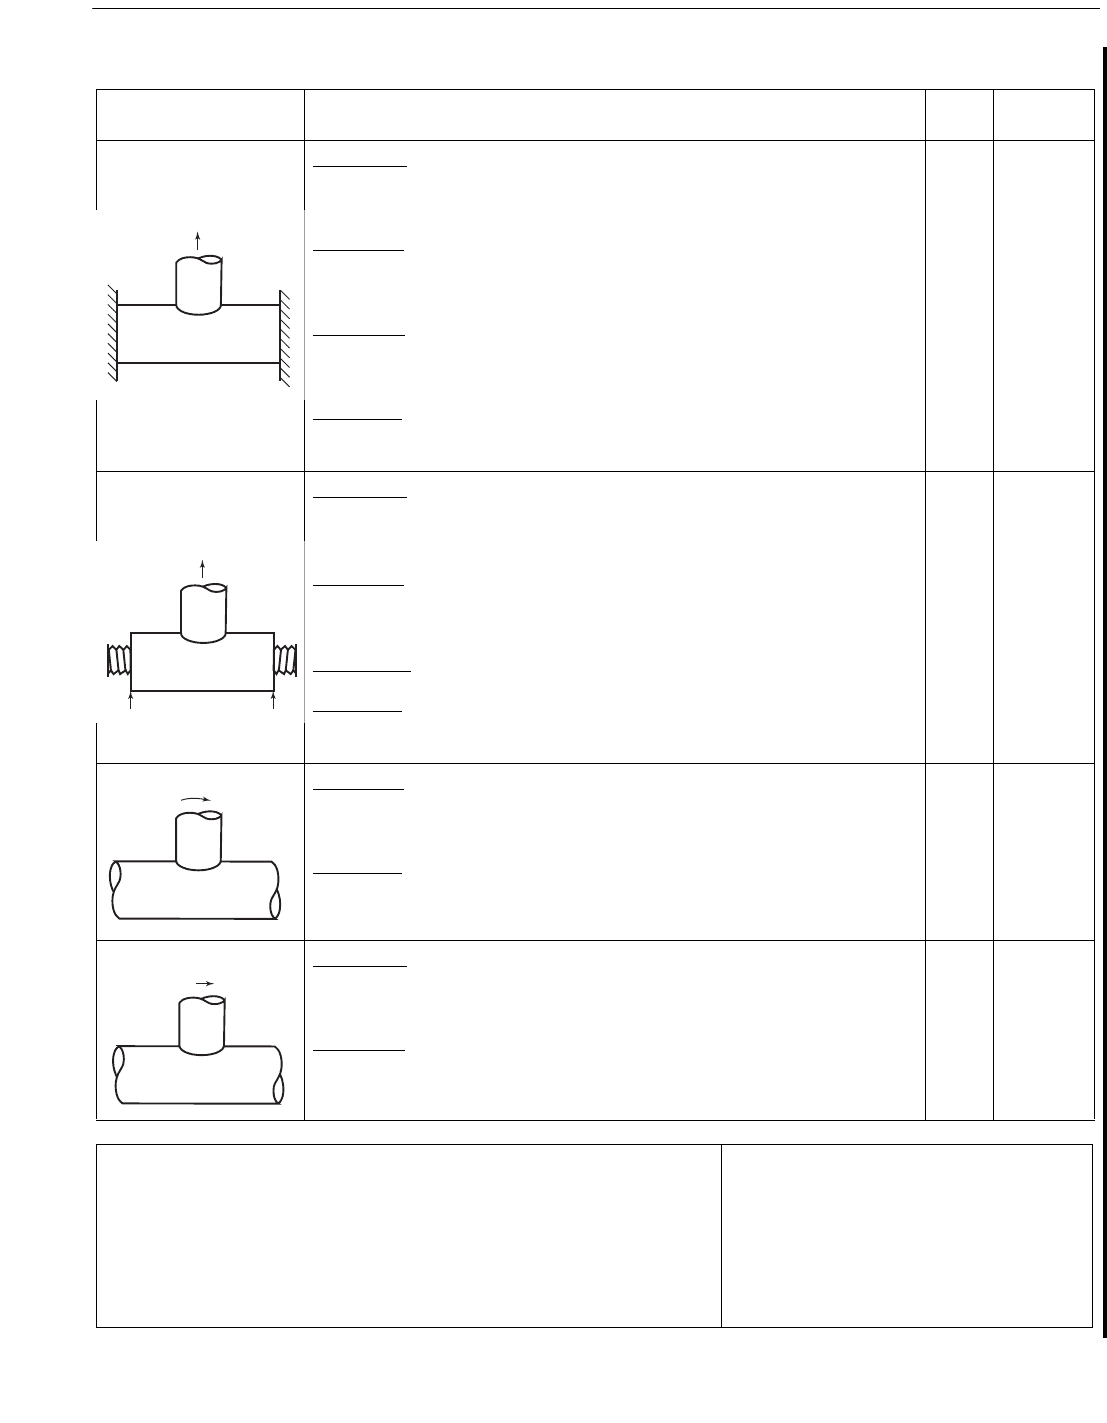
Table C5.3.2-1—Equations for SCFs in T/Y Joints
05
Load Type and
Fixity Conditions SCF Equations
Equation
No.
Short Chord
Correction
Axial Load –
Chord ends fixed
Chord saddle
Chord crown
Brace saddle
Brace crown
T1
T2
T3
T4
F1
None
F1
None
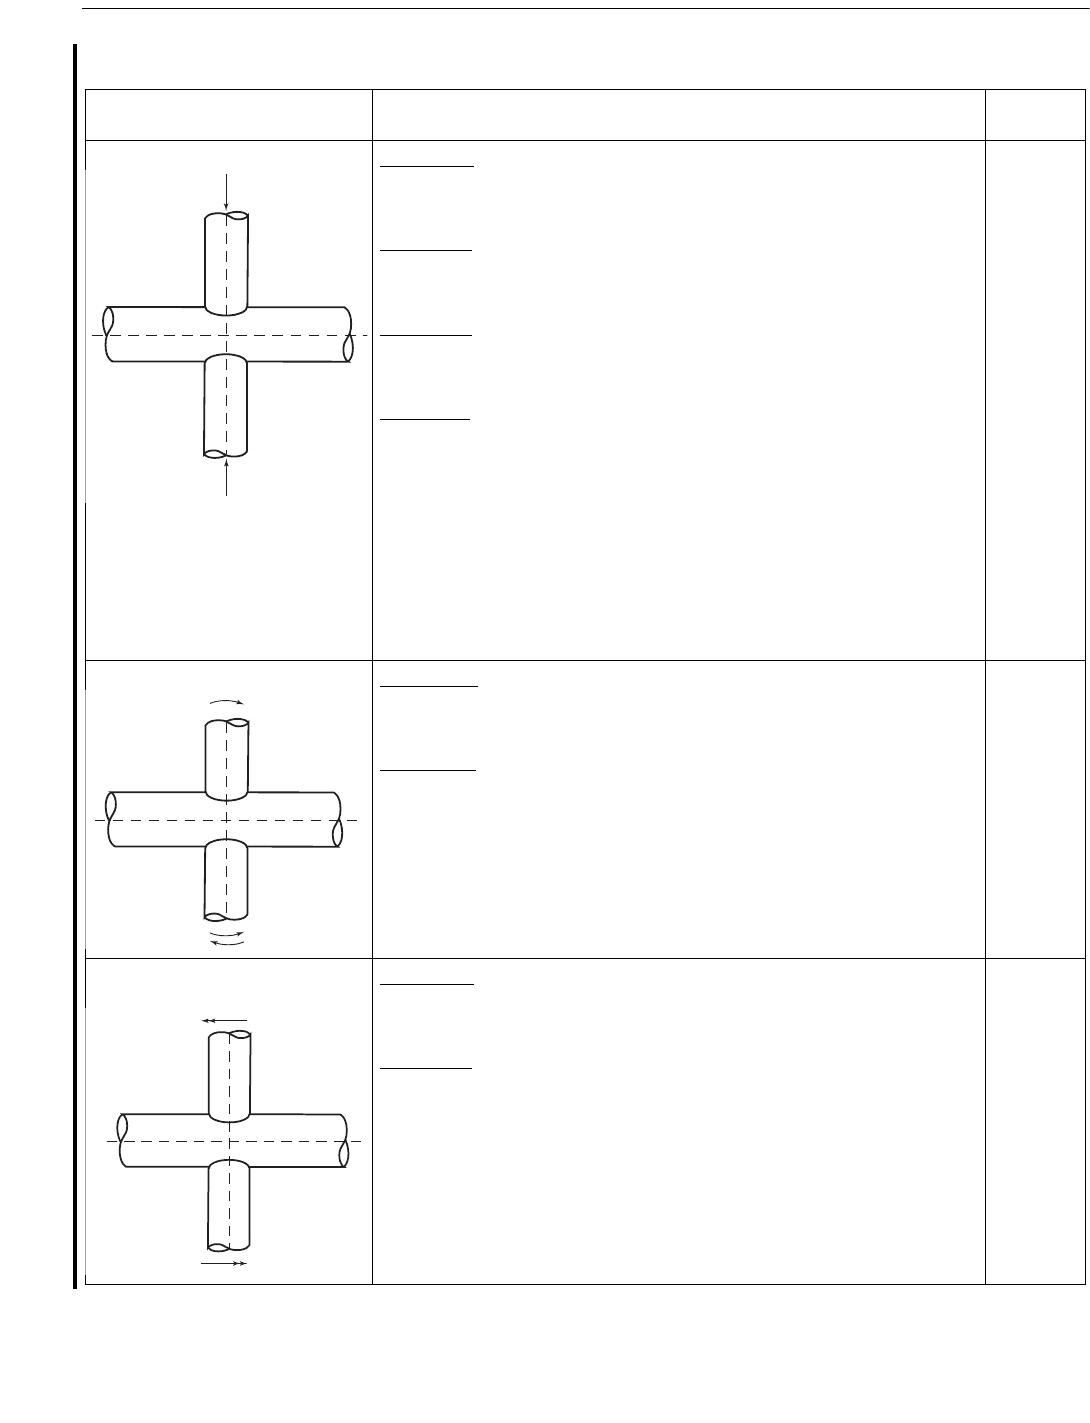
Axial Load –
General fixity conditions
Chord saddle
Chord crown
Brace saddle: Eqn. T3
Brace crown
T5
T6
T7
F2
None
None
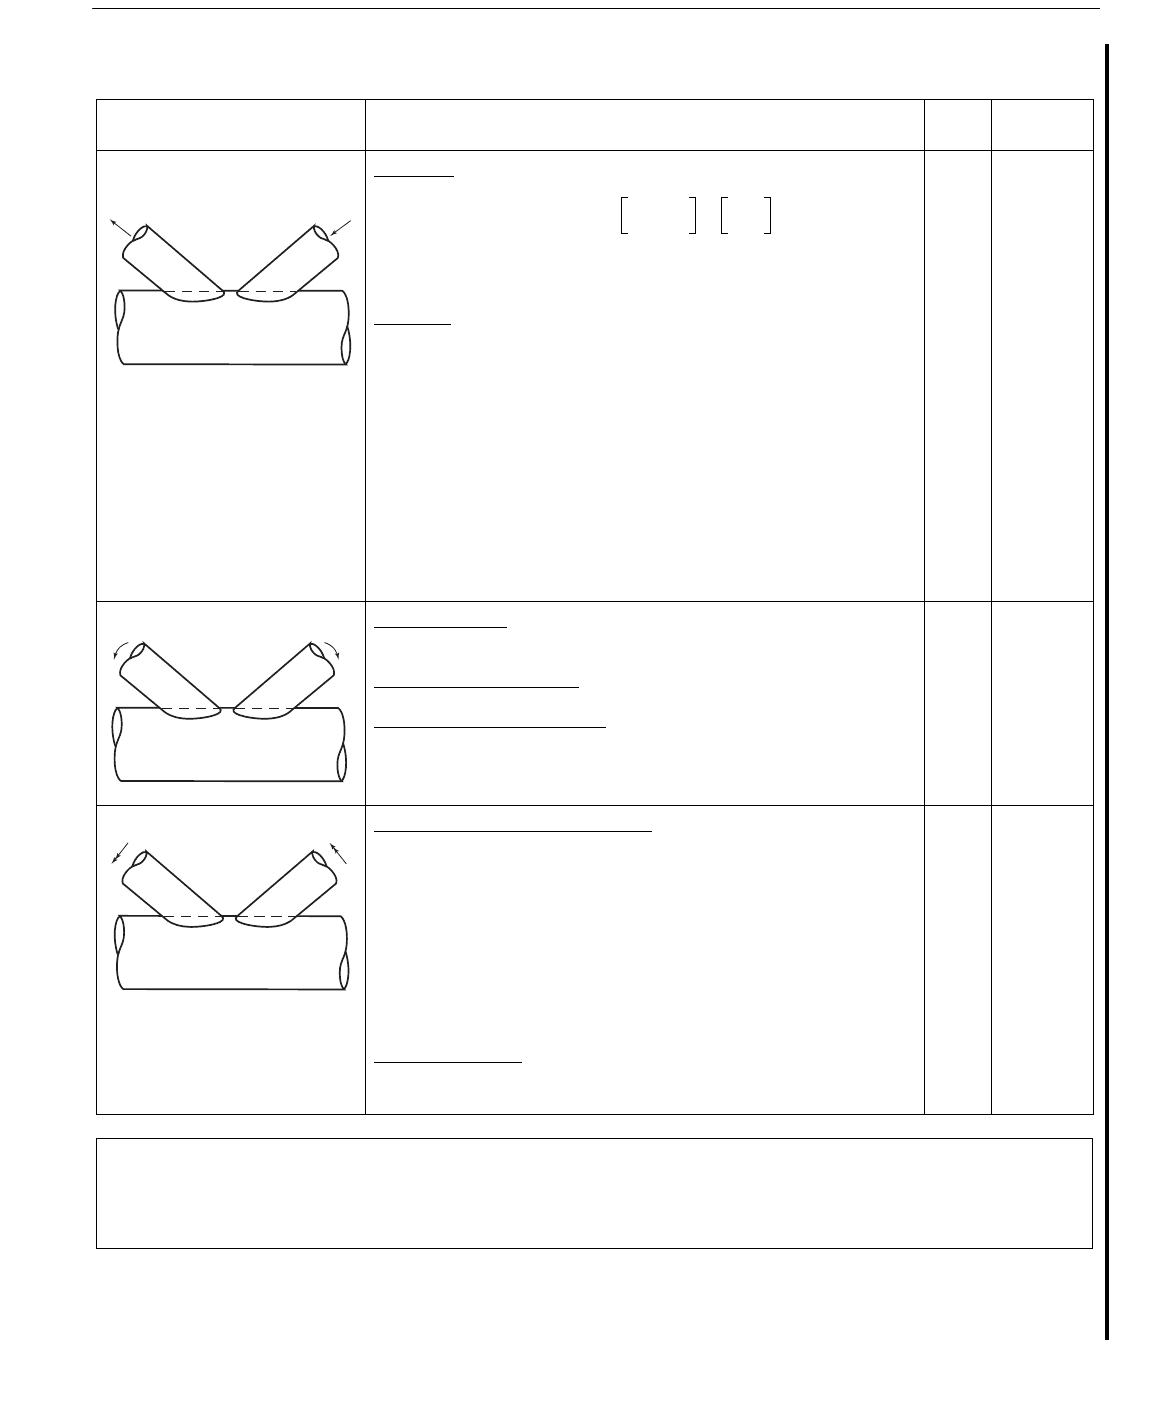
In-Plane Bending Chord crown
Brace crown
T8
T9
None
None
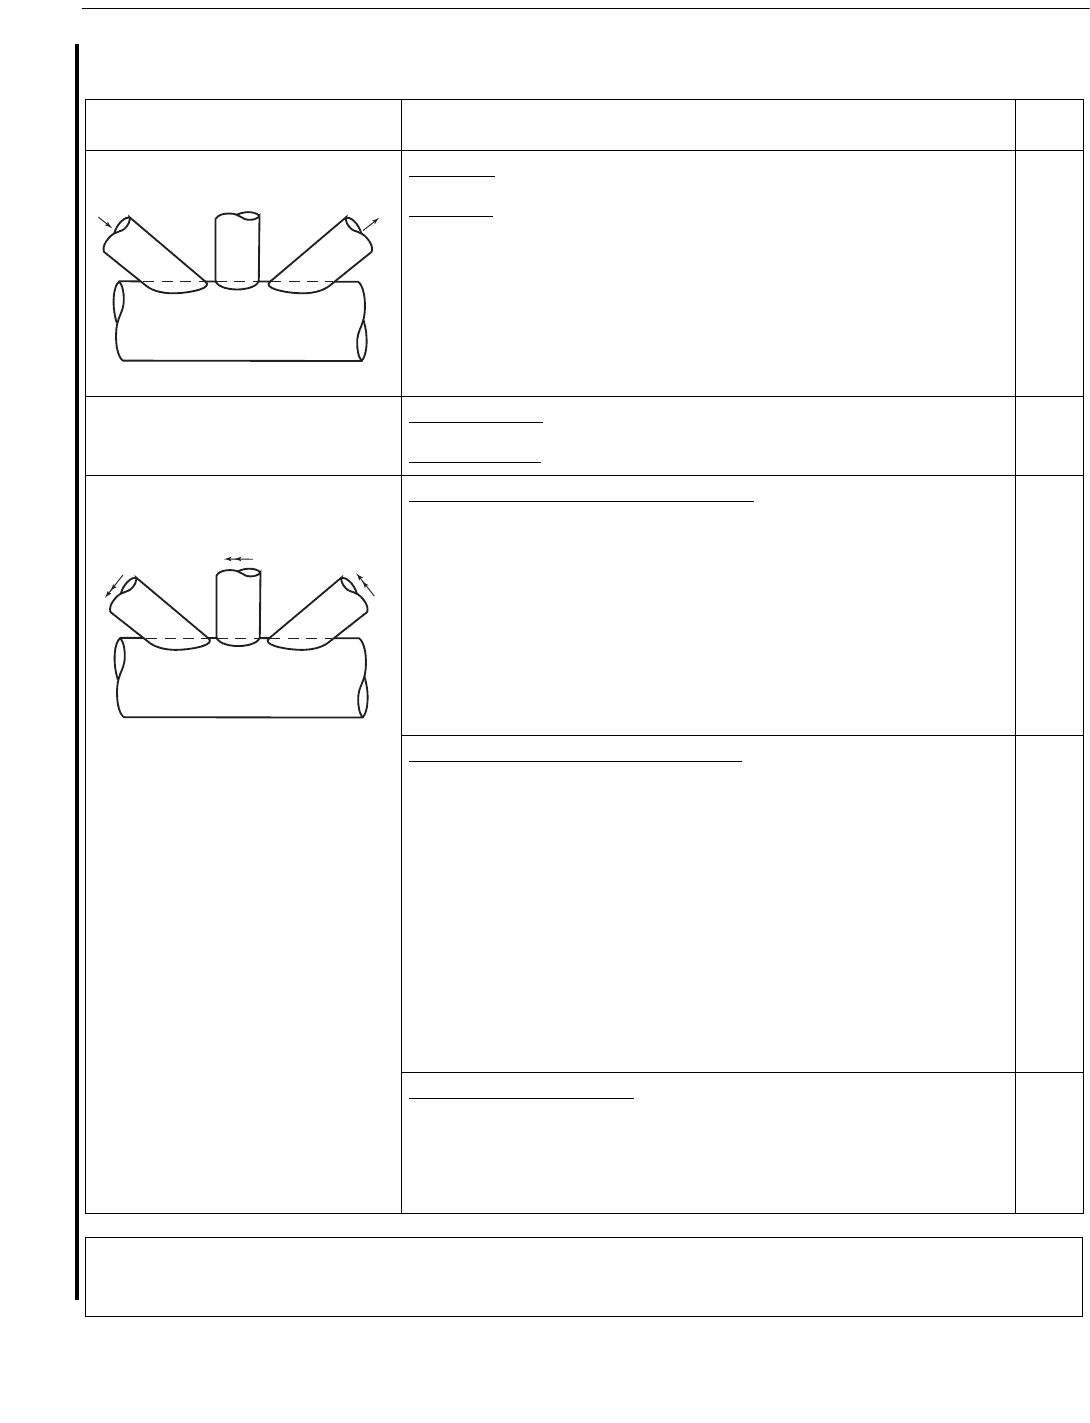
Out-of-Plane Bending Chord saddle
Brace saddle
T10
T11
F3
F3
Short Chord Correction Factors (a < 12)
where exp (x) = e
x
Chord-end Fixity Parameter C
0.5 ≤ C ≤ 1.0, Typically C = 0.7
C
1
= 2(C – 0.5)
C
2
= C/2
C
3
= C/5
γτ
1.1
1.11 3 β 0.52–()
2
–[]sin
1.6
θ
γ
0.2
τ 2.65 5 β 0.65–()
2
+[]τβ0.25α 3–()θsin+
1.3 γτ
0.52
+ α
0.1
0.187 1.25β
1.1
β 0.96–()–[]sin
2.7 0.01α–()
θ
3 γ
1.2
0.12 4β–()exp 0.011β
2
0.045–+[]βτ0.1α 1.2–()++
T1[]C
1
0.8α 6–()τβ
2
1 β
2
–()
0.5
sin
2
2θ+
γ
0.2
τ 2.65 5 β 0.65–()
2
+[]τβC
2
α 3–()θsin+
3 γ
1.2
0.12 4β–()exp 0.011β
2
0.045–+[]βτC
3
α 1.2–()++
1.45βτ
0.85
γ
1 0.68β–()
sin
0.7
θ
10.65βτ
0.4
γ
1.09 0.77β–()
sin
0.06γ 1.16–()
θ+
γτβ 1.7 1.05β
3
–()sin
1.6
θ
τ
0.54–
γ
0.05–
0.99 0.47β–0.08β
4
+()T10[]×
F1 1 0.83β 0.56β
2
–0.02–()γ
0.23
0.21γ
1.16–
– α
2.5
[]exp–=
F2 1 1.43β 0.97β
2
–0.03–()γ
0.04
0.71γ
1.38–
– α
2.5
[]exp–=
F3 1 0.55β
1.8
γ
0.16
0.49γ
0.89–
– α
1.8
[]exp–=
Copyright American Petroleum Institute
Provided by IHS under license with API
Licensee=Indonesia location/5940240008
Not for Resale, 10/22/2008 00:07:12 MDT
--`,,```,,,`,,,,,,,,,,,,,,`,``,`-`-`,,`,,`,`,,`---
210 API RECOMMENDED PRACTICE 2A-WSD
Table C5.3.2-2—Equations for SCFs in X-Joints
05
Load Type SCF Equation
Equation
No.
Axial Load (balanced) Chord saddle
Chord crown
Brace saddle
Brace crown
In joints with short chords (α < 12) and closed ends, the saddle SCFs can be
reduced by the short chord factors F1 or F2 where
X1
X2
X3
X4
In-Plane Bending Chord crown:
Eqn. T8
Brace crown:
Eqn. T9
Out-of-Plane Bending
(balanced)
Chord saddle
Brace saddle
In joints with short chords (α < 12) and closed ends, Equations X5 and X6
can be reduced by the short chord factor F3 where
X5
X6
P
P
3.87γτβ 1.10 β
1.8
–()sin
1.7
θ
γ
0.2
τ 2.65 5 β 0.65–()
2
+[]3τβ θsin+
11.9γτ
0.5
+ β
0.9
1.09 β
1.7
–()sin
2.5
θ
3 γ
1.2
0.12 4β–()exp 0.011β
2
0.045–+[]+
F1 1 0.83β 0.56β
2
–0.02–()– γ
0.23
0.21γ
1.16–
α
2.5
–[]exp=
F2 1 1.43β 0.97β
2
–0.03–()– γ
0.04
0.71γ
1.38–
α
2.5
–[]exp=
M
M
or M
M
M
γτβ 1.56 1.34β
4
–()sin
1.6
θ
τ
0.54–
γ
0.05–
0.99 0.47β–0.08β
4
+()X5[]×
F3 1 0.55β
1.8
– γ
0.16
0.49γ
0.89–
α
1.8
–[]exp=
Copyright American Petroleum Institute
Provided by IHS under license with API
Licensee=Indonesia location/5940240008
Not for Resale, 10/22/2008 00:07:12 MDT
--`,,```,,,`,,,,,,,,,,,,,,`,``,`-`-`,,`,,`,`,,`---
RECOMMENDED PRACTICE FOR PLANNING, DESIGNING AND CONSTRUCTING FIXED OFFSHORE PLATFORMS—WORKING STRESS DESIGN 211
Table C5.3.2-3—Equations for SCFs in Gap/Overlap K-Joints
05
Load Type SCF Equations
Equation
No.
Short Chord
Correction
Balanced Axial Load Chord SCF
Brace SCF
where
C = 0 for gap joints,
C = 1 for the through brace,
C = 0.5 for the overlapping brace.
Note that and the nominal stress relate to the brace under con-
sideration. ATAN is arctangent evaluated in radians.
K1
K2
None
None
Unbalanced IPB Chord crown SCF: Eqn. T8
(For overlaps exceeding 30% of contact length use 1.2
x [T8])
Gap joint–brace crown SCF: Eqn. T9
Overlap joint–brace crown SCF: [T9] x (0.9 + 0.4 ) K3
None
None
Unbalanced OPB Chord saddle SCF adjacent to brace A:
where
Brace A saddle SCF:
K4
K5
F4
F4
Note that [T10]
A
is the chord SCF adjacent to brace A as estimated from Eqn. T10.
The designation of braces A and B is not geometry dependent. It is nominated by the user.
τ
0.9
γ
0.5
0.67 β
2
–1.16β+()θsin
θ
max
sin
θ
min
sin
-----------------
0.30
β
max
β
min
----------
0.30
×
1.64 0.29β
0.38–
ATAN 8ζ()+[]
1K1[]1.97 1.57β
0.25
–()τ
0.14–
sin
0.7
θ ++
Cβ
1.5
γ
0.5
τ
1.22
sin
1.8–
θ
max
θ
min
+()0.131 0.084ATAN 14ζ 4.2β+()–[]×
τβθ,,
β
T10[]
A
10.08β
Bγ
()
0.5
–0.8x–()exp[] +
T10[]
B
10.08β
Aγ
()
0.5
–0.8x–()exp[]2.05β
max
0.5
1.3x–()exp[]
x 1
ζθ
A
sin
β
A
----------------+=
τ
0.54–
γ
0.05–
0.99 0.47β–0.08β
4
+()K4[]×
F4 1 1.07β
1.88
0.16γ
1.06–
– α
2.4
[]exp–=
Copyright American Petroleum Institute
Provided by IHS under license with API
Licensee=Indonesia location/5940240008
Not for Resale, 10/22/2008 00:07:12 MDT
No reproduction or networking permitted without license from IHS
212 API RECOMMENDED PRACTICE 2A-WSD
Table C5.3.2-4—Equations for SCFs in KT-Joints
05
Load Type and
Fixity Conditions SCF Equations
Equation
No.
Balanced Axial Load Chord SCF:
Eqn. K1
Brace SCF:
Eqn. K2
For the diagonal braces, A and C use
For the central brace, B uses = maximum of
In-Plane Bending Chord crown SCF: Eqn. T8
Brace crown SCF:
Eqn. T9
Unbalanced
Out-of-Plane Bending
Chord saddle SCF adjacent to diagonal brace A:
+
+
where
and
KT1
Chord saddle SCF adjacent to central brace A:
+
+
where
and
KT2
Brace saddle SCFs under OPB:
Obtained from the adjacent chord SCFs using
where SCF
chord
= KT1 or KT2
KTB
In joints with short chords (α < 12) Eqns. KT1, KT2, KTB can be reduced by the short chord factor F4 where F4 = 1.
ABC
ζζ
AB
ζ
BC
β
B
++=
ζ
ζ
AB
ζ
BC
,
A
B
C
T10[]
A
10.08β
Bγ
()
0.5
0.8x
AB
–()exp–[]10.08β
Cγ
()
0.5
0.8x
AC
–()exp–[]•
T10[]
B
10.08β
Aγ
()
0.5
0.8x
AB
–()exp–[]2.05β
max
0.5
1.3x
AB
–()exp[]•
T10[]
C
10.08β
Aγ
()
0.5
0.8x
AC
–()exp–[]2.05β
max
0.5
1.3x
AC
–()exp[]•
x
AB
1
ζ
AB
θ
A
sin
β
A
---------------------+=
x
AC
1
ζ
AB
ζ
BC
β
B
++()θ
A
sin
β
A
----------------------------------------------------+=
T10[]
B
10.08β
Aγ
()
0.5
0.8x
AB
–()exp–[]
β
A
β
B
⁄()
2
•
10.08β
Cγ
()
0.5
0.8x
BC
–()exp–[]
β
C
β
B
⁄()
2
•
T10[]
A
10.08β
Bγ
()
0.5
0.8x
AB
–()exp–[]• 2.05β
max
0.5
1.3x
AB
–()exp[]•
T10[]
C
10.08β
Bγ
()
0.5
0.8x
BC
–()exp–[]• 2.05β
max
0.5
1.3x
BC
–()exp[]•
x
AB
1
ζ
AB
θ
B
sin
β
B
---------------------+=
x
BC
1
ζ
BC
θ
B
sin
β
B
---------------------+=
τ
0.54–
γ
0.05–
0.99 0.47β–0.08β
4
+()SCF
chord
×
1.07β
1.88
0.16γ
1.06–
– α
2.4
[]exp–
Copyright American Petroleum Institute
Provided by IHS under license with API
Licensee=Indonesia location/5940240008
Not for Resale, 10/22/2008 00:07:12 MDT
--`,,```,,,`,,,,,,,,,,,,,,`,``,`-`-`,,`,,`,`,,`---

RECOMMENDED PRACTICE FOR PLANNING, DESIGNING AND CONSTRUCTING FIXED OFFSHORE PLATFORMS—WORKING STRESS DESIGN 213
lytical SCF for weld toe position was presented in the seminal
volume for deBack’s retirement (Ref. 31). A more robust for-
mulation is now proposed (Ref. 76):
SCF
corr
= 1 – (L
a
– L)/L
mp
where:
SCF
corr
= the correction factor applied to Efthymiou SCF,
L
a
= the actual weld toe position (typical of yard
practice),
L = the nominal weld toe position (Figure 2.15 of
Ref. 28),
L
mp
= the moment persistence length (distance from
nominal toe to reversal of shell bending stress).
Various expressions for L
mp
are shown in Table C5.3.2-5
as a function of joint type, load type, and hotspot orientation.
R and T are radius and thickness, respectively, of the joint
can. Consistency in format with the rules for strain gage
placement at crown and saddle position may be noted.
Attempts to produce an improved as-welded profile often
result in over-welding. As such, high estimates of L
mp
(low
estimates of local stress gradient) will produce conservative
corrections. This approach assumes that the weld is not so
massive as to change the overall load distribution in the joint
can, nor so finely tapered that positions other than the weld
toe become critical, and that local hotspot stresses are domi-
nated by shell bending stress.
Despite accounting for actual weld toe position, a residual
effect of weld profile remains apparent in Hartt’s seawater
data (Ref.33), as shown in Figure 7.19 of Ref. 28. Here, at
thicknesses greater than 16 mm, the higher performance of
concave as-welded profiles is expressed in a smaller size
effect exponent than for basic flat profiles. This variable size
effect is discussed in the commentary on S-N curves.
(b) Double-Dipping. This term refers to the possibility of
including the chord effect (CE) stresses twice: first because it
is embedded in Efthymiou’s SCF for T and Y connections,
and again when chord stresses are extracted from the frame
analysis. One should use either the chord bending from
Efthymiou, or that from the frame analysis, but not both. The
effect of average chord axial load should always be added.
A serious problem with the Efthymiou SCF equations is
that they focus on accurately predicting hot spot stresses in
isolated planar research joints as would be mounted in a test
frame, rather than visualizing a tubular joint as part of a three-
dimensional jacket. This is particularly evident in the case of
the T-joint formulae, where the implicit effects of beam bend-
ing in the chord are introduced via terms containing alpha (α
= 2L/D, not the ovalizing term in Table C5.1-1).
Since most users do not have access to the source code for
popular jacket analysis software, choices will be limited to
the built-in options. There are various ways to interpret the
choice of effective length L, given lengths L1 and L2 of the
two chord members adjoining the T-joint in question. This
assumes that the adjacent nodes are also braced points in the
jacket space frame. If not, the whole length-based method
breaks down.
A general way to represent all the various patterns of bend-
ing is to take L = 4 M/P (for C = 1), where M in in-plane
bending moment in the chord and P is the axial load in the T-
joint brace being considered.
A second consequence of the use of chord length α in
Efthymiou’s SCF formulas is that it reflects the use of rigid
diaphragm at the ends of the chord in a typical test arrange-
ment. When the length is less than 6 diameters (α less than
12), a correction term kicks in, representing the strengthening
effect of diaphragms in suppressing chord ovalizing. In typi-
cal structures, not only are the diaphragms absent, but we
have the potentially weakening effect of short joint cans.
This latter effect is particularly acute at the bottom of an
ungrouted jacket leg.
Thus, the recommended protocol is to assume a standard α
of 12 and C of 0.5 (which makes most of the complicating
terms drop out of Efthymiou’s SCF), and use the frame analy-
sis chord nominal stress, axial plus bending in the joint can,
average of the adjoining chord segments. It is tempting to try
to back out the small amount of bending that remains in
Efthymiou, but this gets complicated in practice.
(c) Influence Functions. The concept of Influence Func-
tions as a generalization of the SCF method of evaluating hot
spot stress ranges is described in Refs. 48 and 26. This
method is more accurate than the SCF approach because it
can synthesize generalized loads and moments on all of the
braces forming the joint, as opposed to the SCF approach
which is based on individual planes and joint classification.
The Influence Function algorithm is consistent with the SCF
approach in the sense that it will lead to identical results as
the SCF approach for a joint that is loaded and classed in the
manner that is assumed by the SCF approach. In addition to
being more robust than the SCF approach, the Influence
Function concept obviates the need to classify joints a priority
and, hence, is more convenient to use. An additional advan-
tage is that it has been extended in Refs. 48 and 20 to handle
05
Table C5.3.2-5—Expressions for L
mp
Circumferential stress at saddle:
All loading modes L
mp
= (0.42 - 0.28 β) R
Angle = (24 – 16 β) degrees
Longitudinal stress at crown:
Axisymmetric L
mp
= 0.6 √(RT)
Gap (g) of K-joint L
mp
= lesser of 0.6 √(RT) or g/2
Outer heel/toe, axial L
mp
= 1.5 √(RT)
In-plane bending L
mp
= 0.9 √(RT)
05
Copyright American Petroleum Institute
Provided by IHS under license with API
Licensee=Indonesia location/5940240008
Not for Resale, 10/22/2008 00:07:12 MDT
--`,,```,,,`,,,,,,,,,,,,,,`,``,`-`-`,,`,,`,`,,`---

214 API RECOMMENDED PRACTICE 2A-WSD
multi-planar joints for the important case of axial brace load-
ing. A disadvantage of the Influence Function algorithm is
that it is less transparent than the direct SCF approach and
also it may not be as widely automated in commercial com-
puter software.
For complex joints of particular interest, specific Influence
Coefficients and hot spot stresses may be accurately estab-
lished by developing a detailed local FE model of the joint and
incorporating this model into the overall fatigue analysis
(frame) model of the substructure (see Ref. 53). The advantage
of this approach is that it captures brace-in-frame coupling of
axial load and bending, as well as all brace and chord loads
and moments, including phase differences, and all geometric
stress concentration effects, including multi-planar effects.
(d) Tubular Joints Welded From One Side. Single-
sided welding is used as the principal method for connecting
braces to chords in tubular joints for offshore structures in
many areas of the world. Single-sided welding presupposes
that the critical fatigue crack typically initiates at the outer
weld toe. However, if the stress concentration factor at the
internal weld root of a tubular joint is relatively large com-
pared to that at the external weld toe (e.g., SCF
in
> 0.7 x
SCF
ex
), then the crack may initiate at the internal weld root
due to the more onerous S-N curve relevant for the root detail
than for the external weld toe. A log-log re-plot of the SAE
notch stress analysis in Figure 7.11 in Ref. 28 indicates that
the weld root at AWS detail D has 70% of the fatigue strength
of the weld toe at detail A for 1-inch branch thickness, and a
size effect exponent of 0.40 instead of 0.20. This degraded
root behavior is consistent with OTJTC curve “Z”, having the
S-N knee extended to 10
8
cycles, and is particularly impor-
tant when weld improvement techniques are employed exter-
nally. For further information, see Refs. 54 and 55.
C5.3.3 SCFs in Internally Ring Stiffened Tubular
Joints
The Lloyds equations for ring-stiffened joints are given in
Ref. 56. The following points should be noted regarding the
equations:
a. The derived SCF ratios for the brace/chord inter-section
and the SCFs for the ring edge are mean values, although
the degree of scatter and proposed design factors are
given.
b. Short chord effects must be taken into account where
relevant.
c. For joints with diameter ratio β > 0.8, the effect of stiffen-
ing is uncertain. It may even increase the SCF.
d. The maximum of the saddle and crown values should be
applied around the whole brace/chord intersection.
e. The minimum SCF for the brace side under axial and OPB
loading should be taken as 2.0. A minimum value of 1.5 is
recommended for all other locations.
The following observations can be made about the use of
ring stiffeners in general:
f. Thin shell FE analysis should be avoided for calculating
the SCF if the maximum stress is expected to be near the
brace-ring crossing point. Special consideration should be
given to this crossing point in the fatigue analyses.
g. Ring stiffeners have a marked effect on the circumferential
stress in the chord, but have little or no effect on the longi-
tudinal stress.
h. Ring stiffeners outside the brace footprint have a modest
effect on the SCF, but may be of greater help for static
strength.
i. Failures in the ring inner edge or brace ring interface occur
internally and will probably only be detected after through
thickness cracking, at which time the majority of the
fatigue life will have been expended. These areas should
therefore be considered as non-inspectable unless more
sophisticated inspection methods are used.
C5.3.4 SCFs in Grouted Joints
Grouted joints have either the chord completely filled with
grout (single skin grouted joints) or the annulus between the
chord and an inner member filled with grout (double skin
grouted joints). The SCF of a grouted joint can be influenced
by the load history. The SCF is lower when the bond between
the chord and the grout is unbroken. Due to disbonding of the
grout, the tensile and compressive SCF may be different. The
larger value should be used in fatigue analysis.
Grouted joints may be treated as simple joints except that
the chord thickness in the γ term for SCF calculation for brace
and chord saddle points may be substituted with an equiva-
lent chord wall thickness given by:
T
eff
= 0.035 D + 0.93 T
can
where D and T
can
are chord outer diameter and thickness,
respectively, this formulation been derived on the basis of
engineering mechanics and testing. However, it can be un-
conservative for the gap region of axially loaded K-joints
(Ref. 28).
Joints with high β or low γ ratios experience little effect of
grouting. Although fully substantiated evidence is not avail-
able, the benefits of grouting should be neglected for joints
with β > 0.9 or γ < 12 unless documented otherwise. A mini-
mum SCF value of 1.5 is recommended for all locations.
C5.3.5 SCFs in Cast Nodes
It is recommended that finite element analysis should be
used to determine the magnitude and location of the maxi-
mum stress range in castings sensitive to fatigue. The finite
element model should use volume elements at the critical
areas and properly model the shape of the joint. The peak
05
05
Copyright American Petroleum Institute
Provided by IHS under license with API
Licensee=Indonesia location/5940240008
Not for Resale, 10/22/2008 00:07:12 MDT
--`,,```,,,`,,,,,,,,,,,,,,`,``,`-`-`,,`,,`,`,,`---

RECOMMENDED PRACTICE FOR PLANNING, DESIGNING AND CONSTRUCTING FIXED OFFSHORE PLATFORMS—WORKING STRESS DESIGN 215
local stress at the fillet radius will generally be higher than the
Efthymiou geometric SCF for comparable cylindrical config-
uration, as indicated in Roark’s case 8B (Ref. 3). Consider-
ation should be given to stresses at the inside of the castings.
The brace-to-casting girth weld (which is designed to the
appropriate weld class in C5.4) may be the most critical loca-
tion for fatigue, especially at the ID root.
C5.4 S-N CURVES FOR ALL MEMBERS AND
CONNECTIONS, EXCEPT TUBULAR JOINTS
API RP 2A-WSD Editions up to and including this supple-
ment, make reference to ANSI/AWS D1.1. However, British
Standards, which form the basis of the proposed ISO nominal
stress curves (Ref. 34) and those in other international stan-
dards have been broadly used offshore and have a clear pedi-
gree. DNV (Ref. 72) have addressed the use of hot spot stress
for non-tubular details, and have ongoing JIP research in this
area. The DNV and proposed ISO guidance, together with the
weld detail categories described therein, represents a reason-
ably complete practice and can therefore be recommended
here as an alternative. However, the new 2002 AWS criteria
cited herein for constant cycle nominal stress in air are based
on essentially the same international database, and are simi-
larly comprehensive.
For cumulative fatigue damage under random variable
loads, the shape of the long-term stress distribution is
expressed in terms of the Weibull parameter ξ (see C5.1). If
the constant amplitude fatigue limit (CAFL) is retained, use
of Miner’s rule (Eq. 5.2.4-1) errs on the unsafe side. This is
predicted by fracture mechanics, using an initial flaw size and
ΔK threshold, which reproduces the CAFL. Ongoing crack
growth will occur at lower applied stresses, once higher
stresses have enlarged the initial flaw. Extending the steeply
sloping (m = 3) part of the S-N curve beyond the CAFL knee
produces a conservative estimate of cumulative damage for
all values of ξ. For typical traffic load patterns in bridges
(ξ > 2), Fisher recommends taking the 99.99 percentile
stress
at the CAFL (Ref. 73). For typical marine stress spectra (ξ of
0.5 to 2) the recommended practice is to extend the S-N curve
at an inverse slope of m = 5 beyond the CAFL knee, creating
a bi-linear plot. This is justified experimentally in Figure 3 of
Ref. 74, for a transverse welded detail having a knee near 10
7
cycles in air, and the C/12/20 North Sea spectrum (ξ of 1.3).
Note that long term RMS stress cannot be compared directly
to the bi-linear S-N curve, but Strating (cited in Ref.8) found
that short term significant stress range (4√m
o
) can.
For seawater service, both DNV and proposed ISO suggest
the following construction: With effective cathodic protec-
tion, the m = 3 portion of the bi-linear curve is reduced by a
factor of 2.5 on life, while the m = 5 portion remains
unchanged and is extended to meet the new steeper part. For
free corrosion, the m = 3 curve is reduced by a factor of 3.0
on life and there is no knee.
For single-sided open-root butt welds in which the root
sees the full calculated stress, the following S-N curves in
ANSI/AWS D1.1-2002 Figure 2.11 may be considered, as
modified above: Class E' with loss factor deduction for tight
root caisson welds; Class E for WPS and welder qualified per
D1.1 Figure 4.24; Class D for special technique and inspec-
tion (e.g., TIG).
C5.5 S-N CURVES FOR TUBULAR CONNECTIONS
C5.5.1 Basic S-N Curves for Welded Joints
This section is based on the assumption that the connection
has full penetration single or double sided welding. We begin
by discussing the basis of the proposed ISO hotspot design
approach (Refs. 34 and 67), from which the new API curves
are derived.
Offshore structures are subjected to variable amplitude
fatigue stresses. However, the prediction of fatigue damage
under variable amplitude loading is a complex subject and the
most commonly adopted approach for the assessment of off-
shore structures is the use of the Palmgren-Miner summation
law.
A limited number of variable amplitude fatigue tests on
tubular joints have been undertaken and the results compared
with constant amplitude S-N curves using an equivalent
stress range which has been defined as the cube root of the
average value of (stress)
3
. This indicates that the Miner’s sum
for the mean S-N curve falls essentially within the range 0.5
to 2.0, with an average value of 1.8. A significantly larger
number of test results are available for plate joints, which
give an average Miner’s sum of 1.1.
The S-N curves for tubular joints are based on a compre-
hensive review of fatigue data for both tubular and plated
joints. The background information is presented in Refs. 35
and 36. The basic tubular joint S-N curve has been derived
from an analysis of data on tubular joints manufactured using
welds conforming to a standard flat profile given in AWS.
The S-N curves apply to crack growth through thickness.
Although through thickness cracking was taken to define fail-
ure, it may be noticed that for many types of components,
there is reserve life after that.
U.S. investigations in this field have been carried out by
Hartt, and the international data was reviewed by EWI, on
behalf of API. Both the HSE (Ref. 35) and EWI (Ref. 36)
investigations concur on the general form of basic S-N curves
which relate to in-air conditions. Separate curves are pre-
sented (in Refs 35 and 36) for joints in seawater with adequate
corrosion protection (–850mV to –1100mV), with Hartt’s data
(Refs. 6, 9, 19, and 33) tending to confirm existing API curves
(see Figure 5.5-4 in 11
th
–21
st
editions). Fatigue data for tubu-
lar joints indicate that, in general, there is a reduction in the
fatigue performance in seawater under cathodic protection in
the low life region (i.e. endurances less than 10
6
cycles) with
the fatigue lives being restored to that of in-air at longer
05
05
Copyright American Petroleum Institute
Provided by IHS under license with API
Licensee=Indonesia location/5940240008
Not for Resale, 10/22/2008 00:07:12 MDT
--`,,```,,,`,,,,,,,,,,,,,,`,``,`-`-`,,`,,`,`,,`---

216 API RECOMMENDED PRACTICE 2A-WSD
endurances. Ref. 37 presents the results from fracture mechan-
ics evaluations, and illustrates the detrimental effect of seawa-
ter relative to air for joints with and without adequate cathodic
protection. Therefore, use of the new S-N curves given in
Table 5.5.1-1 include a penalty factor of 2 for the low cycle
end of the S-N curve (the m = 3 portion).
For joints in freely corroding conditions, or for joints with
corrosion protection levels more negative than -1100mV at the
welds, a penalty factor of 3 on N on the air m = 3 life, extended
for all endurances without a change of slope, is recommended.
Most contemporary coatings used offshore will afford an
effective barrier to ingress of seawater. Their effectiveness as
an ionic barrier to hydrogen is less certain. Unless a particular
coating is very brittle in nature, or may become subject to
hydrogen blistering during the service life of the structure, use
can be made of the in-air S-N curves.
A number of tubular joints used in deriving the basic S-N
curve had chord and braces with nearly equal diameters and
weld leg/branch thickness ratios up to 5. Some of these joints
showed extensive weld inter-run cracking in preference to
weld toe cracking. This could be significant in relation to the
application of weld improvement techniques, since clearly
improvement of the chord or brace weld toes alone may not
improve the fatigue performance of the joint. This would only
be achieved if the weld face is also ground to remove all of the
inter-run crevices. However an assessment of these joints,
using the recommended SCF equations indicate that the pre-
dicted lives are significantly above the basic S-N curve.
High strength steels are being used increasingly in the fabri-
cation of offshore structures, particularly for jack-up legs,
which are made from steels with typical yield strengths of
100–115 ksi (700–800 MPa). The effect of seawater on the
fatigue performance of these materials is thought to be more
detrimental than for medium strength structural steels because
of their greater susceptibility to hydrogen cracking under
fatigue loading in seawater. The susceptibility to hydrogen
embrittlement increases with increasing yield strength and
increasingly negative cathodic protection potential. A number
of studies have identified excessively negative cathodic pro-
tection potential as a cause of cracking due to the generation
of hydrogen, which enhances crack growth rates at the crack
tip. Evidence of hydrogen cracking found in jack-ups during
routine surveys has been reported in Ref. 38. It is therefore
important that the fatigue performance of selected high
strength steels is understood and that appropriate levels of
cathodic protection are applied.
There is insufficient data on the fatigue behavior of high
strength steel joints and the fatigue performance of higher
strength steels cannot be confidently predicted. A limited
amount of test data for plate joints with yield strengths up to
80 ksi (560 MPa) (Ref. 35) and tubular joints manufactured
from modem high strength steels with yield strengths up to
100 ksi (700 MPa) (Ref. 39) have suggested that the fatigue
performance in seawater under cathodic protection and under
free corrosion is similar to that for medium strength structural
steels. Test data or fracture mechanics analysis may be used to
determine appropriate S-N curves.
Following ISO proposals, the new API “WJ” curves are bi-
linear, with slope exponents of m = 3 and m = 5, and no endur-
ance limit. The specified chord size effect now depends on
chord thickness rather than weld or notch size. However, since
curves drawn at the reference thickness of 16mm do not give a
realistic picture of their impact on practical joint-can designs,
comparisons are made with reference to joints having t = 16
mm branch and T = 40 mm chord, as discussed below.
(a) Profiled welds – formerly Curve X. Modified profile
and size effects for this category of joints give them an effec-
tive reference thickness of √(tT) = 1 in. The resulting in-air
curve corresponds closely to the 25 mm S-N curve of ISO
14347 (Ref. 67), which comes from an IIW panel of technical
experts in tubular connections with access to the same pub-
lished database as ISO TC67/WG3.
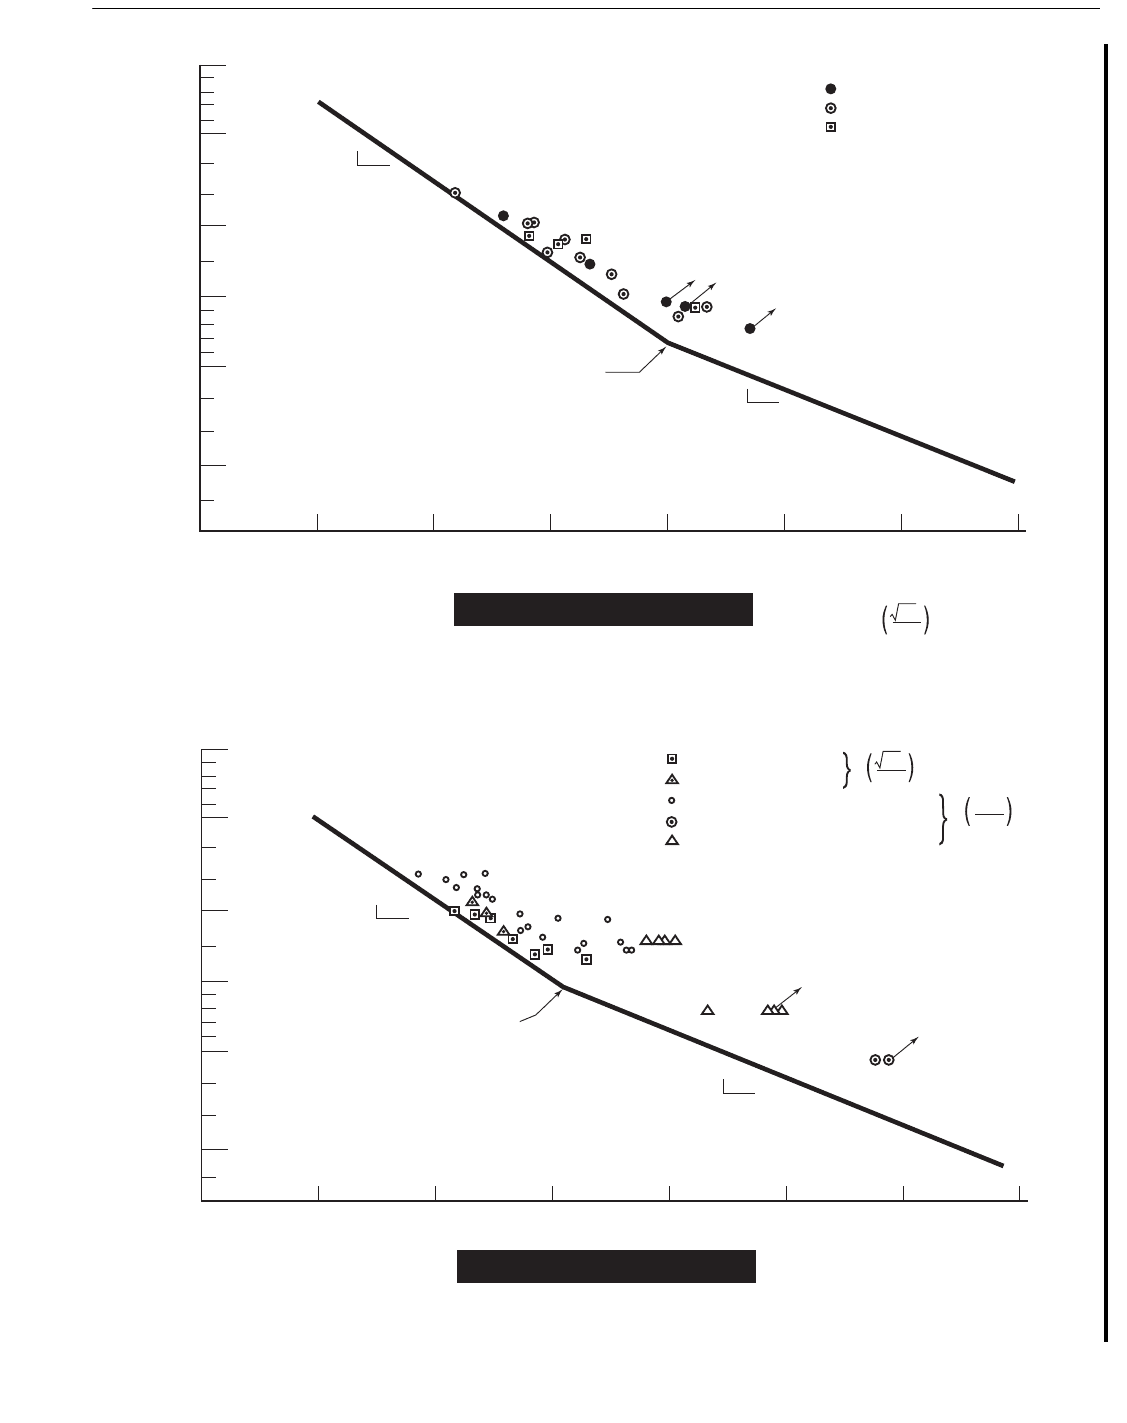
Figure C5.5.1-1 shows a data comparison for improved
profile welds in air, including tubular joint data from Bomel
(Ref. 68), the OTJRC database (Mohr et al, Ref. 36) and large
coupon data from Rice (in Refs. 18 and 28). Run-outs are
retained here as especially useful information, although they
are typically excluded from screened data sets. Adjustment of
the test data to the 16 mm reference thickness also tests the
n
ew API adjustment for weld toe position, the new size effect
exponent, and the τ
–0.1
form of the profile effect expression.
The data trend justifies flattening of the S-N curve beyond ten
million cycles. The least conservative fit appears to be the
m = 3 part from ISO.
Figure C5.5.1-2 shows a comparison of data for improved
profile welds in seawater with cathodic protection, again
reduced to the 16mm reference. This includes data from the
following sources: Hartt API 87-24 (Ref. 33), Bignonnet PS5
and Vosikovsky TS44 (Ref. 17), Kochera OTC 2604 (in old
API Fig. C5.5-3), and Hartt (Ref. 9). This plot is most impor-
tant for calibrating the new criteria for practical design of off-
shore platforms with cathodic protection. Again, runouts are
particularly useful here.
Hartt’s butt welds are used to represent the edge condi-
tion of profile welds made according to the upgraded AWS
Figure C2.7. One might argue that these data points need to
be adjusted downward slightly to account for the fillet
radius effect as discussed for cast nodes. However, if this
were done, the butt weld tests would simply be brought into
alignment with the others, and the overall trend of the data
remains consistent with flattening the high cycle part of the
S-N curve, which is more optimistic than the extrapolation
proposed in Reference 34.
The m = 3 part of the curve remains the least conserva-
tive, even though it was derived from the proposed ISO base
case and includes the penalty factor of two. Using the air
curve here, as proposed by ISO (Draft E), would be unsafe
wherever it mattered.
05
05
Copyright American Petroleum Institute
Provided by IHS under license with API
Licensee=Indonesia location/5940240008
Not for Resale, 10/22/2008 00:07:12 MDT
--`,,```,,,`,,,,,,,,,,,,,,`,``,`-`-`,,`,,`,`,,`---
RECOMMENDED PRACTICE FOR PLANNING, DESIGNING AND CONSTRUCTING FIXED OFFSHORE PLATFORMS—WORKING STRESS DESIGN 217
Figure C5.5.1-1—Basic Air S-N Curve as Applicable to Profiled Welds, Including Size and Toe
Correction to the Data
Figure C5.5.1-2—S-N Curve and Data for Seawater with CP
Cycles to Failure (N
3
)
Improved ProfileÑAir
Measured hot spots at weld
toe stress converted to 16mm
using
1000
500
200
100
50
20
10
10
3
10
4
10
5
10
6
10
7
10
8
10
9
10
10
Hot Spot Stress (MPa)
tT
16
0.2
OTJRC T = 32mm
Bomel T = 32mm*
Rice U T = 50mm
*Excl. 2 tests with
weld size of 4 to 5 t
(failure in weld, not toe)
1
3
1
67 MPa
@10
7
5
(3)
05
Cycles to Failure (N
3
)
Improved ProfileÑCathodic Protection
1000
500
200
100
50
20
10
10
3
10
4
10
5
10
6
10
7
10
8
10
9
10
10
Hot Spot Stress (MPa)
tT
16
0.2
0.2
T
16
Hartt T = 50mm
Hartt T = 25mm
UKOSRP T = 38mm SIMS PS5
Kochera T = 25mm OTC 2604
Hartt T = 25mm OTC 3962
Data adjusted to T = 16mm
using expression shown
butt welds
1
3
1
94 MPa
@1.8x10
6
5
(3)
Copyright American Petroleum Institute
Provided by IHS under license with API
Licensee=Indonesia location/5940240008
Not for Resale, 10/22/2008 00:07:12 MDT
No reproduction or networking permitted without license from IHS

218 API RECOMMENDED PRACTICE 2A-WSD
(b) Non-profiled joints. The unmodified “WJ” base curve
replaces former API curve X’. It corresponds most closely
to the proposed ISO CD 19902 base case, whose back-
ground for hotspot stress in simple tubular joints has already
been described. For joint cans with T = 40 mm, it corre-
sponds closely to criteria derived by the API Offshore
Tubular Joint Technical Committee, although OTJTC curve
“Y” would have been more conservative in the high cycle
range, and for heavier thicknesses.
No guidance is given in Section 5 for the application of
the hotspot method to more complex geometries, e.g., as
used in the design of tower-type fixed platforms, semisub-
mersibles, and other marine structures (ref. 27). Niemi and
others (Refs. 62 and 63) have investigated various protocols
for the defining the SCF. Niemi’s “structural hotspot stress”
is consistent with what Efthymiou used for simple joints.
Compatible hotspot design curves for ship details have been
promulgated by DNV and ABS (Ref. 64).
Reference 65 describes Battelle’s patented “New Struc-
tural Stress” definition and associated master S-N curve.
Similar to Ref. 66, line load tractions and shell bending
moments at the welded intersection are extracted, e.g. from
nodal forces in a thin shell, and converted to a linear combi-
nation of membrane and shell bending stress normal to the
weld. A JIP is in progress (2003) to sort out all the special
cases and verify the robustness of the approach.
DNV’s parallel competing JIP, “FPSO Fatigue Capacity”
(Ref. 72), takes an alternative approach to a similar prob-
lem, based on fatigue testing of a wide variety of ship-type
structural details, for a range of FEM analysis protocols.
Use of these new methods in the future is to be encour-
aged.
C5.5.2 Thickness Effect
Assessments by HSE (Ref. 35) and EWI (Ref. 36) of a
wide range of data for various combinations of loading have
shown that the fatigue performance is dependent on mem-
ber thickness, the performance decreasing with increasing
thickness for the same stress range when using the hot spot
S-N approach. This apparent size effect virtually disappears
(i.e., is captured by the methodology) when fatigue analysis
is conducted on a notch stress or fracture mechanics basis.
The ISO base case design curve is based on a material
thickness of 16mm. An exponent, which depends on weld
class is specified in these API provisions.
ISO 14347, Fatigue design procedures for welded hollow
section joints, should become an approved international
standard in 2004, with ballot comments in the DIS having
been already resolved in IIW s/c XV-E. The scope covers
circular tubes up to 50 mm thick. The size effect exponent
varies from 0.2 at 2000 cycles to 0.4 at about 10
7
cycles,
yielding a family of S-N curves which fan out in the high
cycle region.
Although the ISO 19902 proposal has a constant size
effect exponent of 0.25 for welded connections, which has
been in DoE and AWS design codes since the early 1980s,
the supporting data can also be used to make a case for a
variable exponent. Fracture mechanics predicts a size effect
exponent of 0.167 for m = 3, and 0.30 for m = 5.
MaTSU (Ref. 68) review thickness effect in profiled
welded joints, and found a size effect exponent of 0.44 for
welds with “poor” profiles in 28 tubular joints ranging from
16 to 76 mm thick. This report also vetted the Bomel report
described below.
BOMEL (Ref. 69) looked at data from 45 tubular joint
tests, 16-76 mm thick, with “satisfactory” weld profiles, and
found a size effect exponent of 0.22, i.e., a less severe penalty.
Since measured hot spot stresses were used in the database,
this benefit is in addition to that of extending the weld toe.
Criteria for “poor” versus “satisfactory” profiles were
judged to be subjective. Bomel were aware of the modified
disk test in AWS D1.1-94 (radius = 0.5t), but for practical
reasons most of the screening was done visually. Some of
the “satisfactory” welds were flat and ugly, but they were
grossly over-welded and passed the disc test at the chord
hotspot. Some of the “poor” welds did not even meet AWS
basic requirements. If all the data are combined, ignoring
any influence of weld profile, a size effect exponent of 0.30
is obtained.
EWI derived a thickness exponent of 0.29 for basic flat
welds. However, Mohr makes a case that comparison of
worst case bounds yields slightly lower size effect expo-
nents than the mean trend comparisons cited above.
The S.A.E Fatigue Design Handbook uses a local stress
approach, based on stresses averaged over 6 mm straddling
the weld toe. This picks up both notch effects and the geo-
metric size effect, as the gage length for larger specimens
will be deeper into the notch. To account for the statistical
size effect (larger specimens having a greater chance of
flaws at a given defect rate), fatigue strength is reduced by
the 0.034 power of highly stressed volume, corresponding
to a size effect exponent of 0.10. The same size effect
should in principle be applicable to cast nodes, which also
use local stress as their design basis.
Following the above discussion, a progression of size
effect exponents is given in 5.5.2, for various weld classes.
Basic flat welds get a round down of the exponent to 0.25.
Concave as-weld profiling as per AWS Figure C2.7 gets a
round-down of the exponent from 0.20. Toe grinding at con-
stant radius retains a small geometric size effect, as it does
not follow geometric similarity; however, OTJTC recom-
mended an exponent of 0.15 for this case.
The τ
-0.1
improvement factor for joints with profiled
welds, when considering fatigue in the joint can (T), is actu-
ally a size effect compromise between existing API (using
branch thickness t to represent the size of the notch, as indi-
05
05
Copyright American Petroleum Institute
Provided by IHS under license with API
Licensee=Indonesia location/5940240008
Not for Resale, 10/22/2008 00:07:12 MDT
No reproduction or networking permitted without license from IHS